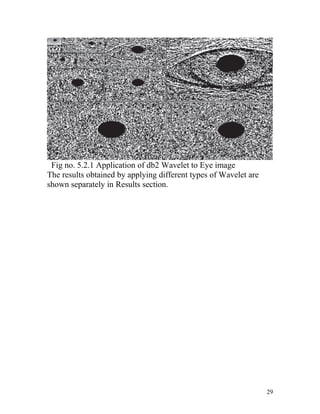
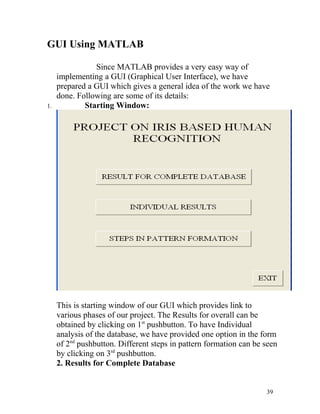
The project report details the development of an iris-based human recognition system, designed to accurately identify individuals using unique iris patterns as biometric parameters. The system involves several key processes including segmentation, normalization, feature extraction, and matching, utilizing the CASIA database for testing and validation. Overall, it aims to enhance security and reliability in identification systems amidst increasing concerns regarding privacy and authentication.


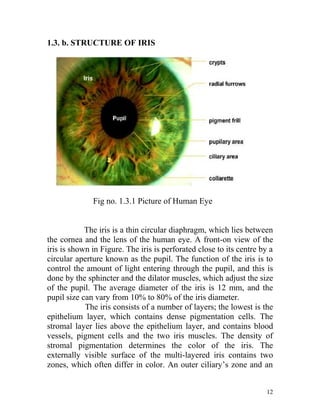
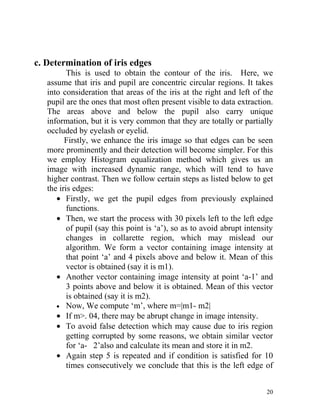
![CHAPTER 4
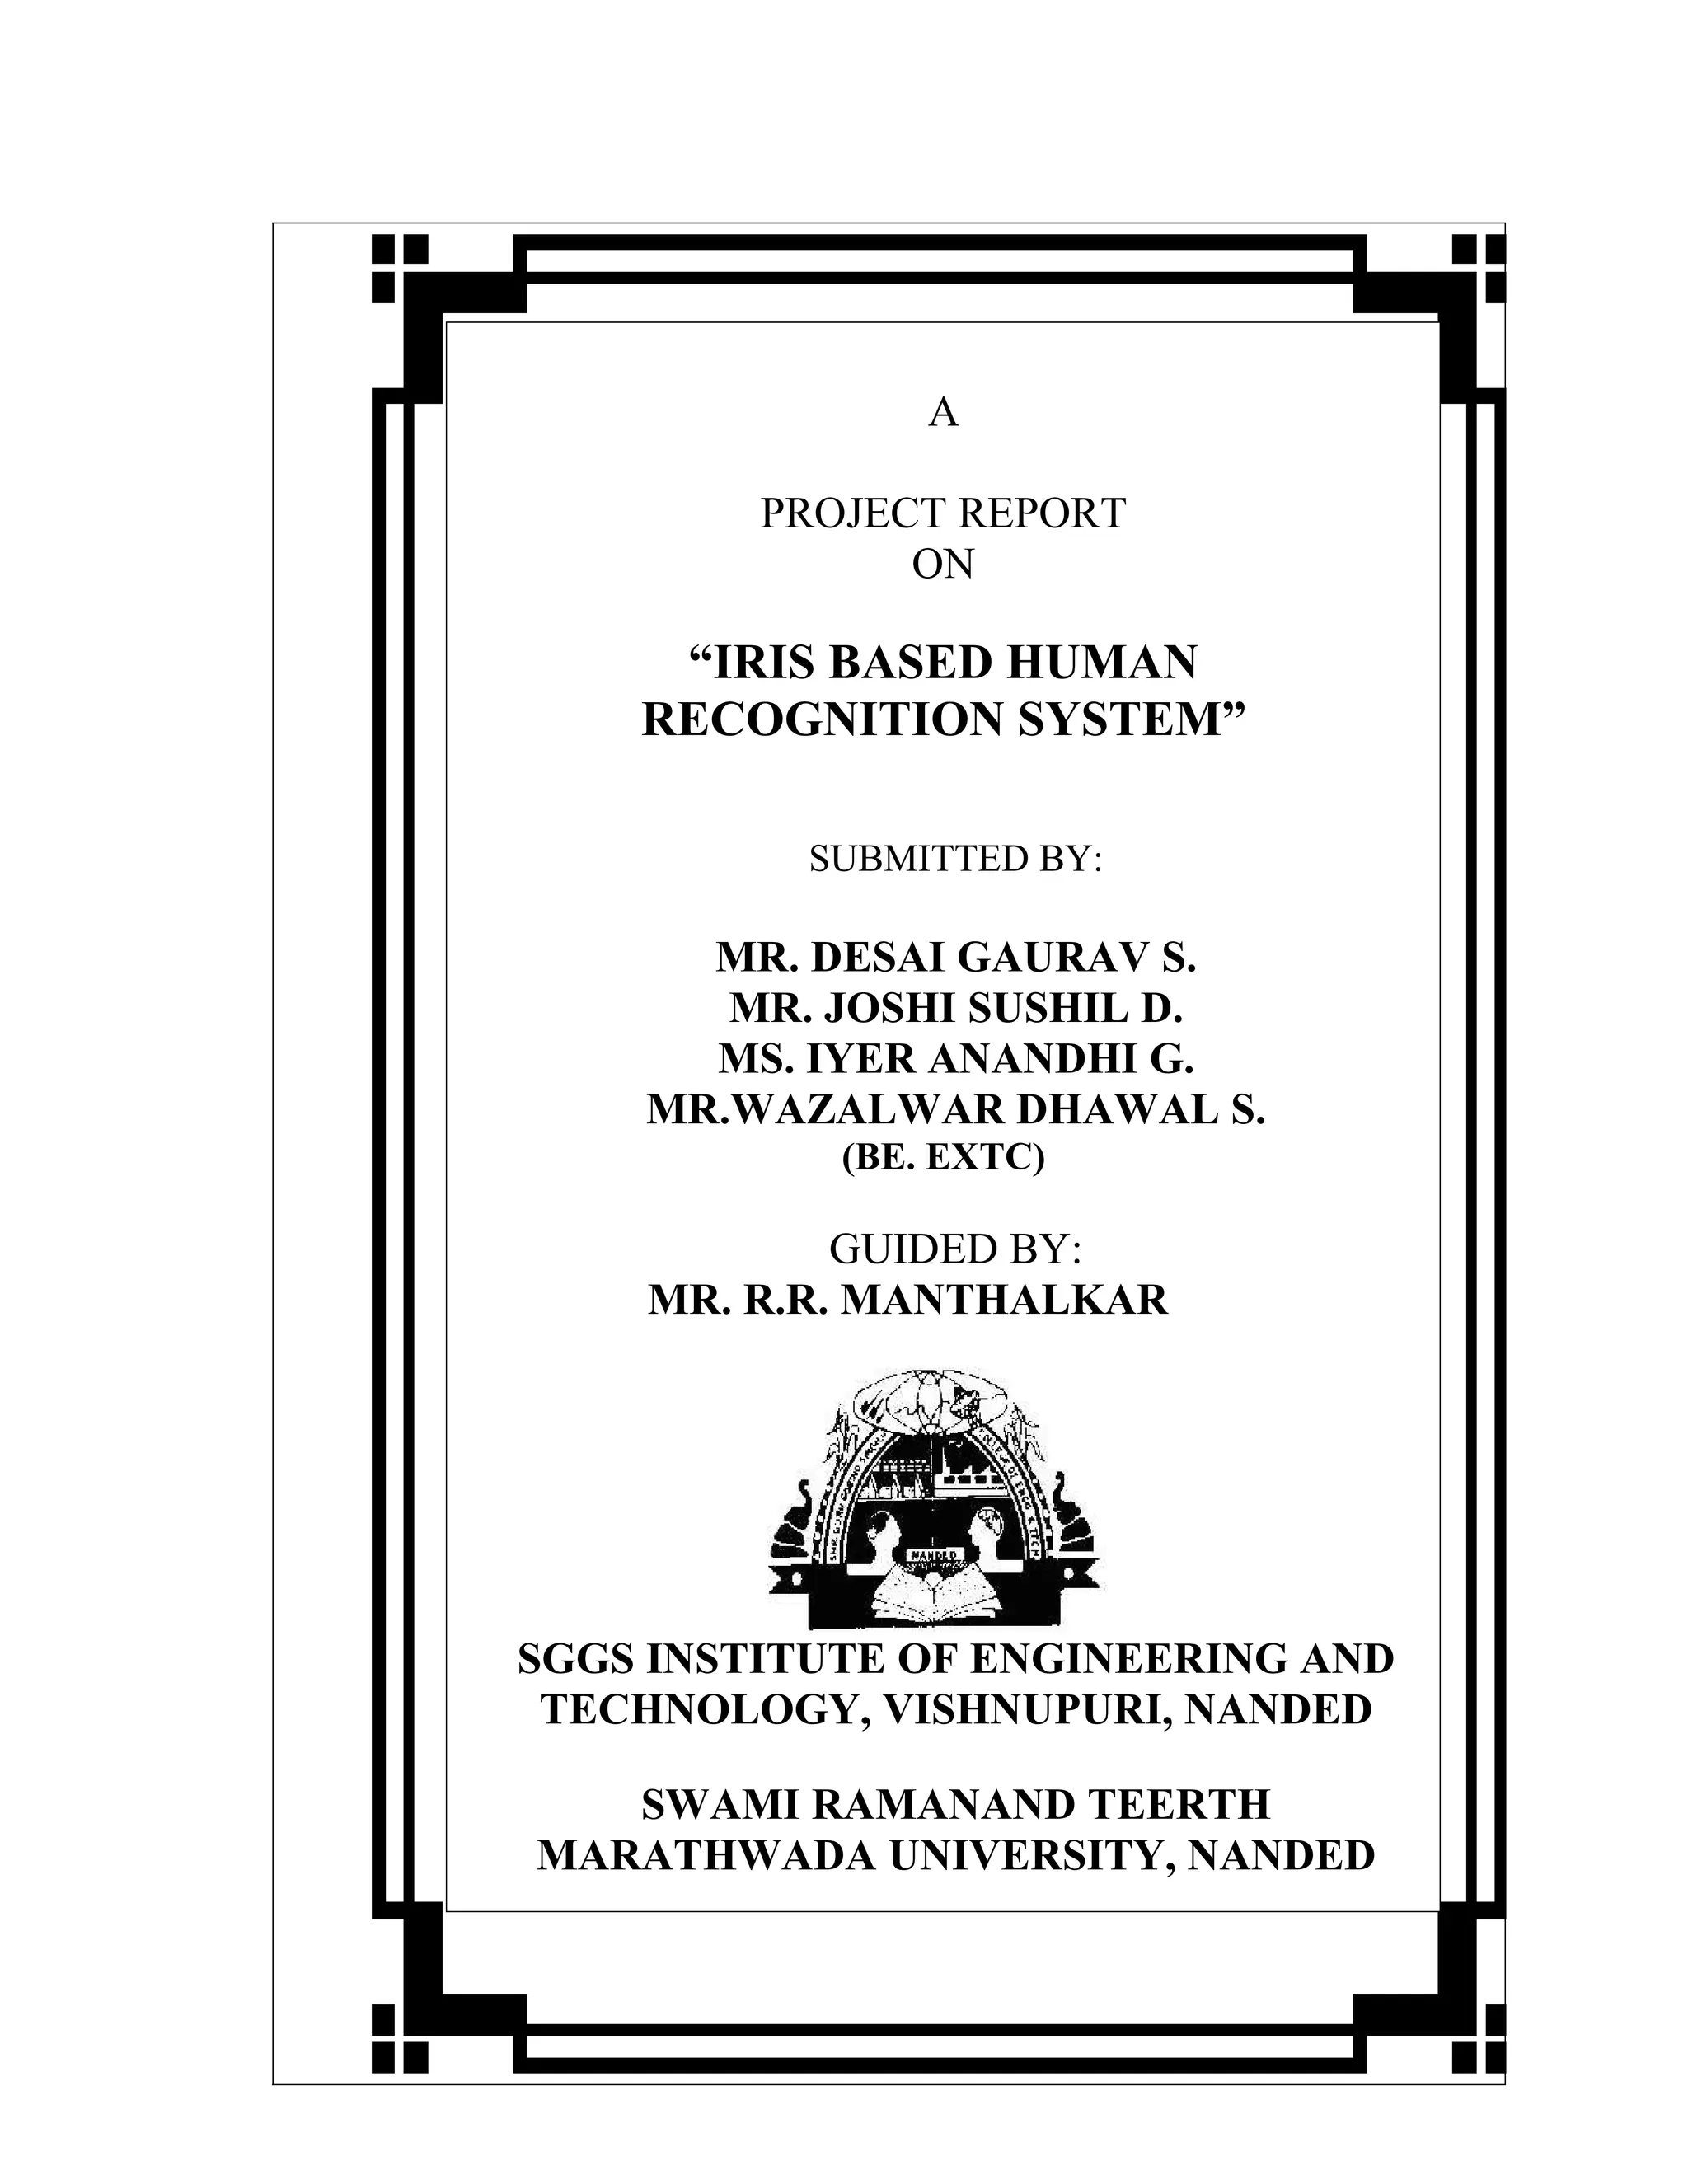
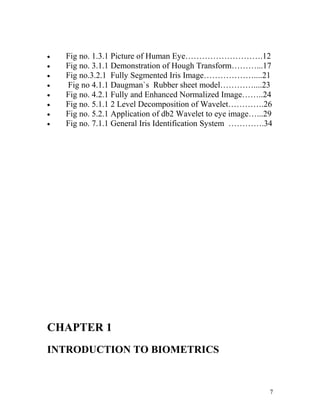
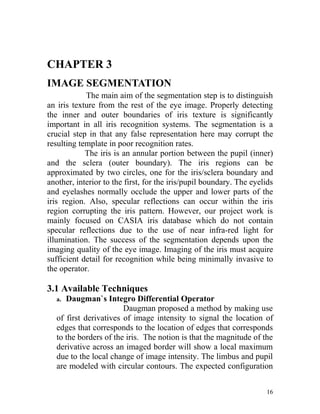
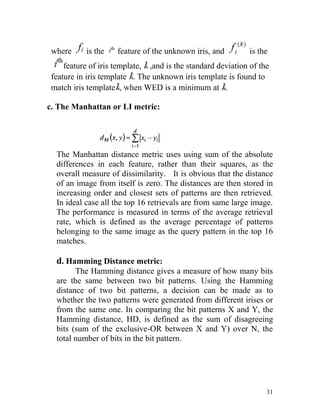
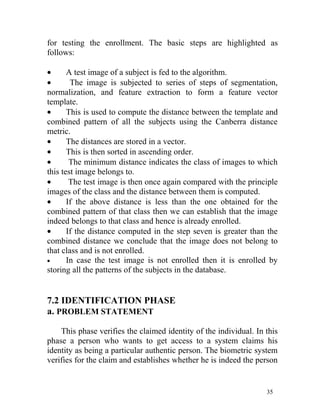
NORMALIZATION
The main aim of normalization is to
transform the iris region into fixed dimensions, in order to null
the effect of dimensional inconsistencies. These inconsistencies
are the result of changes that occur in image distance and
angular position with respect to the camera. Other sources of
inconsistencies include stretching of the iris caused by pupil
dilation from varying levels of illumination, head tilt and
rotation of eye within the eye socket. Normalization is a very
important step in that success of subsequent steps depends
largely on the accuracy of this step.
4.1 BASIC MOTIVATION
Daugman`s Rubber Sheet Model
This method is based on remapping each point within the iris
region to a pair of polar coordinates (r, θ) where r is on the
interval [0 1] and θ is angle in [0 2Π]. The proposed method is
capable of compensating the unwanted variations due to
distance of eye from the camera (scale) and its position with
respect to the camera (Translation). The Cartesian to polar
transform is defined as:
Where,
I(x, y) is the iris region image,(x, y) are the original Cartesian
coordinates ,(r, θ) are the corresponding normalized polar
22](https://image.slidesharecdn.com/projreport-12876178714826-phpapp02/85/Iris-based-Human-Identification-22-320.jpg)
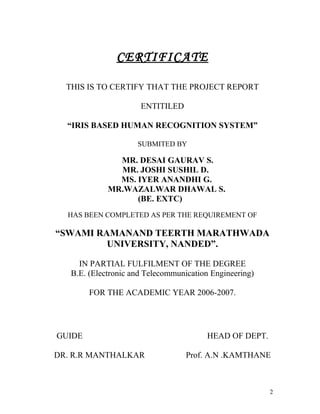
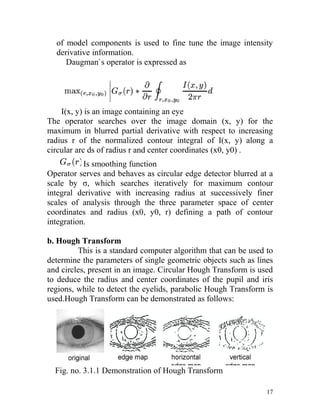
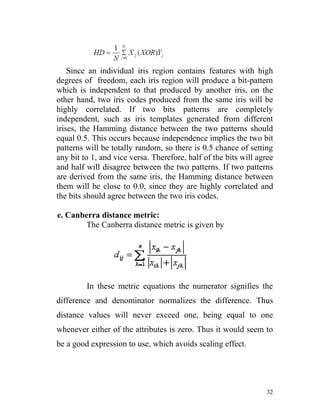
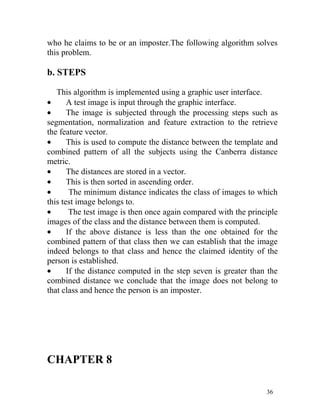
![This works well, if the signal to be analyzed mainly consists of
slowly varying characteristics with occasional short high
frequency bursts.
The function used to window the signal is called the wavelet
ψ ψ 1 ∗ t −τ
CWT x (τ , s ) = Ψ (τ , s ) =
x ∫ x( t )ψ s dt
s t
~
x[n yhigh [k ] = ∑ x[n] g[− n + 2k ] ∑ yhigh [k ] ⋅ g[−n + 2k ] x[n]
k
] n
~
G G +
2 2
~ 2 ~ 2
H G 2 2 G + H
~ 2 2
~
ylow[k ] = ∑ x[n] h[− n + 2k ] H H ∑ yhigh [k ] ⋅ g[−n + 2k ]
n k
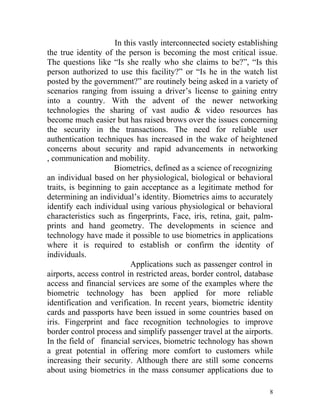
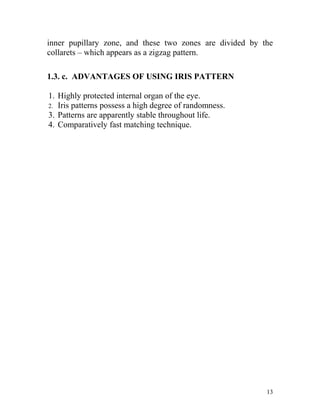
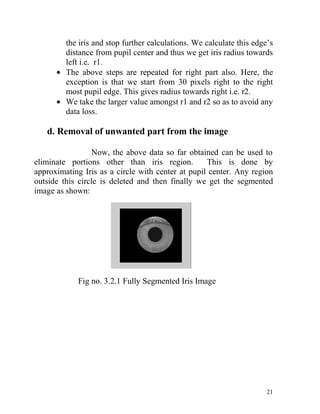
Decomposition Reconstruction
G 2
H 2
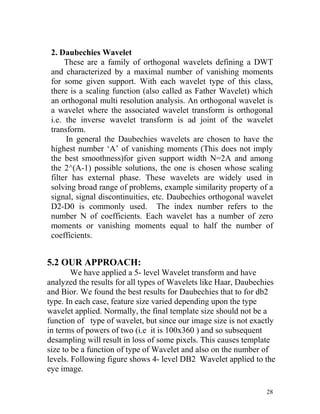
Fig no. 5.1.1 2 Level Decomposition of Wavelet
b. Discrete Wavelet Transform
The DWT analyzes the signal at different frequency bands
with different resolutions by decomposing the signal into coarse
approximation and detail information. DWT employs two sets of
functions, called scaling functions and wavelet functions, which
are associated with low pass and high pass filters, respectively.
The decomposition of signal into different frequency bands is
simply obtained by successive high pass and low pass filtering of
the time domain signal. The original signal x[n] is first passed
through a half band high pass filter g[n] and low pass filter h[n].
After the filtering, half of the samples can be eliminated
26](https://image.slidesharecdn.com/projreport-12876178714826-phpapp02/85/Iris-based-Human-Identification-26-320.jpg)
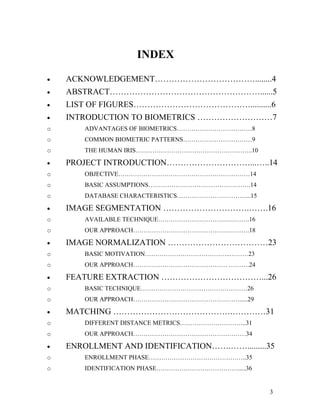
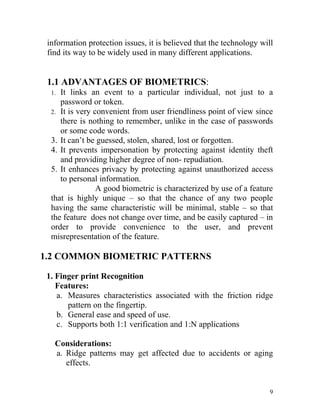
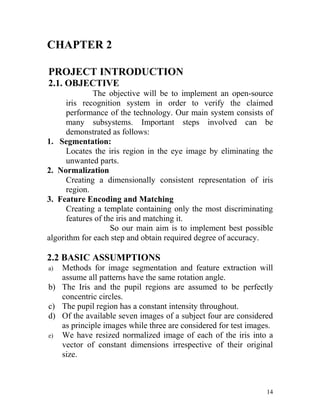
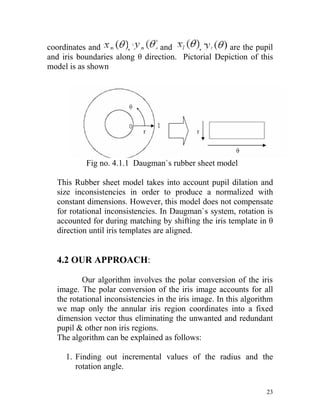
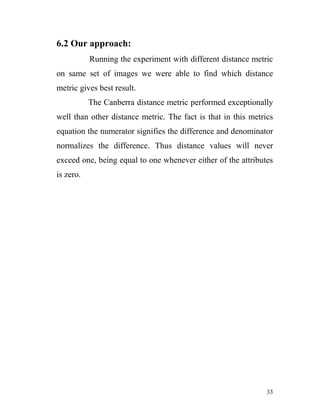
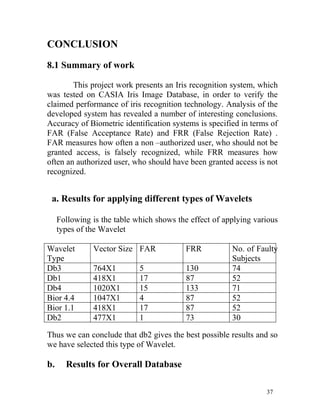
![according to the Nyquist`s rule, since the signal now has a highest
frequency of Π/2 radians instead Π. The signal can therefore be
sub sampled by discarding every other sample. This constitutes
one level of decomposition and can mathematically be expressed
as follows:
Yhigh[k] =Σx[n].g[2k - n]
Ylow[k] =Σx[n].h[2k - n] for all n;
Where Yhigh[k] and Ylow[k] are the outputs of the high pass and
low pass filters, respectively, after sub sampling by 2.
This decomposition halves the time resolution since only half the
number of samples characterizes the entire signal. However, this
operation doubles the frequency resolution since the frequency
band of signal now spans only half the previous frequency band,
effectively reducing the uncertainty in the frequency by half. The
above procedure, which is also known as the sub band coding,
can be repeated for further decomposition. At every level, the
filtering and sub sampling will result in half the number of
samples (and hence half the time resolution) and half the
frequency bands spanned (and hence double the frequency
resolution).
c. VARIOUS TYPES OF WAVELETS
1. Haar Wavelet
This uses the wavelet transform to extract features from the
iris region. Both the Gabor transform and the Haar wavelet are
considered as the mother wavelet. From multi-dimensionally
filtering, a feature vector with 87 dimensions is computed. Since
each dimension has a real value ranging from -1.0 to +1.0, the
feature vector is sign quantized so that any positive value is
represented by 1, and negative value as 0. This results in a
compact biometric template consisting of only 87 bits.
27](https://image.slidesharecdn.com/projreport-12876178714826-phpapp02/85/Iris-based-Human-Identification-27-320.jpg)
![CHAPTER 10
REFERENCES
1. JOURNALS AND CONFERENCE PAPERS
• Daugman, J., How Iris Recognition Works, IEEE
Transactions on Circuits and Systems for Video Technology,
Vol. 14, Number 1, January 2004.
• Masek L., Recognition of Human Iris Patterns for Biometric
Identification,
[http://www.csse.uwa.edu.au/~pk/studentprojects/libor].
• CASIA iris image database, Institute of Automation, Chinese
Academy of Sciences, [http://www.sinobiometrics.com]
• R. Wildes. Iris recognition: an emerging biometric
technology. Proceedings of the IEEE, Vol. 85, No. 9,1997.
• Daugman J., Biometric Personal Identification System based
on Iris Analysis,United States Patent, Patent No. 5,291,560,
March 1994.
• J. Daugman. High confidence visual recognition of persons
by a test of statistical independence. IEEE Transactions on
Pattern Analysis and Machine Intelligence, Vol. 15, No. 11,
1993.
• W.W.Boles, A security system based on human Iris
Identification using Wavelet Transform ,Engineering
Applications of Artificial Intelligence, 11:77-85,1998
2. OTHER REFERENCES
• A book on Digital Image Processing using MATLAB by
Rafael C. Gonzalez, Richard E. Woods and Steven L.Eddins.
• Wavelet tutorial By Robi Polikar.
43](https://image.slidesharecdn.com/projreport-12876178714826-phpapp02/85/Iris-based-Human-Identification-43-320.jpg)