![IPCV 2015
Text Skew Angle Detection in Vision-Based
Scanning of Nutrition Labels
Tanwir Zaman
Department of Computer Science
Utah State University
Logan, UT, USA
tanwir.zaman@aggiemail.usu.edu
Vladimir Kulyukin
Department of Computer Science
Utah State University
Logan, UT, USA
vladimir.kulyukin@usu.edu
Abstract— An algorithm is presented for text skew angle
detection in vision-based scanning of nutrition labels on grocery
packages. The algorithm takes a nutrition label image and
applies several iterations of the 2D Haar Wavelet Transform (2D
HWT) to downsample the image and to compute the horizontal,
vertical, and diagonal change matrices. The values of these
matrices are binarized and combined into a result set of 2D
change points. The convex hull algorithm is applied to this set to
find a minimum area rectangle containing all text pixels. The text
skew angle is computed as the rotation angle of the minimum
area rectangle found by the convex hull algorithm. The
algorithm’s performance is compared with the performance of
the algorithms of Postl and Hull, two text skew angle algorithms
frequently cited in the literature, on a sample of 607 nutrition
label images whose text skew angles were manually computed by
two human evaluators. The median text skew angle error of the
proposed algorithm, Postl’s algorithm, and Hull’s algorithm are
4.62, 68.85, and 20.92, respectively.
Keywords— computer vision; text skew angle detection; OCR;
2D Haar wavelet transform; wavelet analysis
I. Introduction
Vision-based extraction of nutritional information from
nutrition labels (NLs) available on most product packages is
critical to proactive nutrition management, because it
improves the user’s ability to engage in continuous nutritional
data collection and analysis. Many nutrition management
systems underperform, because the target users find it difficult
to integrate nutritional data collection into their daily activities
due to lack of time, motivation, or training, which causes them
to turn off or ignore such digital stimuli as emails, phone calls,
and SMS’s.
To make nutritional data collection more manageable and
enjoyable for the users, we are currently developing a
Persuasive NUTrition Management System (PNUTS) [1].
PNUTS seeks to shift current research and clinical practices in
nutrition management toward persuasion, automated
nutritional information processing, and context-sensitive
nutrition decision support. PNUTS is inspired by the Fogg
Behavior Model (FBM) [2], which states that motivation alone
is insufficient to stimulate target behaviors. Even a motivated
user must have both the ability to execute a behavior and a
well-designed trigger to engage in that behavior at an
appropriate place or time.
In our previous research, we developed a vision-based
localization algorithm for horizontally or vertically aligned
nutrition labels (NLs) on smartphones [3]. Our next NL
processing algorithm [4] improved the algorithm proposed in
[1] in that it handled not only aligned NLs but also NLs
skewed up to 35-40 degrees from the vertical axis of the
captured frame. A limitation of that algorithm was its inability
to handle arbitrary text skew angles.
The algorithm presented in this paper continues our
investigation of vision-based NL scanning. The algorithm’s
objective is to determine the text skew angle of an NL text in
the image without constraining the angle’s magnitude. If the
skew angle is estimated correctly, the image can be rotated
accordingly so that the standard optical character recognition
(OCR) techniques can be used to extract nutrition information.
The algorithm takes an NL image and applies several
iterations of the 2D HWT to downsample the image and to
compute horizontal, vertical, and diagonal change matrices.
The values of these matrices are binarized and combined into
a result set of 2D points. The convex hull algorithm [5] is then
applied to this set in order to find a minimum area rectangle
containing all text pixels. The text skew angle is computed as
the rotation angle of the minimum area rectangle found by the
convex hull algorithm.
Our paper is organized as follows. In Section II, we give
some background information and discuss related work. In
Section III, we present our text skew angle detection algorithm
and explain how it works. In Section IV, we describe the
experiments we designed and conducted to test the algorithm’s
performance on a sample of NL images and to compare it with
the text skew angle detection algorithms of Postl [6] and Hull
[7], two classic algorithms frequently cited in the literature. In
Section V, we analyze and discuss the results of the
experiments. In Section VI, we present our conclusions and
outline several directions for our future work.
II. Background
A. Related Work
A variety of algorithms have been developed to determine the
text skew angle. Such algorithms typically use horizontal or
vertical projection profiles. A horizontal projection profile is a
1D array whose size is equal to the number of rows in the
image. Similarly, a vertical projection profile is a 1D array
whose size is equal to the number of columns in the image.
Each location in a projection profile stores a count of the
number of black pixels associated with text in the](https://image.slidesharecdn.com/ipcv2015ipc2241textskewangledetectionfinaldraft13may2015-150513235451-lva1-app6891/75/Text-Skew-Angle-Detection-in-Vision-Based-Scanning-of-Nutrition-Labels-1-2048.jpg)
![IPCV 2015
corresponding row or column of the image. Projections can be
thought of as 1D histograms. A horizontal projection
histogram is computed by rotating the input image through a
range of angles and calculating black pixels in the appropriate
bins. All projection profiles for all rotation angles are
compared with each other to determine which one maximizes
a given criterion function.
Postl’s algorithm [6] uses the horizontal projection profile
for text skew angle detection. The algorithm calculates the
horizontal projection profiles for angles between 0 and 180
degrees in small increments, e.g., 5 degrees. The algorithm
uses the sum of squared differences between adjacent
elements of the projection profile as the criterion function and
chooses the profile that maximizes that value.
Hull [7] proposes a text skew angle detection algorithm
similar to Postl’s. Hull’s algorithm is more efficient, because it
rotates individual pixels instead of rotating entire images.
Specifically, the coordinates of every black pixel are rotated to
save temporary storage and thereby to reduce the computation
that would be required for a brute force implementation.
Bloomberg et al. [8] also use projection profiles to
determine the text skew angle. Their algorithm differs from
Postl’s and Hull’s algorithms in that the images are
downsampled before the projection profiles are calculated in
order to reduce computational costs. The criterion function
used to estimate the text skew angle is the variance of the
number of black pixels in a scan line.
Kanai et al. [9] present another text skew angle estimation
algorithm based on projection profiles. The algorithm extracts
fiducial points and uses them as points of reference in the
image by decoding the lowest resolution layer of the JBIG
compressed image. The JBIG standard consists of two
techniques, a progressive encoding method and a lossless
compression method for the lowest resolution layer. These
points are projected along parallel lines into an accumulator
array. The text skew angle is computed as the angle of
projection within a search interval that maximizes alignment
of the fiducial points. This algorithm detects a skew angle in
the limited range from ±5 degrees to ±45 degrees.
Papandreou and Gatos [10] use vertical projection profiles
for text skew angle detection. The criterion function is the sum
of squares of the projection profile elements. The researchers
argue that their method is resistant to noise and image warping
and works best for the languages where most of the letters
include at least one vertical line, such as languages with Latin
alphabets.
Li et al. [11] propose a text skew angle detection algorithm
based on wavelet decompositions and projection profile
analysis. Document images are divided into sub-images using
wavelet transform. The matrix containing the absolute values
of the horizontal sub-band coefficients, which preserves the
text’s horizontal structure, is then rotated through a range of
angles. A projection profile is computed at each angle, and the
angle that maximizes a criterion function is regarded as the
skew angle.
Shivakumara et al. [12] propose a document skew angle
estimation approach based on linear regression. They use
linear regression formula in order to estimate a skew angle for
each text line segment of a text document. The part of the text
line is extracted using static and dynamic thresholds from the
projection profiles. This method is based on the assumption
that there is space between text lines. The method loses
accuracy for the documents having skew angle greater than 30
degrees and appears to work best for printed documents with
well-separated lines.
B. 2D Haar Transform
Our implementation of the 2D HWT is based on the approach
taken in [13] where the transition from 1D Haar wavelets to
2D Haar wavelets is based on the products of basic wavelets in
the first dimension with basic wavelets in the second
dimension. For a pair of functions 𝑓1 and 𝑓2 their tensor
product is defined as (𝑓1 × 𝑓2)(𝑥, 𝑦) = 𝑓1(𝑥) ∙ 𝑓2(𝑥). Two 1D
basic wavelet functions are defined as follows:
𝜑[0,1[(𝑟) = {
1 𝑖𝑓 0 ≤ 𝑟 < 1,
0 𝑜𝑡ℎ𝑒𝑟𝑤𝑖𝑠𝑒.
𝜓[0,1[(𝑟) =
{
1 𝑖𝑓 0 ≤ 𝑟 <
1
2
,
−1 𝑖𝑓
1
2
≤ 𝑟 < 1,
0 𝑜𝑡ℎ𝑒𝑟𝑤𝑖𝑠𝑒.
The 2D Haar wavelets are defined as tensor products of
𝜑[0,1[(𝑟) and 𝜓[0,1[(𝑟): 𝛷0,0
(0)
(𝑥, 𝑦) = (𝜑[0,1[ × 𝜑[0,1[)(𝑥, 𝑦),
𝛹0,0
ℎ,(0)
(𝑥, 𝑦) = (𝜑[0,1[ × 𝜓[0,1[)(𝑥, 𝑦), 𝛹0,0
𝑣,(0)
(𝑥, 𝑦) =
(𝜓[0,1[ × 𝜑[0,1[)(𝑥, 𝑦), 𝛹0,0
𝑑,(0)
(𝑥, 𝑦) = (𝜓[0,1[ × 𝜓[0,1[)(𝑥, 𝑦).
The superscripts h, v, and d indicate the correspondence of
these wavelets with horizontal, vertical, and diagonal changes,
respectively. The horizontal wavelets detect horizontal (left to
right) changes in 2D data, the vertical wavelets detect vertical
(top to bottom) changes in 2D data, and the diagonal changes
detect diagonal changes in 2D data.
In practice, the basic 2D HWT is computed by applying a
1D wavelet transform of each row and then a 1D wavelet
transform of each column. Suppose we have a 2 x 2 pixel
image
[
𝑠0,0 𝑠0,1
𝑠1,0 𝑠1,1
] = [
11 9
7 5
].
Applying a 1D wavelet transform to each row results in the
following 2 x 2 matrix:
[
𝑠0,0 + 𝑠0,1
2
𝑠0,0 − 𝑠0,1
2
𝑠1,0 + 𝑠1,1
2
𝑠1,0 − 𝑠1,1
2 ]
=
[
11 + 9
2
11 − 9
2
7 + 5
2
7 − 5
2 ]
= [
10 1
6 1
].
Applying a 1D wavelet transform to each new column is
fetches us the result 2 x 2 matrix:
[
10+6
2
1+1
2
10−6
2
1−1
2
]
= [
8 1
2 0
].](https://image.slidesharecdn.com/ipcv2015ipc2241textskewangledetectionfinaldraft13may2015-150513235451-lva1-app6891/75/Text-Skew-Angle-Detection-in-Vision-Based-Scanning-of-Nutrition-Labels-2-2048.jpg)
![IPCV 2015
The coefficients in the result matrix obtained after the
application of the 1D transform to the columns express the
original data in terms of the four tensor product wavelets
𝛷0,0
(0)
(𝑥, 𝑦), 𝛹0,0
ℎ,(0)
(𝑥, 𝑦), 𝛹0,0
𝑣,(0)
(𝑥, 𝑦), and 𝛹0,0
𝑑,(0)
(𝑥, 𝑦):
[
11 9
7 5
] = 8 ∙ 𝛷0,0
(0)
(𝑥, 𝑦) + 1 ∙ 𝛹0,0
ℎ,(0)
(𝑥, 𝑦) +
2 ∙ 𝛹0,0
𝑣,(0)
(𝑥, 𝑦) + 0 ∙ 𝛹0,0
𝑑,(0)
(𝑥, 𝑦).
The value 8 in the upper-left corner is the average value of
the original matrix: (11+9+7+5)/4= 8. The value 1 in the upper
right-hand corner is the horizontal change in the data from the
left average, (11+7)/2=9, to the right average, (9+5)/2=7,
which is equal 1 ∙ 𝛹0,0
ℎ,(0)
(𝑥, 𝑦) = 1 ∙ −2. The value 2 in the
bottom-left corner is the vertical change in the original data
from the upper average, (11+9)/2=10, to the lower average,
(7+5)/2=6, which is equal to 2 ∙ 𝛹0,0
𝑣,(0)
(𝑥, 𝑦) = 2 ∙ −2=−4.
The value 0 in the bottom-right corner is the change in the
original data from the average along the first diagonal (from
the top left corner to the bottom right corner), (11+5)/2=8, to
the average along the second diagonal (from the top right
corner to the bottom left corner), (9+7)/2=8, which is equal to
0 ∙ 𝛹0,0
𝑑,(0)
(𝑥, 𝑦). The decomposition operation can be
represented in terms of matrices:
[
11 9
7 5
] = 8 ∙ [
1 1
1 1
] + 1 ∙ [
1 − 1
1 − 1
] + 2 ∙ [
1 1
−1 − 1
] +
0 ∙ [
1 − 1
−1 1
].
Figure 1. Horizontal, vertical, and diagonal changes
III. Text Skew Angle Detection
The proposed algorithm receives as input a frame with text or
with a NL. Interested readers may refer to our previous
research [4] on how images with text can be separated from
images without text. In our current implementation, we work
with frames of size 1,024 x 1,024. The 2D HWT is run for
NITER iterations on the image to detect horizontal, vertical,
and diagonal changes and store them in three corresponding n
x n change matrices: HC (horizontal change), VC (vertical
change), and DC (diagonal change), as shown in Figure 1.
In our current implementation, NITER = 2. Each n x n
change matrix (n = 256 in our case, because NITER = 2) is
binarized so that each pixel is set to one of the two values: 𝑣1
and 𝑣2, as shown in Figure 2. In our current implementation,
𝑣1=0 and 𝑣2 = 255. The binarized matrices are combined into
a 256 x 256 result change set of 2D points
𝑆 = {(𝑖, 𝑗)| 𝛼𝐻𝐶[𝑖, 𝑗] + 𝛽𝑉𝐶[𝑖, 𝑗] + 𝛾𝐷𝐶[𝑖, 𝑗] ≥ 𝜃, where
𝛼 + 𝛽 + 𝛾 = 1. In Figure 3 (right), the members of S are
marked as white pixels.
Figure 2. Binarization of HC, VC, and DC matrices
Figure 3. Combining wavelet matrices into result matrix
Once the result change set 𝑆 is obtained, the convex hull
algorithm [5] is used to find a minimum area rectangle
bounding the polygon defined by 𝑆, as shown in Figure 4
(right). The text skew angle is computed as the skew angle of
this rectangle, where the true north is 90 degrees.
We experimentally observed that the DC wavelets tend to
detect the presence of text better than the HC and VC
wavelets. This may be due to the fact that printed text has
more diagonal edges than horizontal or vertical ones as
compared to other objects in the image such as lines or](https://image.slidesharecdn.com/ipcv2015ipc2241textskewangledetectionfinaldraft13may2015-150513235451-lva1-app6891/75/Text-Skew-Angle-Detection-in-Vision-Based-Scanning-of-Nutrition-Labels-3-2048.jpg)
![IPCV 2015
graphics. Consequently, in computing the 2D points of S we
set α=β=0.2 and γ=0.6.
Figure 4. Text skew angle computation
1. FUNCTION DetectTextSkewAngle(Img, N, NITER)
2. [AVRG, HC, VC, DC] = 2DHWT(Img, NITER);
3. Binarize(HC, n); Binarize(VC, n); Binarize(DC, n);
4. FindSkewAngle(HC,VC,DC, (N/2 NITER
));
5. FUNCTION Binarize(Matrix, N, Thresh=5, v1=255, v2=0)
6. For r = 0 to N
7. For c=0 to N
8. If Matrix[r][c] > Thresh Then
9. Matrix[r][c]=v1;
10. Else
11. Matrix[r][c]=v2;
12. End If
13. End For
14. End For
16. FUNCTION FindSkewAngle(HC, VC, DC, n, 𝛼, 𝛽, 𝛾, θ=255)
17. S = {};
18. For r = 1 to n Do
19. For c = 1 to n Do
20. PV = 𝛼 *HC[r][c]+ 𝛽*VC[r][c]+ 𝛾*DC[r][c];
21. If PV ≥ θ Then
22. S = S ∪ (r, c);
23. End If
24. End For
25. End For
26. return TextSkewAngle(FindMinAreaRectangle(S));
Figure 5. Algorithm’s pseudocode
Figure 5 gives the pseudocode of our algorithm. The
algorithm takes as input a 2D image of size N x N. If the size
of the image is not equal to an integral power of 2, as required
by the 2DHWT, the image is padded with 0’s. The third
argument, NITER, specifies the number of iterations for the
2D HWT.
In Line 2, we apply the 2D HWT to the image for NITER,
which, as stated above, in our current implementation is equal
to 2. Our Java source of the 2DHWT procedure is publicly
available at [14]. The 2DHWT returns an array of four n x n
matrices AVRG, HC, VC, and DC. The first matrix contains
the averages while HC, VC, and DC record horizontal, vertical
and diagonal wavelet coefficients.
On line 3, the matrices HC, VC, and DC are binarized in
place. Lines 5-14 give the code for the Binarize procedure.
On line 4, a call to FindSkewAngle is made. As shown in
lines 16-26, FindSkewAngle takes three n x n matrices HC,
VC, and DC and the 𝛼, 𝛽, 𝛾 parameter values used in
computing the 2D points of 𝑆.
On line 17, the set of change points is initialized. On lines
18-20, three corresponding values from HC, VC, and DC are
combined into one PV value (line 20) using the formula
𝛼𝐻𝐶[𝑖, 𝑗] + 𝛽𝑉𝐶[𝑖, 𝑗] + 𝛾𝐷𝐶[𝑖, 𝑗]. If this value clears the
threshold θ that defaults to 255, the 2D point (i, j) is added to
the set of 2D points on line 22.
On line 26, the algorithm first calls the procedure
FindMinAreaRectangle that uses the convex hull algorithm
to find a minimal area rectangle around the set of points found
in lines 18–24 [5] and then calls the procedure
TextSkewAngle that returns the value of the text skew angle
using the true north as 90 degrees.
Figure 6. Ground truth text skew angle estimation
IV. Experiments
The text skew angle detection experiments were conducted on
a set of 607 still images of nutrition labels from common
grocery products. To facilitate data sharing and the replication
of our results, we have made our images publicly available
[15]. The still images used in the experiments were obtained
from the 1280 x 720 videos of common grocery packages with
an average duration of 15 seconds. The videos were recorded
on an Android 4.3 Galaxy Nexus smartphone in Fresh Market,
a supermarket in Logan, UT. All videos were recorded by an
operator who held a grocery product in one hand and a
smartphone in the other. The videos covered four different
categories of products viz. bags, boxes, bottles, and cans. Each
frame was manually classified as sharp only if it was possible
for a person to read the text in the nutrition label.
We implemented our algorithm in Java (JDK 1.7) and
compared the performance of our algorithm with the
algorithms of Postl [5] and Hull [6], frequently cited in the
literature on text skew angle detection. Since we were not able
to find publicly available source code of either algorithm, we
also implemented both in Java (JDK 1.7) to make the
comparison more objective. In the tables below, we use the
terms Algo 1, Algo 2, and Algo 3 to refer to our algorithm,
Postl’s algorithm, and Hull’s algorithm, respectively.
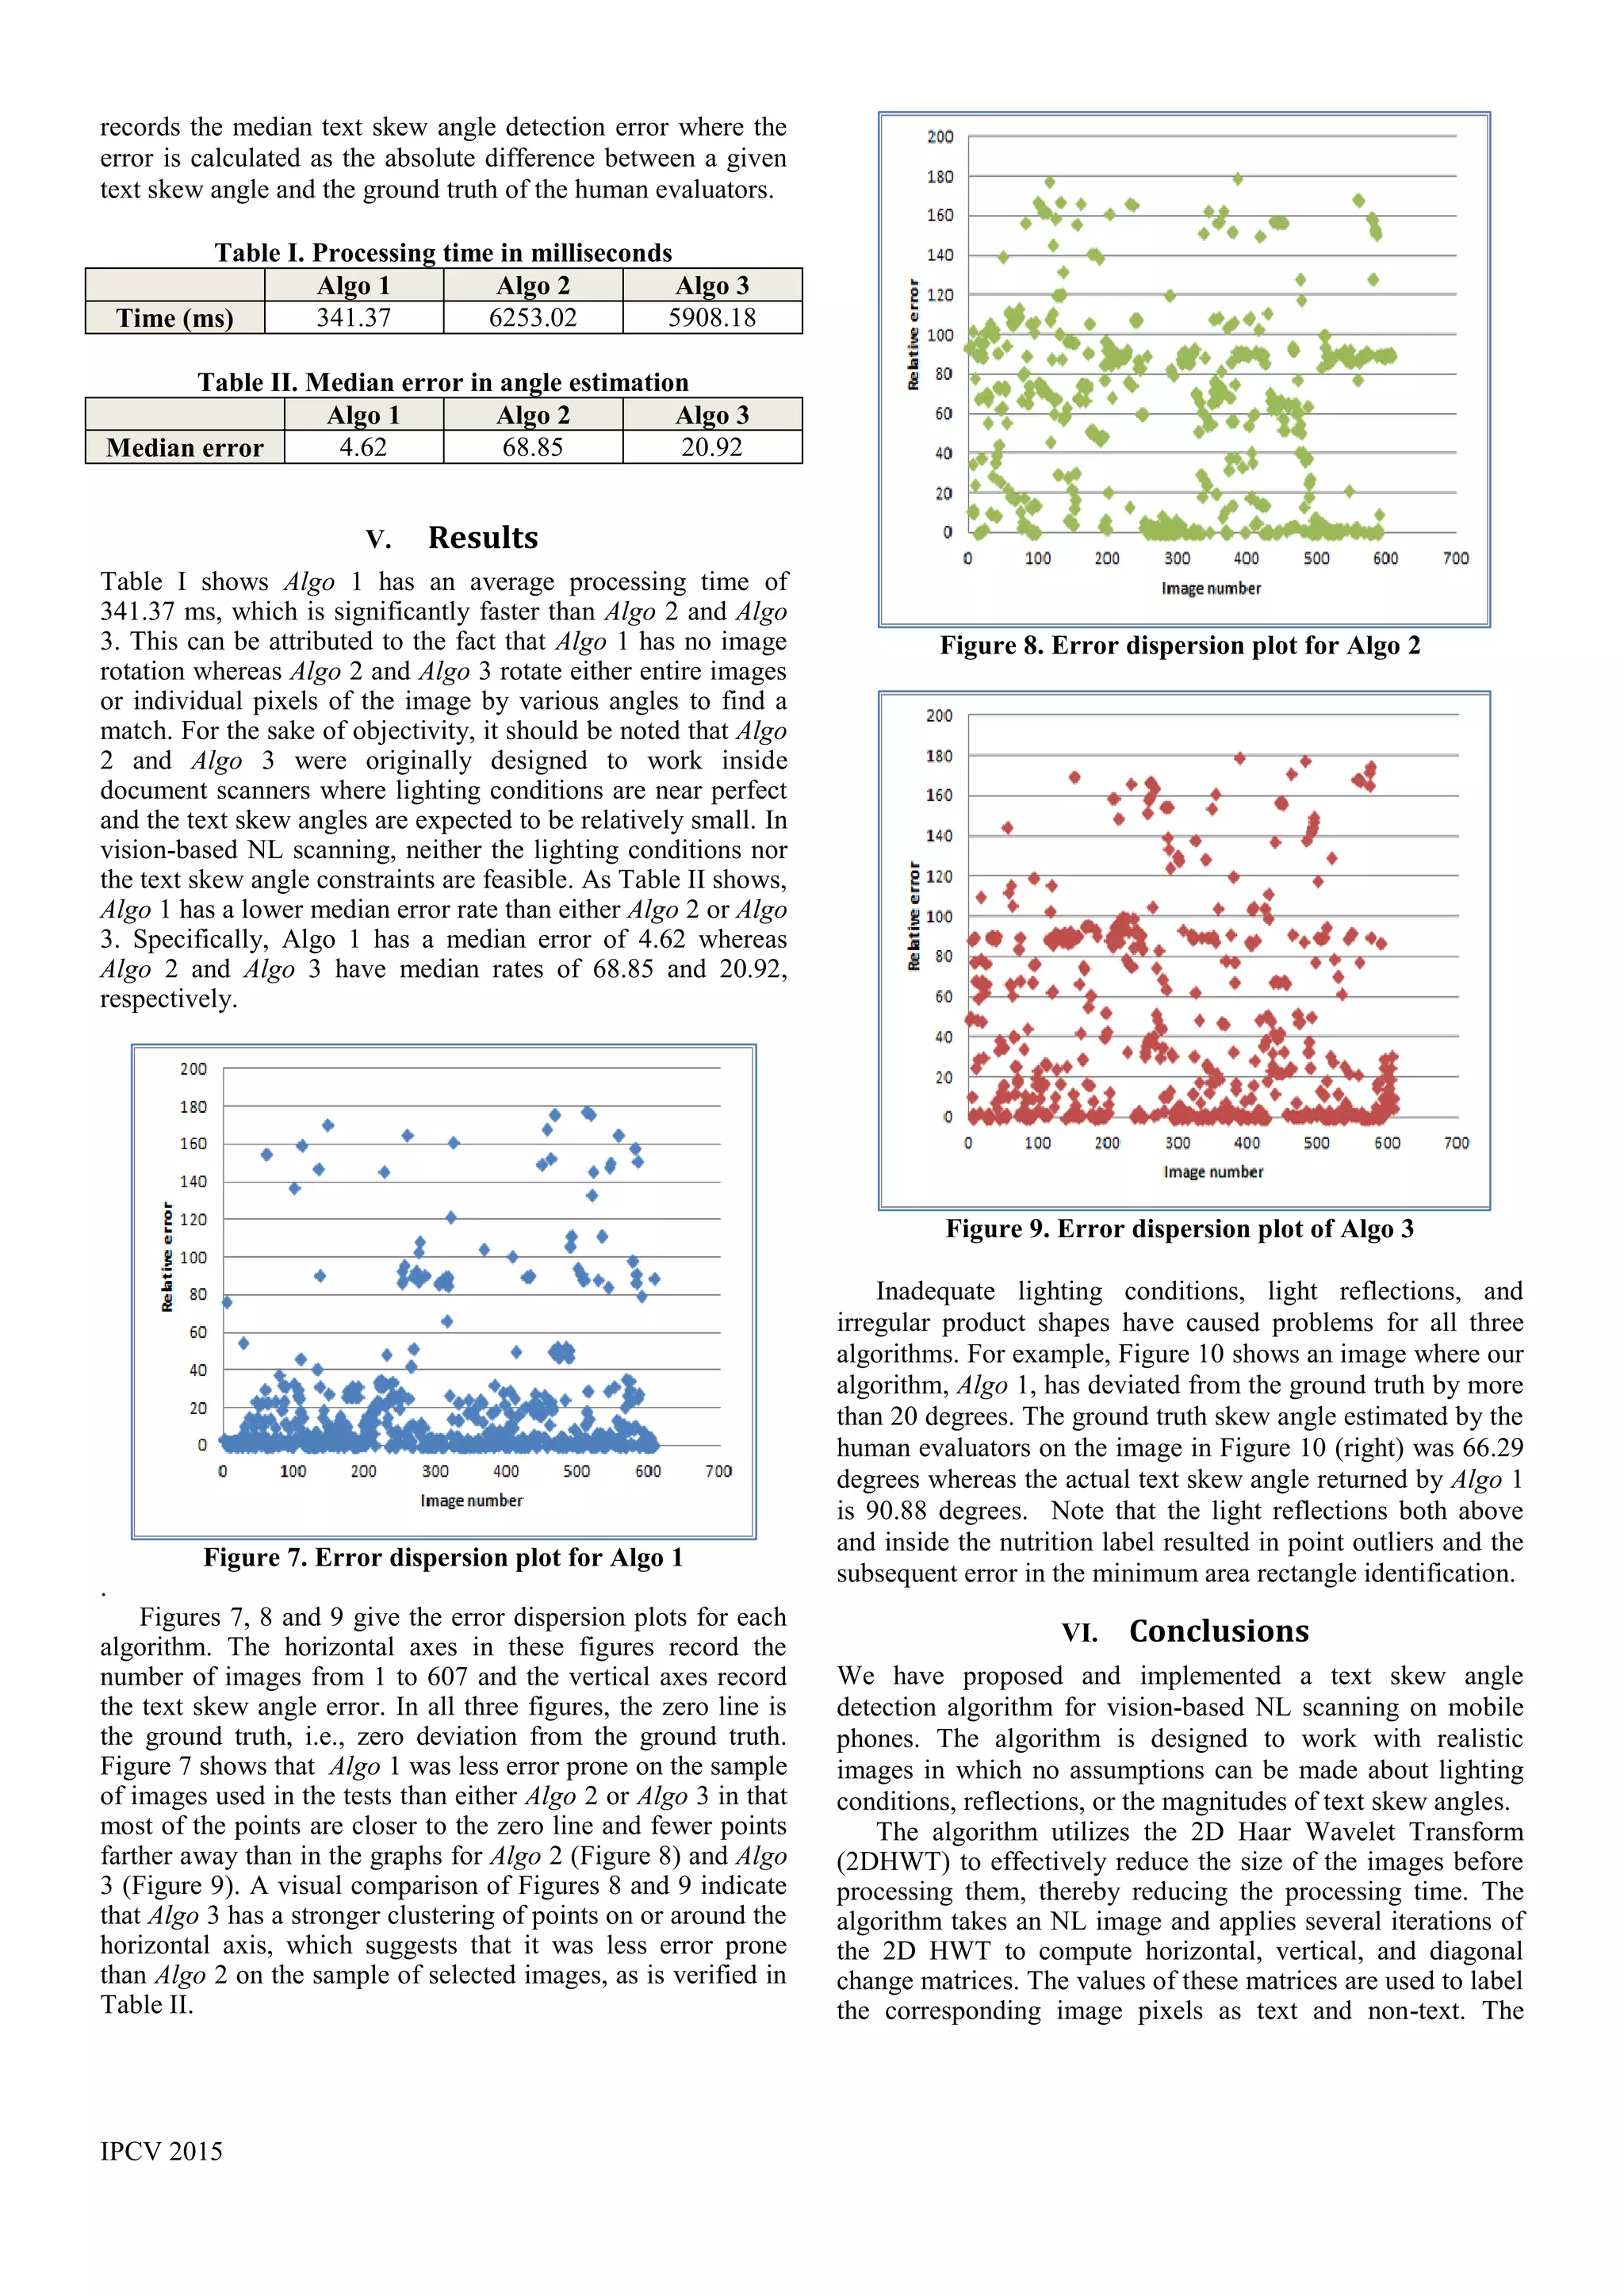
We ran three algorithms on all 607 images and logged the
processing time for each image. The ground truth for the text
skew angle was obtained from two human volunteers who
used an open source protractor program [16] to manually
estimate the text skew angle, as shown in Figure 6. Table I
records the average processing time in milliseconds. Table II](https://image.slidesharecdn.com/ipcv2015ipc2241textskewangledetectionfinaldraft13may2015-150513235451-lva1-app6891/75/Text-Skew-Angle-Detection-in-Vision-Based-Scanning-of-Nutrition-Labels-4-2048.jpg)
![IPCV 2015
convex hull algorithm is used to find a minimum area
rectangle containing all text pixels [5]. The text skew angle is
computed as the rotation angle of the minimum area rectangle
found by the convex hull algorithm.
Figure 10. Text skew angle detection error
As a result of our experiments, we observed that the
diagonal change matrix with the 2D diagonal wavelets tends to
be more effective in text localization. We plan to conduct
more experiments to verify this tendency of the 2D HWT in
the future. A comparative study of our algorithm with the
algorithms of Postl [6] and Hull [7], two text skew angle
algorithms frequently cited in the literature, showed our
algorithms to be faster and less error prone in vision-based
scanning of NLs. This conclusion should be interpreted with
caution because this comparative study reported in this paper
was executed on a sample of 607 images. We plan to do
further experiments on larger and more diverse image
samples. We, by no means, rule out that in different domains
with better lightning conditions or stricter constraints on text
skew angle magnitudes our algorithm may not perform as
well. We are reasonably certain, however, that our algorithm
is faster than the algorithms by Postl [6] and Hull [7] because
it does not rotate either images or individual pixels.
Another conclusion is that the classic text skew angle
detection algorithms designed for document scanners do not
work well in real world domains such as vision-based nutrition
label scanning when no even illumination of documents can be
assured. Such algorithms also implicitly assume that the
documents have mostly printed text with little graphics.
Another limitation of these algorithms is the fact that they
utilize image rotation techniques to calculate either horizontal
or vertical projection profiles to determine the text skew angle,
which may not be suitable for real time video processing. and
would be very inefficient if implemented to work on a mobile
platform.
Our future work will focus on the integration of blur
detection into vision-based NL scanning so that blurred
images are automatically filtered out from the processing
stream. Another future research objective is to couple the
output of our algorithm with OCR engines to extract text from
localized NLs. In our previous work, a greedy spellchecking
algorithm was developed to correct OCR errors in vision-
based NL scanning [17]. However, improving text skew angle
detection may eliminate the need for spellchecking altogether
without lowering the OCR rates.
References
[1] Kulyukin, V., Kutiyanawala, A., Zaman, T, & Clyde, S.
“Vision-based localization & text chunking of nutrition
fact tables on android smartphones.” In Proc. of the
International Conference on Image Processing, Computer
Vision, & Pattern Recognition (IPCV 2013), pp. 314-320,
ISBN 1-60132-252-6, CSREA Press, Las Vegas, NV,
USA.
[2] Fog B.J. "A behavior model for persuasive design," In
Proc. 4th International Conference on Persuasive
Technology, Article 40, ACM, New York, USA, 2009.
[3] Kulyukin, V. and Zaman, T. “An Algorithm for in-place
vision-based skewed 1D barcode scanning in the cloud.”
In Proc. of the 18th International Conference on Image
Processing and Pattern Recognition (IPCV 2014), pp. 36-
42, July 21-24, Las Vegas, NV, USA, CSREA Press,
ISBN: 1-60132-280-1.
[4] Kulyukin, V. and Blay, C. “An algoritm for mobile
vision-based localization of skewed nutrition labels that
maximizes specificity.” In Proc. of the 18th International
Conference on Image Processing and Pattern Recognition
(IPCV 2014), pp. 3-9, July 21-24, 2014, Las Vegas, NV,
USA, CSREA Press, ISBN: 1-60132-280-1.
[5] Freeman, H. and Shapira, R. "Determining the minimum-
area encasing rectangle for an arbitrary closed curve."
Comm. ACM, 1975, pp.409-413.
[6] Postl, W. "Detection of linear oblique structures and skew
scan in digitized documents." In Proc. of International
Conference on Pattern Recognition, pp. 687-689, 1986.
[7] Hull, J.J. "Document image skew detection: survey and
annotated bibliography," In J.J. Hull, S.L. Taylor (eds.),
Document Analysis Systems II, World Scientific
Publishing Co., 1997, pp. 40-64.
[8] Bloomberg, D. S., Kopec, G. E., and Dasari, L.
“Measuring document image skew and orientation,”
Document Recognition II (SPIE vol. 2422), San Jose,
CA, February 6-7, 1995, pp. 302-316.
[9] Kanai, J. and Bagdanov, A.D., "Projection profile based
skew estimation algorithm for JBIG compressed images",
International Journal on Document Analysis and
Recognition, vol. 1, issue 1, 1998, pp.43-51.
[10] Papandreou, A. and Gatos, B. “A novel skew detection
technique based on vertical projections.” In Proc. of
International Conference on Document Analysis and
Recognition (ICDAR), pp. 384-388, Sept. 18-21, 2011,
Beijing, China.
[11] Li, S.T., Shen, Q.H., and Sun, J. "Skew detection using
wavelet decomposition and projection profile analysis."
Pattern Recognition Letters, vol. 28, issue 5, 2007, pp.
555–562.
[12] Shivakumara, P., Hemantha Kumar, G. ., Guru, D. S., and
Nagabhushan, P. "Skew estimation of binary document
images using static and dynamic thresholds useful for
document image mosaicing." In Proc. of National
Workshop on IT Services and Applications (WITSA
2003), pp.51-55, , Feb 27–28, New Delhi, India, 2003,
[13] Nievergelt, Y. Wavelets Made Easy. Birkäuser,
Boston, 2000, ISBN-10: 0817640614.
[14] Java implementation of the 2DHWT procedure.
https://github.com/VKEDCO/java/tree/master/haar.
[15] Online database for sharp NL images.
https://usu.box.com/s/9zk660t5h1g0dmw4pjj1x1yp6r7zov
p3.
[16] Open source onscreen protractor program.
http://sourceforge.net/projects/osprotractor/
[17] Kulyukin, V., Vanka, A., and Wang, W. “Skip trie
matching: a greedy algorithm for real-time OCR error
correction on smartphones.” International Journal of
Digital Information and Wireless Communication
(IJDIWC): vol. 3, issue 3, pp. 56-65, 2013. ISSN: 2225-
658X.](https://image.slidesharecdn.com/ipcv2015ipc2241textskewangledetectionfinaldraft13may2015-150513235451-lva1-app6891/75/Text-Skew-Angle-Detection-in-Vision-Based-Scanning-of-Nutrition-Labels-6-2048.jpg)

This document presents an algorithm for detecting the text skew angle in images of nutrition labels. The algorithm applies multiple iterations of the 2D Haar Wavelet Transform to downsample the image and compute horizontal, vertical, and diagonal change matrices. It then binarizes and combines these matrices into a set of 2D change points. Finally, it uses a convex hull algorithm to find the minimum area rectangle containing all text pixels, and calculates the text skew angle as the rotation angle of this rectangle. The algorithm's performance is compared to two other text skew detection algorithms on a sample of over 600 nutrition label images, finding a median error of 4.62 degrees compared to 68.85 and 20.92 degrees for the other algorithms.