Download to read offline


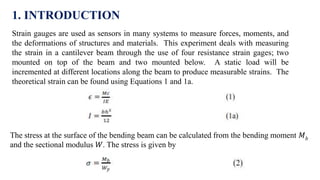
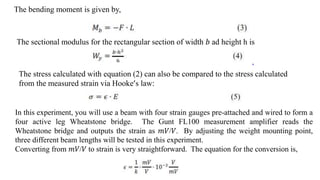
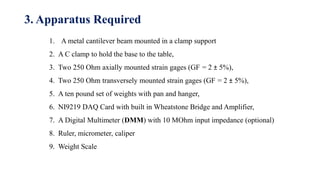
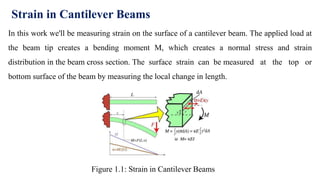
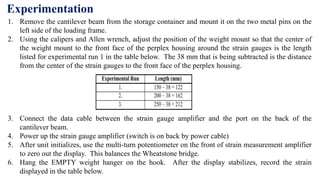
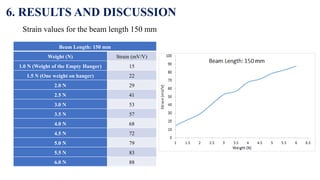
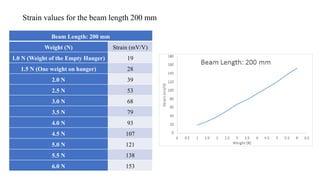
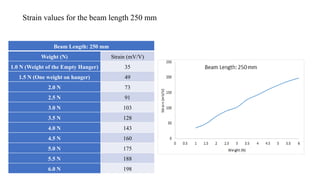
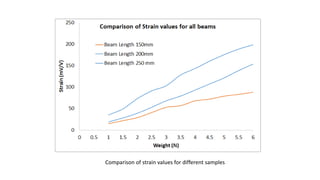
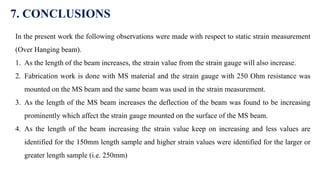


This document outlines an experiment to measure strain on a cantilever beam using resistance strain gauges. It includes an introduction explaining strain measurement using strain gauges, objectives of learning how to use strain indicators and apply uncertainty analysis. The methodology section details the equipment used including a cantilever beam, strain gauges, weights and amplifier. The experimentation section provides steps to mount the beam, zero the amplifier, record strain measurements at different beam lengths and weight amounts. The results section shows tables of strain values measured. Finally, the conclusions note that strain increased with increasing beam length and load amount as expected.


