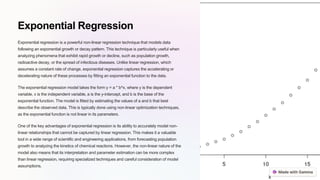
Introduction to Non-
Linear Regression
Non-linear regression is a powerful statistical technique used to model complex
relationships between variables that cannot be adequately described by a
straight line or linear equation. Unlike linear regression, which assumes a linear
relationship between the predictor and response variables, non-linear
regression allows for more flexibility, enabling the capture of intricate patterns
and the representation of a wide range of functional forms.
This introductory section will provide an overview of the key concepts and
applications of non-linear regression, highlighting its advantages over traditional
linear models and its ability to uncover hidden insights within complex data. By
understanding the fundamentals of non-linear regression, you will be better
equipped to tackle real-world problems that require more sophisticated
modeling approaches.
Sa by Shriram Kargaonkar
Limitations of Linear Regression
Linearity Assumption
Linear regression models assume that the
relationship between the input variables and
the output variable is linear. However, in the
real world, many relationships are inherently
non-linear, such as exponential growth,
logarithmic decay, or periodic oscillations.
When the true relationship is non-linear,
using a linear model can lead to biased and
inaccurate predictions.
Multicollinearity
Linear regression models assume that the
input variables are independent of each
other. However, in practice, input variables
are often correlated, a condition known as
multicollinearity. Multicollinearity can lead to
unstable and unreliable coefficient
estimates, making it difficult to interpret the
individual effects of the input variables on
the output.
Non-Normal Residuals
Linear regression models assume that the
residuals (the difference between the actual
and predicted values) follow a normal
distribution. However, in many real-world
scenarios, the residuals may exhibit non-
normal distributions, such as skewness,
kurtosis, or heteroscedasticity. Violations of
this assumption can lead to biased standard
errors, confidence intervals, and hypothesis
tests.
Limited Flexibility
Linear regression models have a limited
ability to capture complex, non-linear
relationships between the input and output
variables. They are constrained by the
linear function form, which may not be able
to adequately represent the underlying data-
generating process. This limitation can lead
to poor model fit and reduced predictive
accuracy, especially when dealing with
complex, non-linear phenomena.
Polynomial Regression
Polynomial regression is a powerful non-linear regression technique that can capture more complex
relationships between the independent and dependent variables. Unlike linear regression, which fits a
straight line to the data, polynomial regression uses a higher-order polynomial function to model the
non-linear patterns in the data. This allows the model to fit more complex, curved relationships, making
it a versatile tool for a wide range of applications. The key advantage of polynomial regression is its
ability to capture non-linear trends in the data, such as exponential growth, parabolic shapes, or more
complex functional forms. This is particularly useful when the relationship between the variables is not
linear, as is often the case in real-world scenarios. By fitting a polynomial curve to the data, the model
can better capture the underlying structure and make more accurate predictions.
Another benefit of polynomial regression is its flexibility. The degree of the polynomial can be adjusted
to fit the complexity of the data, from a simple quadratic function to higher-order polynomials. This
allows the model to adapt to the specific characteristics of the dataset and find the optimal balance
between model complexity and goodness of fit. However, polynomial regression also comes with
some challenges. As the degree of the polynomial increases, the model becomes more susceptible to
overfitting, where it fits the noise in the data rather than the underlying pattern. This can lead to poor
generalization performance on new, unseen data. Careful model selection and regularization
techniques are often necessary to prevent overfitting and ensure the model's robustness.
Logistic Regression
1 Binary Classification
Logistic regression is a powerful technique for modeling binary outcomes, where the
dependent variable can take on only two possible values, such as "yes/no",
"pass/fail", or "healthy/sick". Unlike linear regression, which is used for continuous
dependent variables, logistic regression uses a sigmoid function to transform the
output into a probability between 0 and 1, allowing for accurate classification of data
points into one of the two categories.
2 Probability Estimation
The logistic regression model estimates the probability of the dependent variable
being in one of the two classes, given the values of the independent variables. This
probability is calculated using a logistic function, which maps the linear combination of
the independent variables to a value between 0 and 1, representing the probability of
the outcome. This approach allows for the interpretation of the model's results in
terms of the likelihood of a particular outcome occurring.
3 Non-Linear Relationships
Logistic regression is particularly useful when dealing with non-linear relationships
between the independent and dependent variables. Unlike linear regression, which
assumes a linear relationship, logistic regression can model more complex, non-linear
patterns in the data. This makes it a valuable tool for a wide range of applications,
from medical diagnosis to customer churn prediction, where the underlying
relationships may not be linear.
Exponential Regression
Exponential regression is a powerful non-linear regression technique that models data
following an exponential growth or decay pattern. This technique is particularly useful when
analyzing phenomena that exhibit rapid growth or decline, such as population growth,
radioactive decay, or the spread of infectious diseases. Unlike linear regression, which
assumes a constant rate of change, exponential regression captures the accelerating or
decelerating nature of these processes by fitting an exponential function to the data.
The exponential regression model takes the form y = a * b^x, where y is the dependent
variable, x is the independent variable, a is the y-intercept, and b is the base of the
exponential function. The model is fitted by estimating the values of a and b that best
describe the observed data. This is typically done using non-linear optimization techniques,
as the exponential function is not linear in its parameters.
One of the key advantages of exponential regression is its ability to accurately model non-
linear relationships that cannot be captured by linear regression. This makes it a valuable
tool in a wide range of scientific and engineering applications, from forecasting population
growth to analyzing the kinetics of chemical reactions. However, the non-linear nature of the
model also means that its interpretation and parameter estimation can be more complex
than linear regression, requiring specialized techniques and careful consideration of model
assumptions.
Gaussian Processes
Gaussian Processes are a powerful non-linear
regression technique that models the
relationship between input variables and the
target variable as a probability distribution
rather than a deterministic function. This
approach allows for the quantification of
uncertainty in the predictions, making
Gaussian Processes particularly useful for
applications where accurate uncertainty
estimates are crucial, such as in scientific
research, engineering, and finance.
In Gaussian Process regression, the function
mapping the input variables to the target
variable is assumed to be drawn from a
Gaussian distribution. This distribution is
characterized by a mean function and a
covariance function, which together define the
shape and properties of the underlying
function. The covariance function, also known
as the kernel, encodes the assumptions about
the smoothness and correlation structure of
the function, allowing Gaussian Processes to
capture complex non-linear relationships.
One of the key advantages of Gaussian
Processes is their flexibility in modeling a wide
range of non-linear functions, from simple
polynomials to highly complex, multi-modal
relationships. They can also handle noisy and
sparse data, making them a robust choice for
Kernel Regression
Function
Approximation
Kernel regression is
a non-parametric
technique used for
function
approximation.
Unlike linear
regression which fits
a straight line to the
data, kernel
regression can
model complex,
non-linear
relationships
between the input
variables and the
target variable. It
does this by using a
weighted average of
the nearby data
points to make
predictions, where
the weights are
determined by a
Flexible Modeling
One of the key
advantages of
kernel regression is
its flexibility.
Because it doesn't
assume a specific
functional form, it
can adapt to a wide
range of data
patterns. This
makes it particularly
useful for problems
where the
underlying
relationship is
unknown or difficult
to model
parametrically.
Kernel regression
can capture
complex, nonlinear
trends in the data
without the need to
specify a particular
Hyperparamete
r Tuning
To achieve optimal
performance, kernel
regression requires
careful selection of
the kernel function
and its associated
hyperparameters.
The kernel function
determines the
shape of the
weighting function
used to combine
nearby data points.
Common kernel
functions include the
Gaussian,
Epanechnikov, and
Tricube kernels. The
bandwidth
hyperparameter
controls the size of
the "neighborhood"
around each data
Applications
Kernel regression
has a wide range of
applications in fields
like machine
learning, data
analysis, and
scientific modeling. It
can be used for
tasks such as
regression,
classification, time
series forecasting,
and density
estimation. Some
common application
areas include image
processing, signal
processing,
bioinformatics, and
finance. Kernel
regression's
flexibility and ability
to capture complex
nonlinearities make
Neural Networks for Non-Linear
Regression
Neural networks have emerged as a powerful tool for tackling non-linear regression problems. Unlike
traditional linear regression models, neural networks can capture complex, non-linear relationships
between the input variables and the target variable. This makes them well-suited for modeling a wide
range of real-world phenomena that exhibit non-linear patterns, such as stock market prices, weather
patterns, or the relationship between a person's age and their income.
At the heart of a neural network for non-linear regression is a series of interconnected layers, each
containing numerous neurons that learn to recognize patterns in the data. These layers transform the
input features through a series of non-linear activations, allowing the network to model highly complex
functions. By adjusting the weights and biases of the connections between neurons, the neural network
can be trained to minimize the error between its predictions and the observed data, effectively learning
the underlying non-linear relationships.
One of the key advantages of neural networks for non-linear regression is their ability to handle high-
dimensional, noisy, and incomplete data. They can automatically learn relevant features and patterns
from the input, without the need for extensive feature engineering. Additionally, modern neural network
architectures, such as deep feedforward networks, recurrent neural networks, and convolutional neural
networks, have proven to be highly effective in capturing even the most intricate non-linear
relationships in a wide range of application domains.
While neural networks for non-linear regression offer powerful capabilities, they also come with their
own challenges. Proper model selection, hyperparameter tuning, and training techniques are crucial to
ensuring the network learns the right representations and generalizes well to new, unseen data.
Additionally, the interpretability of neural networks can be more complex compared to traditional
regression models, making it important to carefully analyze the learned patterns and their implications.
Advantages and Disadvantages of
Non-Linear Regression
1
Flexibility
Non-linear models can capture complex, non-linear
relationships between variables.
2
Improved Accuracy
Non-linear models can often fit data better than linear
models, leading to more accurate predictions.
3
Representation of Real-World
Phenomena
Many real-world processes exhibit non-linear
behavior, which non-linear models are better
equipped to capture.
Non-linear regression offers several key advantages over traditional linear regression. Firstly, it
provides greater flexibility in modeling complex, non-linear relationships between variables. This
allows non-linear models to capture nuances and patterns that linear models may miss, leading to
improved accuracy in predictions and a better representation of real-world phenomena.
Applications and Case Studies
Medical Research
Non-linear
regression models
are widely used in
medical research to
analyze complex
relationships
between variables.
For example,
researchers may
use logistic
regression to predict
the likelihood of a
patient developing a
certain disease
based on multiple
risk factors.
Exponential
regression can be
applied to model the
growth of tumors
over time, while
Business
Forecasting
In the business
world, non-linear
regression
techniques are
invaluable for
forecasting sales,
predicting market
trends, and
optimizing pricing
strategies.
Companies may use
polynomial
regression to model
the relationship
between advertising
spend and revenue,
or neural networks
to forecast stock
prices based on a
variety of economic
Scientific Research
Beyond medical and
business
applications, non-
linear regression is a
crucial tool in
scientific research
across disciplines.
Ecologists may use
logistic regression to
model the
population dynamics
of endangered
species, while
physicists employ
Gaussian processes
to interpolate
experimental data
and make
predictions about
particle interactions.
The flexibility and
Urban Planning
In the realm of urban
planning and
development, non-
linear regression
techniques are
invaluable for
modeling the
complex,
interconnected
systems that shape
our cities. Planners
may use polynomial
regression to predict
the impact of new
infrastructure on
traffic patterns, or
logistic regression to
forecast the growth
of residential and
commercial areas.
By accounting for

Introduction-to-Non-Linear-Regression.pptx

  • 1.
    Introduction to Non- LinearRegression Non-linear regression is a powerful statistical technique used to model complex relationships between variables that cannot be adequately described by a straight line or linear equation. Unlike linear regression, which assumes a linear relationship between the predictor and response variables, non-linear regression allows for more flexibility, enabling the capture of intricate patterns and the representation of a wide range of functional forms. This introductory section will provide an overview of the key concepts and applications of non-linear regression, highlighting its advantages over traditional linear models and its ability to uncover hidden insights within complex data. By understanding the fundamentals of non-linear regression, you will be better equipped to tackle real-world problems that require more sophisticated modeling approaches. Sa by Shriram Kargaonkar
  • 2.
    Limitations of LinearRegression Linearity Assumption Linear regression models assume that the relationship between the input variables and the output variable is linear. However, in the real world, many relationships are inherently non-linear, such as exponential growth, logarithmic decay, or periodic oscillations. When the true relationship is non-linear, using a linear model can lead to biased and inaccurate predictions. Multicollinearity Linear regression models assume that the input variables are independent of each other. However, in practice, input variables are often correlated, a condition known as multicollinearity. Multicollinearity can lead to unstable and unreliable coefficient estimates, making it difficult to interpret the individual effects of the input variables on the output. Non-Normal Residuals Linear regression models assume that the residuals (the difference between the actual and predicted values) follow a normal distribution. However, in many real-world scenarios, the residuals may exhibit non- normal distributions, such as skewness, kurtosis, or heteroscedasticity. Violations of this assumption can lead to biased standard errors, confidence intervals, and hypothesis tests. Limited Flexibility Linear regression models have a limited ability to capture complex, non-linear relationships between the input and output variables. They are constrained by the linear function form, which may not be able to adequately represent the underlying data- generating process. This limitation can lead to poor model fit and reduced predictive accuracy, especially when dealing with complex, non-linear phenomena.
  • 3.
    Polynomial Regression Polynomial regressionis a powerful non-linear regression technique that can capture more complex relationships between the independent and dependent variables. Unlike linear regression, which fits a straight line to the data, polynomial regression uses a higher-order polynomial function to model the non-linear patterns in the data. This allows the model to fit more complex, curved relationships, making it a versatile tool for a wide range of applications. The key advantage of polynomial regression is its ability to capture non-linear trends in the data, such as exponential growth, parabolic shapes, or more complex functional forms. This is particularly useful when the relationship between the variables is not linear, as is often the case in real-world scenarios. By fitting a polynomial curve to the data, the model can better capture the underlying structure and make more accurate predictions. Another benefit of polynomial regression is its flexibility. The degree of the polynomial can be adjusted to fit the complexity of the data, from a simple quadratic function to higher-order polynomials. This allows the model to adapt to the specific characteristics of the dataset and find the optimal balance between model complexity and goodness of fit. However, polynomial regression also comes with some challenges. As the degree of the polynomial increases, the model becomes more susceptible to overfitting, where it fits the noise in the data rather than the underlying pattern. This can lead to poor generalization performance on new, unseen data. Careful model selection and regularization techniques are often necessary to prevent overfitting and ensure the model's robustness.
  • 4.
    Logistic Regression 1 BinaryClassification Logistic regression is a powerful technique for modeling binary outcomes, where the dependent variable can take on only two possible values, such as "yes/no", "pass/fail", or "healthy/sick". Unlike linear regression, which is used for continuous dependent variables, logistic regression uses a sigmoid function to transform the output into a probability between 0 and 1, allowing for accurate classification of data points into one of the two categories. 2 Probability Estimation The logistic regression model estimates the probability of the dependent variable being in one of the two classes, given the values of the independent variables. This probability is calculated using a logistic function, which maps the linear combination of the independent variables to a value between 0 and 1, representing the probability of the outcome. This approach allows for the interpretation of the model's results in terms of the likelihood of a particular outcome occurring. 3 Non-Linear Relationships Logistic regression is particularly useful when dealing with non-linear relationships between the independent and dependent variables. Unlike linear regression, which assumes a linear relationship, logistic regression can model more complex, non-linear patterns in the data. This makes it a valuable tool for a wide range of applications, from medical diagnosis to customer churn prediction, where the underlying relationships may not be linear.
  • 5.
    Exponential Regression Exponential regressionis a powerful non-linear regression technique that models data following an exponential growth or decay pattern. This technique is particularly useful when analyzing phenomena that exhibit rapid growth or decline, such as population growth, radioactive decay, or the spread of infectious diseases. Unlike linear regression, which assumes a constant rate of change, exponential regression captures the accelerating or decelerating nature of these processes by fitting an exponential function to the data. The exponential regression model takes the form y = a * b^x, where y is the dependent variable, x is the independent variable, a is the y-intercept, and b is the base of the exponential function. The model is fitted by estimating the values of a and b that best describe the observed data. This is typically done using non-linear optimization techniques, as the exponential function is not linear in its parameters. One of the key advantages of exponential regression is its ability to accurately model non- linear relationships that cannot be captured by linear regression. This makes it a valuable tool in a wide range of scientific and engineering applications, from forecasting population growth to analyzing the kinetics of chemical reactions. However, the non-linear nature of the model also means that its interpretation and parameter estimation can be more complex than linear regression, requiring specialized techniques and careful consideration of model assumptions.
  • 6.
    Gaussian Processes Gaussian Processesare a powerful non-linear regression technique that models the relationship between input variables and the target variable as a probability distribution rather than a deterministic function. This approach allows for the quantification of uncertainty in the predictions, making Gaussian Processes particularly useful for applications where accurate uncertainty estimates are crucial, such as in scientific research, engineering, and finance. In Gaussian Process regression, the function mapping the input variables to the target variable is assumed to be drawn from a Gaussian distribution. This distribution is characterized by a mean function and a covariance function, which together define the shape and properties of the underlying function. The covariance function, also known as the kernel, encodes the assumptions about the smoothness and correlation structure of the function, allowing Gaussian Processes to capture complex non-linear relationships. One of the key advantages of Gaussian Processes is their flexibility in modeling a wide range of non-linear functions, from simple polynomials to highly complex, multi-modal relationships. They can also handle noisy and sparse data, making them a robust choice for
  • 7.
    Kernel Regression Function Approximation Kernel regressionis a non-parametric technique used for function approximation. Unlike linear regression which fits a straight line to the data, kernel regression can model complex, non-linear relationships between the input variables and the target variable. It does this by using a weighted average of the nearby data points to make predictions, where the weights are determined by a Flexible Modeling One of the key advantages of kernel regression is its flexibility. Because it doesn't assume a specific functional form, it can adapt to a wide range of data patterns. This makes it particularly useful for problems where the underlying relationship is unknown or difficult to model parametrically. Kernel regression can capture complex, nonlinear trends in the data without the need to specify a particular Hyperparamete r Tuning To achieve optimal performance, kernel regression requires careful selection of the kernel function and its associated hyperparameters. The kernel function determines the shape of the weighting function used to combine nearby data points. Common kernel functions include the Gaussian, Epanechnikov, and Tricube kernels. The bandwidth hyperparameter controls the size of the "neighborhood" around each data Applications Kernel regression has a wide range of applications in fields like machine learning, data analysis, and scientific modeling. It can be used for tasks such as regression, classification, time series forecasting, and density estimation. Some common application areas include image processing, signal processing, bioinformatics, and finance. Kernel regression's flexibility and ability to capture complex nonlinearities make
  • 8.
    Neural Networks forNon-Linear Regression Neural networks have emerged as a powerful tool for tackling non-linear regression problems. Unlike traditional linear regression models, neural networks can capture complex, non-linear relationships between the input variables and the target variable. This makes them well-suited for modeling a wide range of real-world phenomena that exhibit non-linear patterns, such as stock market prices, weather patterns, or the relationship between a person's age and their income. At the heart of a neural network for non-linear regression is a series of interconnected layers, each containing numerous neurons that learn to recognize patterns in the data. These layers transform the input features through a series of non-linear activations, allowing the network to model highly complex functions. By adjusting the weights and biases of the connections between neurons, the neural network can be trained to minimize the error between its predictions and the observed data, effectively learning the underlying non-linear relationships. One of the key advantages of neural networks for non-linear regression is their ability to handle high- dimensional, noisy, and incomplete data. They can automatically learn relevant features and patterns from the input, without the need for extensive feature engineering. Additionally, modern neural network architectures, such as deep feedforward networks, recurrent neural networks, and convolutional neural networks, have proven to be highly effective in capturing even the most intricate non-linear relationships in a wide range of application domains. While neural networks for non-linear regression offer powerful capabilities, they also come with their own challenges. Proper model selection, hyperparameter tuning, and training techniques are crucial to ensuring the network learns the right representations and generalizes well to new, unseen data. Additionally, the interpretability of neural networks can be more complex compared to traditional regression models, making it important to carefully analyze the learned patterns and their implications.
  • 9.
    Advantages and Disadvantagesof Non-Linear Regression 1 Flexibility Non-linear models can capture complex, non-linear relationships between variables. 2 Improved Accuracy Non-linear models can often fit data better than linear models, leading to more accurate predictions. 3 Representation of Real-World Phenomena Many real-world processes exhibit non-linear behavior, which non-linear models are better equipped to capture. Non-linear regression offers several key advantages over traditional linear regression. Firstly, it provides greater flexibility in modeling complex, non-linear relationships between variables. This allows non-linear models to capture nuances and patterns that linear models may miss, leading to improved accuracy in predictions and a better representation of real-world phenomena.
  • 10.
    Applications and CaseStudies Medical Research Non-linear regression models are widely used in medical research to analyze complex relationships between variables. For example, researchers may use logistic regression to predict the likelihood of a patient developing a certain disease based on multiple risk factors. Exponential regression can be applied to model the growth of tumors over time, while Business Forecasting In the business world, non-linear regression techniques are invaluable for forecasting sales, predicting market trends, and optimizing pricing strategies. Companies may use polynomial regression to model the relationship between advertising spend and revenue, or neural networks to forecast stock prices based on a variety of economic Scientific Research Beyond medical and business applications, non- linear regression is a crucial tool in scientific research across disciplines. Ecologists may use logistic regression to model the population dynamics of endangered species, while physicists employ Gaussian processes to interpolate experimental data and make predictions about particle interactions. The flexibility and Urban Planning In the realm of urban planning and development, non- linear regression techniques are invaluable for modeling the complex, interconnected systems that shape our cities. Planners may use polynomial regression to predict the impact of new infrastructure on traffic patterns, or logistic regression to forecast the growth of residential and commercial areas. By accounting for