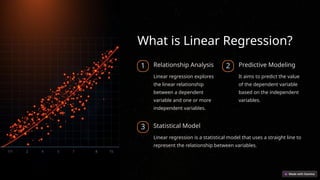
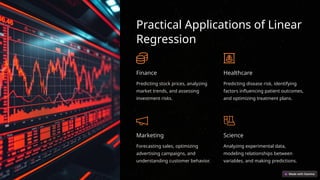
Introduction to
Linear Regression:
Concepts,
Application, and
Interpretation
Linear regression is a powerful statistical tool used to analyze and
predict relationships between variables. It helps uncover patterns in
data, enabling informed decision-making.
by Chetan Raut
What is Linear Regression?
1 Relationship Analysis
Linear regression explores
the linear relationship
between a dependent
variable and one or more
independent variables.
2 Predictive Modeling
It aims to predict the value
of the dependent variable
based on the independent
variables.
3 Statistical Model
Linear regression is a statistical model that uses a straight line to
represent the relationship between variables.
Assumptions of Linear
Regression
Linearity
There should be a linear
relationship between the
variables.
Independence
The observations should be
independent of each other.
Homoscedasticity
The variance of the errors
should be constant across all
values of the independent
variable.
Normality
The errors should be normally
distributed.
Simple Linear Regression
1 Single Independent Variable
Simple linear regression involves predicting a dependent
variable using just one independent variable.
2 Straight Line Equation
The model uses a straight line equation to represent the
relationship between the variables.
3 Slope and Intercept
The equation consists of a slope and an intercept, which
define the line's direction and starting point.
Multiple Linear Regression
Multiple Predictors
Multiple linear regression uses two or
more independent variables to
predict the dependent variable.
Complex Relationships
It accounts for complex relationships
between multiple predictors and the
outcome.
Improved Accuracy
Using multiple predictors often leads
to more accurate predictions
compared to simple linear regression.
Model Evaluation and
Interpretation
R-squared Measures the proportion of
variance in the dependent
variable explained by the
model.
P-value Indicates the significance of the
relationship between the
independent and dependent
variables.
Coefficients Represent the strength and
direction of the relationship
between each independent
variable and the dependent
variable.
Practical Applications of Linear
Regression
Finance
Predicting stock prices, analyzing
market trends, and assessing
investment risks.
Healthcare
Predicting disease risk, identifying
factors influencing patient outcomes,
and optimizing treatment plans.
Marketing
Forecasting sales, optimizing
advertising campaigns, and
understanding customer behavior.
Science
Analyzing experimental data,
modeling relationships between
variables, and making predictions.
Limitations and
Considerations
Non-Linear Relationships
Linear regression may not accurately represent
relationships that are not linear.
Outliers
Outliers can significantly impact the model's accuracy and
should be addressed.
Multicollinearity
High correlation between independent variables can make it
difficult to interpret the model's coefficients.
Conclusion and Key
Takeaways
1 Powerful Tool
Linear regression is a
versatile tool for analyzing
and predicting
relationships between
variables.
2 Assumptions
Understanding and
validating the assumptions
of linear regression is
crucial for reliable results.
3 Practical Applications
Linear regression has numerous practical applications in various
fields, including finance, healthcare, and marketing.

Introduction-to-Linear-Regression-Concepts-Application-and-Interpretation.pptx

  • 1.
    Introduction to Linear Regression: Concepts, Application,and Interpretation Linear regression is a powerful statistical tool used to analyze and predict relationships between variables. It helps uncover patterns in data, enabling informed decision-making. by Chetan Raut
  • 2.
    What is LinearRegression? 1 Relationship Analysis Linear regression explores the linear relationship between a dependent variable and one or more independent variables. 2 Predictive Modeling It aims to predict the value of the dependent variable based on the independent variables. 3 Statistical Model Linear regression is a statistical model that uses a straight line to represent the relationship between variables.
  • 3.
    Assumptions of Linear Regression Linearity Thereshould be a linear relationship between the variables. Independence The observations should be independent of each other. Homoscedasticity The variance of the errors should be constant across all values of the independent variable. Normality The errors should be normally distributed.
  • 4.
    Simple Linear Regression 1Single Independent Variable Simple linear regression involves predicting a dependent variable using just one independent variable. 2 Straight Line Equation The model uses a straight line equation to represent the relationship between the variables. 3 Slope and Intercept The equation consists of a slope and an intercept, which define the line's direction and starting point.
  • 5.
    Multiple Linear Regression MultiplePredictors Multiple linear regression uses two or more independent variables to predict the dependent variable. Complex Relationships It accounts for complex relationships between multiple predictors and the outcome. Improved Accuracy Using multiple predictors often leads to more accurate predictions compared to simple linear regression.
  • 6.
    Model Evaluation and Interpretation R-squaredMeasures the proportion of variance in the dependent variable explained by the model. P-value Indicates the significance of the relationship between the independent and dependent variables. Coefficients Represent the strength and direction of the relationship between each independent variable and the dependent variable.
  • 7.
    Practical Applications ofLinear Regression Finance Predicting stock prices, analyzing market trends, and assessing investment risks. Healthcare Predicting disease risk, identifying factors influencing patient outcomes, and optimizing treatment plans. Marketing Forecasting sales, optimizing advertising campaigns, and understanding customer behavior. Science Analyzing experimental data, modeling relationships between variables, and making predictions.
  • 8.
    Limitations and Considerations Non-Linear Relationships Linearregression may not accurately represent relationships that are not linear. Outliers Outliers can significantly impact the model's accuracy and should be addressed. Multicollinearity High correlation between independent variables can make it difficult to interpret the model's coefficients.
  • 9.
    Conclusion and Key Takeaways 1Powerful Tool Linear regression is a versatile tool for analyzing and predicting relationships between variables. 2 Assumptions Understanding and validating the assumptions of linear regression is crucial for reliable results. 3 Practical Applications Linear regression has numerous practical applications in various fields, including finance, healthcare, and marketing.