
Recommended
Recommended
More Related Content
Similar to 2. Introduction-to-Measures-of-Central-Tendency.pptx
Similar to 2. Introduction-to-Measures-of-Central-Tendency.pptx (20)
More from ShriramKargaonkar
More from ShriramKargaonkar (16)
Recently uploaded
Recently uploaded (20)
2. Introduction-to-Measures-of-Central-Tendency.pptx
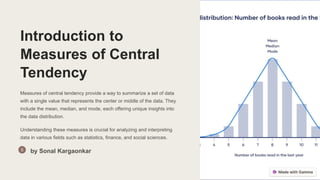
- 1. Introduction to Measures of Central Tendency Measures of central tendency provide a way to summarize a set of data with a single value that represents the center or middle of the data. They include the mean, median, and mode, each offering unique insights into the data distribution. Understanding these measures is crucial for analyzing and interpreting data in various fields such as statistics, finance, and social sciences. by Sonal Kargaonkar
- 2. Mean: Definition and Calculation 1. Definition: The mean, also known as the average, is the sum of all values in a dataset divided by the number of values. 2. Calculation: To calculate the mean, sum all the values and then divide by the total number of values in the dataset. 3. Importance: It provides a central value that represents the entire dataset, making it a key measure of central tendency.
- 3. Median: definition and calculation • Definition: The median is the middle value in a set of numbers when arranged in ascending order. • Calculation: To find the median, the numbers are ordered and the middle number is selected, or the average of the two middle numbers is calculated for an even set. • Importance: The median is less affected by extreme values, making it useful for representing the center of a data set.
- 4. Mode: definition and calculation • Definition: The mode is the value that appears most frequently in a dataset. • Calculation: To find the mode, identify the value that occurs with the highest frequency.
- 5. When to Use Mean, Median, or Mode Use the mean for data with a normal distribution, the median for skewed data, and the mode for categorical data. Mean is sensitive to outliers, while median is robust. Mode is useful for identifying frequently occurring categories.
- 6. Advantages and disadvantages of each measure Mean Advantages: Reflects the central value, sensitive to all data points. Disadvantages: Sensitive to outliers, influenced by extreme values. Median Advantages: Resistant to outliers, good for skewed distributions. Disadvantages: Ignores value differences within categories, not always precise. Mode Advantages: Useful for categorical data, can have multiple modes. Disadvantages: Ignores variability, not always representative of the data set.
- 7. Examples of calculating mean, median, and mode 15 Mean Sum of all values divided by the number of values 20 Median Middle value when numbers are arranged in ascending order 12 Mode Most frequently occurring value in a set This section will provide practical examples of how to calculate the mean, median, and mode for given data sets. Each calculation will be accompanied by a brief explanation of the process and significance of the result.
- 8. Real-world applications of measures of central tendency Evaluating Economic Trends Measures of central tendency are used to analyze and compare average household incomes, providing insights into economic disparities and social inequalities. Weather Data Analysis Mean, median, and mode help meteorologists understand temperature distributions, aiding in weather forecasting and climate pattern recognition.
- 9. Common Misconceptions about Measures of Central Tendency Mean Represents Typical Value Contrary to popular belief, the mean can be heavily influenced by outliers, making it unrepresentative of a typical value in skewed distributions. Median is Always the Best Measure While the median is resistant to outliers, it may not accurately reflect the central tendency in certain cases, such as multimodal distributions. Mode is Always Reliable Some misconceive that the mode always represents the most frequent value, overlooking cases with no modes or distributions with multiple modes.
- 10. Conclusion and Summary of Key Points 1 Measures of Central Tendency They provide a way to summarize and describe the characteristics of a dataset in a single value. 2 Mean, Median, Mode Each measure has its own strengths and limitations when analyzing data. 3 Choosing the Right Measure Selecting the appropriate measure depends on the distribution and nature of the data. 4 Interpreting Results Understanding the implications of the chosen measure for making informed decisions based on the data.