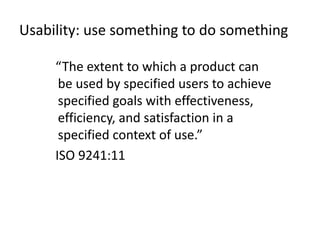
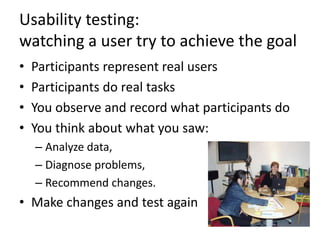
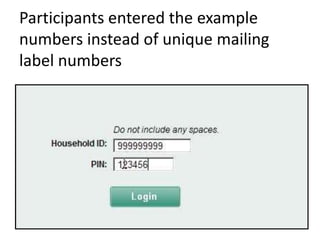
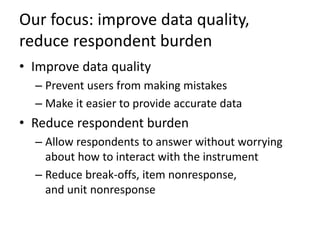
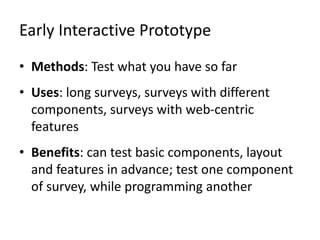
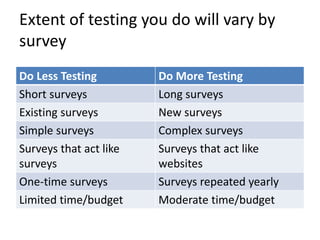
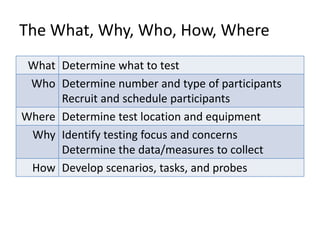
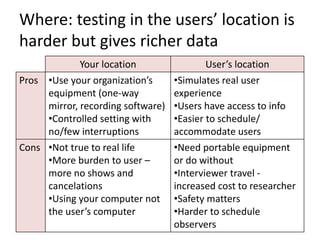
This document provides guidance on planning and preparing for usability testing of surveys. It discusses determining what aspects of a survey to test, who to recruit as participants, and where to conduct the testing. Key recommendations include deciding what to test at least a month before testing, recruiting 5-10 participants to represent intended users, and conducting testing in rounds with revisions between rounds rather than one large test. Locations for testing can either be at the organization conducting the test or in participants' natural environments.
In this presentation, we discuss the key steps for cleaning and managing data in SPSS. We will review removal of participants, imputation, creating composite scores, and checking for outliers.
Critical evaluation of an article titled " Effects of health empowerment intervention on resilience of adolescents in a tribal area: A study using the Solomon four-groups design"
Poisson distribution used in cases where the chance of any individual event being a success is very small. The distribution is used to describe the behavior of rare events.
It is limiting case of binomial distribution.
Thematic analysis is a poorly demarcated, rarely-acknowledged, yet widely-used qualitative analytic method within psychology. In this paper, we argue that it offers an accessible and theoretically-flexible approach to analysing qualitative data. We outline what thematic analysis is, locating it in relation to other qualitative analytic methods that search for themes or patterns, and in relation to different epistemological and ontological positions. We then provide clear guidelines to those wanting to start thematic analysis, or conduct it in a more deliberate and rigorous way, and consider potential pitfalls in conducting thematic analysis. Finally, we outline the disadvantages and advantages of thematic analysis. We conclude by advocating thematic analysis as a useful and flexible method for qualitative research in and beyond psychology.
Keywords: thematic analysis, qualitative psychology, patterns, epistemology, flexibility
Braun, V. and Clarke, V., 2006
Analysis of Variance and Repeated Measures DesignJ P Verma
This presentation discusses the basic concept used in analysis of variance and it shows the difference between independent measures ANOVA and Repeated measures ANOVA
Facebook Talk at Netflix ML Platform meetup Sep 2019Faisal Siddiqi
In this talk at the Netflix Machine Learning Platform Meetup on 12 Sep 2019, Sam Daulton from Facebook discusses "Practical Solutions to real-world exploration problems".
Qualitative research design in research in educationRashna Asif
This presentation all about the qualitative research design its approaches features characteristics analysis and also data collection tools in this presentation approaches are very deeply discussed.
Learn how to use prototyping and usability testing as a means to validate proposed functionality and designs before you invest in development. SOMETIMES there is a huge disconnect between the people who make a product and the people who use it. Usability testing is vital to uncovering the areas where these disconnects happen. In this symposium you will learn the steps to conduct a successful usability test. This includes tips and real life examples on how to plan the tests, recruit users, facilitate the sessions, analyze the data, and communicate the results.
Introduction to Usability Testing: The DIY Approach - GA, London January 13th...Evgenia (Jenny) Grinblo
The slides from my General Assembly workshop on January 13th, 2013 (https://generalassemb.ly/education/introduction-to-usability-testing-the-diy-approach)
ABOUT THIS WORKSHOP
Usability testing can quickly uncover areas of an interface that frustrate users and hurt business goals but many teams put it off due to budget, time, or training concerns.
This workshops will take you through a do-it-yourself approach to usability testing. We'll cover the basics (benefits, recruiting, and how to plan a test), learn how to facilitate a test to get reliable results, and how to use the testing results to move usability improvements forward. You'll walk away with the tools to hold a complete usability testing right away.
TAKEAWAYS
Learn why and when to hold usability testing
Learn practical tools and methods to overcome time, budget or training concerns that block user testing from happening
Shift the conversation from opinions and hunches to proven usability problems that your team can solve together
This presentation focuses both on subscription databases and U.S. government information resources available for students enrolled in the POL 211 class.
Interfaces have always been areas of peril in software development. This presentation to the O'Reilly Software Architecture Conference 2016 in London challenges teams to include interfaces with people, and maybe even with paper, in their notions of where development begins and ends. For anyone delivering software that has to be used by real people, the presentation will help you distinguish between software that is “deployed” and actually “delivered.”
The design part of interaction design Michael Dain
From a recent lecture, here are the basics of what design means to the User Experience. This is hardly exhaustive, but a good primer on some of the essential elements. Some buzzwords include: Skeumorphism, Flat, Gestalt, Typography – all the tools an interface designer needs to connect emotionally to an audience.
Better User Experience for WordPress Sitesaungstad
An introduction to a handful of universal principles of User Experience (UX) design with tips on how to implement them on a WordPress site. Many of the ideas are easy to implement and will be useful for any site really - large or small, wordpress or not.
Presented to the WordPress Geneva group on April 23, 2013. Thanks & enjoy!
IA Summit 2015 - Enterprise Taxonomy for FIFAaungstad
More than ever large organizations need taxonomy to retrieve, publish and manage information in the way they want to. Being able to manage records, documents and other digital assets throughout their lifecycle is key to efficient operations and effective communications.
This is a case study of a taxonomy project completed for the world’s football governing authority, FIFA. As a global organization over 100 years old FIFA has produced a large collection of official documents, and they needed a way to organize them.
From the business problem that sparked the project to the exercises, analysis and standards used to the derive the final product, we’ll look at each phase of this unique taxonomy project, and take away a few useful insights along the way.
Session Takeaways
- How to lead a taxonomy project
- Real-world taxonomy development
- Information governance for global regulatory bodies
The presentation will provide an overview of the key forms of research that are frequently conducted to support the UX design process – and how they are traditionally conducted. The presentation will then focus on two forms of UX research and the positive impact that moving these into the digital realm has on the quality, timing, and cost of the research – as well as highlighting the challenges it brings.
Designing with Empathy: How user research can help you make better productsKatie McCurdy
[Talk presented at UX Burlington in June, 2015]
You're under the gun. You have deadlines, developers are waiting on you, and even though you know you should probably talk to your intended users at some point, it just doesn't feel possible to fit into your workflow. And hey, if Henry Ford had asked his customers what they wanted, they would have said 'a faster horse,' right?
Ouch! There are a lot of misunderstandings about what user research actually is, how to do it, its cost, and the value it brings to the product design process. In this talk, Katie covers these basics and presents some specific, interface-level examples of how up-front user research and mid-project usability testing have helped improve designs and create products that people love. You'll walk away with tips for advocating for and incorporating user research into your next project in a cost-effective way, and you’ll understand the powerful difference between building empathy with your customers, and ‘doing what they say.’
User Experiments in Human-Computer InteractionDr. Arindam Dey
This lecture covers the basics of user experiment design in human-computer interaction. Computer scientists and developers often create interfaces for a particular purpose. This lecture explains how a user experiment can be designed and conducted to systematically compare one interface with the other.
valuation is a methodological area that is closely related to, but distinguishable from more traditional social research. Evaluation utilizes many of the same methodologies used in traditional social research, but because evaluation takes place within a political and organizational context, it requires group skills, management ability, political dexterity, sensitivity to multiple stakeholders and other skills that social research in general does not rely on as much.
These slides cover various aspects of testing in the context of computer science and human-computer interaction (HCI). It includes topics like evaluation techniques, empirical methods in HCI, controlled experiments, and various testing approaches such as A/B testing, cognitive walkthrough, heuristic evaluation, and review-based evaluation. Additionally, it touches on issues related to internal and external validity, reliability in testing, and different experimental designs like between-subjects and within-subjects experiments. This material appears to be educational and is likely used in a course related to computer science or HCI.
All content within this presentation is the property of Royal Holloway, University of London. Unauthorized use, duplication, or distribution of the materials contained herein is strictly prohibited.
In this workshop for the Virtual SDinGov 2024 , Caroline takes participants through two sets of guidelines in search of advice on how to make a single forms question accessible. She then introduces her own question protocol as a method of scrutinising and improving any question.
A presentation for the the Content Wrangler's coffee and content session on how to design and run surveys and gain actionable insights from the survey data.
Some thoughts on good survey design delivered to students at Olin College of Engineering. Caroline's talk covers her survey process, survey goals and focusing on a specific decision, sample and sampling error, ditching rating scales, and losing fear of open answers.
The Phylogenetic Tree in forms design - making forms work for complex academ...Caroline Jarrett
How can we guide busy academics in specialist fields through application processes that are complex, vary greatly depending on the funder, and always seem to be extra urgent? Especially when the stakes are high: awards can be in the millions, and research income is important to fund work that we can all benefit from.
For this year's HE Connect conference, Cambridge University Senior Product Manager Karen Fernandes and forms expert Caroline Jarrett reflected on how current work at Cambridge, and government forms patterns, can help (or hinder) this sort of multi-person, multi-challenge process.
In this half day workshop for ~WebExpo2023 Caroline Jarrett shares four ways to improve your survey so that you get plenty of useful responses.
Goals: Ruthlessly focus your survey on an immediate decision.
Sample: Write an invitation that makes people want to answer.
Questions: Ditch the rating scales.
Responses: Lose your fear of open answers.
Two ways to improve your survey, webinar for Delib 2023.pptxCaroline Jarrett
In this webinar for Delib, Caroline shows you how to get better results from shorter, more frequent surveys - with a special emphasis on local government and the requirement to run statutory consultations. Understanding and identifying the Most Crucial Question and making space for the Burning Issue are both helpful techniques for creating shorter more focused surveys.
Did you love the form that you filled in most recently? Or did you hit some problems? Most of us find all sorts of small or major problems with lots of the forms we are forced to use.
In this talk for #WebExpo2023, Caroline turns that around. She points out the ways in which not fixing your forms is costing your organisation a lot of money. She then goes on to share plenty of practical tips for making improvements that will enable people to successfully complete your forms.
Two ways to improve your surveys: the Most Crucial Question and the Burning I...Caroline Jarrett
In this webinar for product managers, Caroline introduces two key concepts from her book on surveys: identifying the most crucial question as part of getting clear on your goals, and allowing respondents to tell you the things that they want to - their burning issue. The webinar was organised by Productboard and held on March 30, 2023.
In this member call for Boye & Co Caroline takes participants through her process for expert reviews of forms. She also shares some of her top tips for making them easier to use and more effective.
What is a service designer SDinGOV 22 with all stickies.pptxCaroline Jarrett
In this case study for the 2022 Service Design in Government conference Caroline challenges people to think about their own definitions and shares her own - which is based on her three-layer model for creating good forms.
Helping teenage boys to become responsible adults.pptxCaroline Jarrett
Teenage boys use our services but many of us know little about them. In this session, Bukola (Kiki) Jolugbo and Caroline Jarrett shared some facts about teenage boys and some principles for helping them to become responsible adults.
Some thoughts on surveys: Boye and Company member conference callCaroline Jarrett
Slides from a short presentation on creating effective surveys. The event was a conference call for members of a community network organised by Janus Boye of Boye & Company.
Plain language to improve your survey houston 2022Caroline Jarrett
Plain language skills are vital for surveys - and especially to writing good questions and creating them for your survey audience. This presentation was prepared for the University of Houston's 8th Biannual Forum on Plain English, 24 February 2022.
Surveys that work:training course for Rosenfeld Media, day 1Caroline Jarrett
Surveys seem easy: anyone can throw together a few questions, send them out, and hope that they are rewarded with a decent response. But we’ve all seen examples of poorly conceived surveys that couldn’t possibly deliver real insights for the organisation that sponsored them.
This highly participative three-session training - arranged by Rosenfeld Media as part of its Virtual Training with UX Industry Leaders programme - takes you through the whole process of creating an effective survey, from defining a goal through analysis of data and creating a presentation.
These slides come from day 1 of the course: goals and sample.
Surveys that work: training course for Rosenfeld media, day 2Caroline Jarrett
Surveys seem easy: anyone can throw together a few questions, send them out, and hope that they are rewarded with a decent response. But we’ve all seen examples of poorly conceived surveys that couldn’t possibly deliver real insights for the organisation that sponsored them.
This highly participative three-session training - arranged by Rosenfeld Media as part of its Virtual Training with UX Industry Leaders programme - takes you through the whole process of creating an effective survey, from defining a goal through analysis of data and creating a presentation.
These slides come from day 2 of the course: questions, questionnaire and fieldwork
Surveys that work: training course for Rosenfeld Media, day 3 Caroline Jarrett
Surveys seem easy: anyone can throw together a few questions, send them out, and hope that they are rewarded with a decent response. But we’ve all seen examples of poorly conceived surveys that couldn’t possibly deliver real insights for the organisation that sponsored them.
This highly participative three-session training - arranged by Rosenfeld Media as part of its Virtual Training with UX Industry Leaders programme - takes you through the whole process of creating an effective survey, from defining a goal through analysis of data and creating a presentation.
These slides come from day 3 of the course: responses and reports.
Surveys that work: an introduction to the Survey Octopus and Total Survey ErrorCaroline Jarrett
A presentation for Harvard University's User Research Community on some of the key issues in creating effective surveys, including: why run a survey, writing good questions, statistical significance and how to avoid errors.
Expert Accessory Dwelling Unit (ADU) Drafting ServicesResDraft
Whether you’re looking to create a guest house, a rental unit, or a private retreat, our experienced team will design a space that complements your existing home and maximizes your investment. We provide personalized, comprehensive expert accessory dwelling unit (ADU)drafting solutions tailored to your needs, ensuring a seamless process from concept to completion.
Top 5 Indian Style Modular Kitchen DesignsFinzo Kitchens
Get the perfect modular kitchen in Gurgaon at Finzo! We offer high-quality, custom-designed kitchens at the best prices. Wardrobes and home & office furniture are also available. Free consultation! Best Quality Luxury Modular kitchen in Gurgaon available at best price. All types of Modular Kitchens are available U Shaped Modular kitchens, L Shaped Modular Kitchen, G Shaped Modular Kitchens, Inline Modular Kitchens and Italian Modular Kitchen.
Transforming Brand Perception and Boosting Profitabilityaaryangarg12
In today's digital era, the dynamics of brand perception, consumer behavior, and profitability have been profoundly reshaped by the synergy of branding, social media, and website design. This research paper investigates the transformative power of these elements in influencing how individuals perceive brands and products and how this transformation can be harnessed to drive sales and profitability for businesses.
Through an exploration of brand psychology and consumer behavior, this study sheds light on the intricate ways in which effective branding strategies, strategic social media engagement, and user-centric website design contribute to altering consumers' perceptions. We delve into the principles that underlie successful brand transformations, examining how visual identity, messaging, and storytelling can captivate and resonate with target audiences.
Methodologically, this research employs a comprehensive approach, combining qualitative and quantitative analyses. Real-world case studies illustrate the impact of branding, social media campaigns, and website redesigns on consumer perception, sales figures, and profitability. We assess the various metrics, including brand awareness, customer engagement, conversion rates, and revenue growth, to measure the effectiveness of these strategies.
The results underscore the pivotal role of cohesive branding, social media influence, and website usability in shaping positive brand perceptions, influencing consumer decisions, and ultimately bolstering sales and profitability. This paper provides actionable insights and strategic recommendations for businesses seeking to leverage branding, social media, and website design as potent tools to enhance their market position and financial success.
Hello everyone! I am thrilled to present my latest portfolio on LinkedIn, marking the culmination of my architectural journey thus far. Over the span of five years, I've been fortunate to acquire a wealth of knowledge under the guidance of esteemed professors and industry mentors. From rigorous academic pursuits to practical engagements, each experience has contributed to my growth and refinement as an architecture student. This portfolio not only showcases my projects but also underscores my attention to detail and to innovative architecture as a profession.
Book Formatting: Quality Control Checks for DesignersConfidence Ago
This presentation was made to help designers who work in publishing houses or format books for printing ensure quality.
Quality control is vital to every industry. This is why every department in a company need create a method they use in ensuring quality. This, perhaps, will not only improve the quality of products and bring errors to the barest minimum, but take it to a near perfect finish.
It is beyond a moot point that a good book will somewhat be judged by its cover, but the content of the book remains king. No matter how beautiful the cover, if the quality of writing or presentation is off, that will be a reason for readers not to come back to the book or recommend it.
So, this presentation points designers to some important things that may be missed by an editor that they could eventually discover and call the attention of the editor.
Can AI do good? at 'offtheCanvas' India HCI preludeAlan Dix
Invited talk at 'offtheCanvas' IndiaHCI prelude, 29th June 2024.
https://www.alandix.com/academic/talks/offtheCanvas-IndiaHCI2024/
The world is being changed fundamentally by AI and we are constantly faced with newspaper headlines about its harmful effects. However, there is also the potential to both ameliorate theses harms and use the new abilities of AI to transform society for the good. Can you make the difference?
White wonder, Work developed by Eva TschoppMansi Shah
White Wonder by Eva Tschopp
A tale about our culture around the use of fertilizers and pesticides visiting small farms around Ahmedabad in Matar and Shilaj.
2. We would like to thank
• Sarah Cook and Liz Dean
• Todd Hughes and Kathleen Ashenfelter
for their contributions to this short course
Emily Geisen
egeisen@rti.org
Caroline Jarrett
carolinej@effortmark.co.uk
3. Session Ground Rules
• Cell phones turned to vibrate or off
• Refreshments and restrooms any time
• 10-15 break midway through
• Questions are encouraged
6. Usability: use something to do something
“The extent to which a product can
be used by specified users to achieve
specified goals with effectiveness,
efficiency, and satisfaction in a
specified context of use.”
ISO 9241:11
7. Usability: use something to do something
“The extent to which a product can
be used by specified users to achieve
specified goals with effectiveness,
efficiency, and satisfaction in a
specified context of use.”
-ISO 9241:11
8. What does usability mean for your survey?
• Product
• Users
• Goals
• Context
• Effectiveness, Efficiency, Satisfaction
9. Our view of usability for surveys
Product Web sites, web surveys, paper surveys
Users Our respondents (mostly),
could also be our interviewers
Goals They want to provide their correct
and accurate opinions, stories, facts,
predictions
Context of use In their homes, offices,
out and about?
Effectiveness,
Efficiency,
Satisfaction
Get to the end of the survey
having provided accurate answers
without breaking-off.
10. Effectiveness: achieve a goal
Efficiency: appropriate time /effort
Efficient + effective = useful
11. Satisfaction is more complex
• Did it allow them to provide
their accurate answers?
• Did they enjoy the experience?
• Did it require too much time to complete?
• Did they find the instrument easy to use?
• Did they find it easy to learn how to use?
12. Other factors may be important
• Easy to learn
• Easy to remember how to use (memorability)
• Error frequency and severity
• Accessibility
• And most crucially for surveys:
– Data quality
– Respondent burden
13. Usability testing:
watching a user try to achieve the goal
• Participants represent real users
• Participants do real tasks
• You observe and record what participants do
• You think about what you saw:
– Analyze data,
– Diagnose problems,
– Recommend changes.
• Make changes and test again
15. Web surveys are not websites…
…so why is usability testing
needed for survey research?
16. Users are not trained interviewers
• Web surveys go to the general (or specific)
public
– Varying levels of computer expertise
– Varying levels of literacy
– Likely to be in a hurry, interrupted, distracted
• There is no interviewer
– No one to interpret the questions
– No one to navigate around the instrument
17. Presser et al 2004: pretesting focuses
on a “broader concern for improving
data quality so that
measurements meet
a survey’s objective”
Field testing
focuses on the
mechanics and
procedures
Cognitive
interviewing
focuses on the
questions
Usability
testing
focuses on
interaction
18. Example: login for a web survey
• Ashenfelter, K., & Hughes, T. (July, 2011). Results
from Iterative Usability Testing of the American
Community Survey (ACS). Presented at European
Survey Research Association, Lausanne, Switzerland.
• Security guidance recommended providing a
Household ID and PIN in the mail materials
• For logistical reasons, login information
included on the mailing label was printed on
the questionnaire
25. Our focus: improve data quality,
reduce respondent burden
• Improve data quality
– Prevent users from making mistakes
– Make it easier to provide accurate data
• Reduce respondent burden
– Allow respondents to answer without worrying
about how to interact with the instrument
– Reduce break-offs, item nonresponse,
and unit nonresponse
27. Background on GSS
• Establishment survey, completed by admin
• Respondents provide a list of departments at
their university that…
– Are science, engineering and health related
– Have graduate students or postdocs
• For each department, respondent provide
– Counts, race/ethnicity, citizenship, financial
support data
28. Why did we conduct testing on the
GSS?
• Evidence that respondents were not updating
their list of departments each year
• Revised survey to emphasize the need to
review list of departments and update
• Wanted to see if participants could actually
update their listing
29. The demo video will include…
• Usability testing introduction
• Description of scenario/tasks
– Scenario: new PhD departments at school
– Task 1: complete survey as usual
– Task 2: update list of departments
• Background questions to build rapport
• Completing the survey
30. Take notes as you watch!
• What do you observe?
• What should we do about it?
31. RTI International
3. Survey Research and Usability
How to build usability testing into
your survey development process
33. Principles for user-centered design
a) The design is based upon an explicit understanding of
users, tasks and environments
b) Users are involved throughout design and development
c) The design is driven and refined by user-centred
evaluation
d) The process is iterative
e) The design addresses the whole user experience
f) The design team includes multidisciplinary skills
and perspectives
-ISO 9241-210
34. What does this mean for survey
testing?
• I will show a couple examples of usability
testing with surveys
• Think about which principle, the example is
addressing
35. Example: Graduate Student Survey (GSS)
• Background
– GSS collects data about graduate students and
postdocs in different fields of study
– NSF wanted to modify GSS to capture data at a
more consistent and detailed level (e.g., programs
instead of departments)
• The design approach
– Redesigned parts of survey using this model
– Conducted usability testing
36. Created a Hierarchy to Collect Data
• School/College: The Graduate school
• Department: Biological Sciences
– Program: Cell Biology
» Provide counts of graduate students in cell biology by
race/ethnicity, sex, etc
– Program: Botany
» Provide counts of graduate students in botany by
race/ethnicity, sex, etc
• Department: Physics
– Program: Atmospheric physics
» Provide counts of graduate students in cell biology by
race/ethnicity, sex, etc
37. Survey Framework Did Not Fit Users
• No common terminology
– What is a department vs program?
– Used other terminology altogether:
division, concentration, track, field, subject
• No common hierarchy or structure
– Departments within programs and vice versa
– No departments, just programs
– Some departments had programs, some didn’t
• Information not available at level desired
38. Which principle was that an example of?
a) The design is based upon an explicit understanding of
users, tasks and environments
b) Users are involved throughout design and development
c) The design is driven and refined by user-centred
evaluation
d) The process is iterative
e) The design addresses the whole user experience
f) The design team includes multidisciplinary skills and
perspectives
39. Example 2
• Concern: Want to know best method for
providing definitions in web surveys
• Ask: Has this been done before?
• Start with the literature:
– Conrad, Couper, Tourangeau, Peytchev (2006)
– Peytchev, Conrad, Couper, Tourangeau (2007)
– Peytchev, Conrad, Couper, Tourangeau (2010)
40. Example 2:
• Methods
– Experiment 1: One-click, two-clicks, click and scroll
– Experiment 2: roll-over, one-click, two-clicks
– Experiment 3: hover-over vs always included
• Conclusions:
– Reading definitions probably improves accuracy
– Less effort required, more likely to read definitions
41.
42. Which principle was that an example of?
a) The design is based upon an explicit understanding of
users, tasks and environments
b) Users are involved throughout design and development
c) The design is driven and refined by user-centred
evaluation
d) The process is iterative
e) The design addresses the whole user experience
f) The design team includes multidisciplinary skills and
perspectives
43. User-centered evaluation includes best
practices/findings from literature
• Start with web & survey best practices
• Abundance of literature:
– Designing Effective Web Surveys (Couper)
– Internet, Mail, and Mixed-Mode Surveys (Dillman)
• Both these focus on
– Good survey design
– Good web design
44. Build off the literature before doing
usability testing
• Usability testing will show you how well or
how easily people can do method A
• Will not necessarily show you that method A
is definitively better than method B
• Not a replacement for large, probability-based
methodological experiments
• Works best for exploratory testing
45. Start with the literature, but decide
what’s relevant for your study
• The literature may not focus on the study population
needed for your survey
• May not be any literature on the particular topic or
issue your survey has
• And sometimes the experts just don’t agree,
then what?
57. RTI International
3b. What is iterative design?
Iterative testing is more than just tweaking
an “almost final” product
58. Is this being iterative?
• Stepwise process:
– Starting set of survey questions expert review
cognitive testing program website
usability testing.
• Few rounds with large numbers of
participants, conducted over 1-3 week period
• Findings presented in a detailed report
prepared 2-4 weeks after testing
59. Why is that approach frequently used?
• An afterthought: was not originally included
in the budget or study design.
• Cheaper: Probably perceived that way, but not
necessarily
• Large numbers: belief that you have to test
with enough people to find problems
• No one ever suggested differently
60. Do less testing but do it earlier
• Start as early as possible
• Testing should be integrated into the
programming schedule, not conducted after
• Test in stages as web survey is being
developed
• More rounds, fewer people
61. Reasons for More Rounds, Fewer Users
• Identify more issues: 2 rounds of 5 users will likely
identify more issues than 1 round of 10 users
– Diminishing returns from more users in each round
– Can be hard for users to see past the big glaring problems
to other more subtle problems
– Allows you to test solution
• Good balance between testing resources and
revision resources
• Quicker to summarize results and revise testing
62. Smaller Rounds Support Collaboration
• Include stakeholders in testing
– Have programmers, clients, decision-makers observe
testing live or remotely
– Direct observation is more exciting than reading a
report
• Collaborative process
– Conduct tests in the morning, meet to discuss over a
long lunch, recommendations for changes ready in the
afternoon
– Report can then summarize findings
and changes instead of findings and
recommendations
63. Nielsen suggests that after 5 users you
learn 85% of the problems
useit.com Alertbox Mar. 2000 Test With 5 Users
64. Determining the number of users
• Problem seriousness: if encounter serious problems right
away, no point to continue testing until resolved
• More users per round
– User types: if your users are very different, you may need 5
from each group
– Off-site: tests are being done in the field and it would be
inefficient to travel multiple times
– Metrics: need to calculate statistics or metrics such as task
timing, eye-tracking data, etc.
– Goals v. Budget: want to identify >85% of the problems
– Timing: Can only fit so many rounds into the schedule
65. Test until all serious problems
resolved/stop learning anything new
• Test at each stage of development
• Allow for 2-3 rounds at each stage
• If there is no chance of changes,
don’t test
66. RTI International
3c. What to test and when?
What methods are available?
When should each method be used?
67. Products that you can test
• Survey Concept
• Previous version of survey
• “Paper” (non-interactive) prototype of this survey
• Wireframe
• Selected interactive questions
• Early interactive prototype
• Survey prior to pilot test or field test
• Survey prior to main data collection
69. Paper prototyping/Wireframes
• Methods: Simple drawings or illustrations,
Word/Excel/Visio, simple screen shots, website
shell
• Uses: new questions or surveys, redesigns,
evaluating information architecture, visual aspect
of survey, web-centric features
• Benefits: allows for quick-feedback without
spending too much time or money on
programming, can apply results to other aspects
of survey
73. Early Interactive Prototype
• Methods: Test what you have so far
• Uses: long surveys, surveys with different
components, surveys with web-centric
features
• Benefits: can test basic components, layout
and features in advance; test one component
of survey, while programming another
76. Extent of testing you do will vary by
survey
Do Less Testing Do More Testing
Short surveys Long surveys
Existing surveys New surveys
Simple surveys Complex surveys
Surveys that act like
surveys
Surveys that act like
websites
One-time surveys Surveys repeated yearly
Limited time/budget Moderate time/budget
77. What’s realistic?
• Something is EXTREMELY better than nothing.
• Do what you can this time and then plan
ahead next time.
78. RTI International
4. How to conduct Usability Tests
a. Planning and Preparing
b. Writing Tasks and Scenarios
c. Moderating Sessions
d. Analyzing Results
80. The What, Why, Who, How, Where
What Determine what to test
Who Determine number and type of participants
Recruit and schedule participants
Where Determine test location and equipment
Why Identify testing focus and concerns
Determine the data/measures to collect
How Develop scenarios, tasks, and probes
81. A month before the test date
• Decide on what you’re testing
• Decide on the participants:
– who you want to recruit
– how many
– How you will find them.
• Plan the test date
– Find a date when your stakeholders can observe
– Decide on your location
82. What: Test whatever you have got
• Recap
– You don’t need a fully working survey
– You can test:
• Paper prototype
• Wireframe
• Lists of questions
• Some sections
• Full survey with defects in it or bits missing
83. Who: how to find your participants
• Craigslist, flyers, newspaper ads
– Pros: quick, easy, cheap
– Cons: yields younger, higher educated users
• Participant databases/recruiting orgs
– Pros: quick and easy, pay per user recruited
– Cons: can lead to “professional respondents”
• Other sources: word of mouth, sample lists,
clubs and societies, snowball recruiting
84. Who: some recruiting tips
• Decide whether to recruit “floaters”
(no-shows and cancellations)
• Get talking to your participants early:
– Ask about specific behaviors relevant to your test
e.g. Internet, use of mobile
– Talk about what they’ll do and build rapport
– Get an email address and a contact number
• Schedule sessions about 3 weeks ahead
• Remind them the day before
85. Where: testing in the users’ location is
harder but gives richer data
Your location User’s location
Pros •Use your organization’s
equipment (one-way
mirror, recording software)
•Controlled setting with
no/few interruptions
•Simulates real user
experience
•Users have access to info
•Easier to schedule/
accommodate users
Cons •Not true to real life
•More burden to user –
more no shows and
cancelations
•Using your computer not
the user’s computer
•Need portable equipment
or do without
•Interviewer travel -
increased cost to researcher
•Safety matters
•Harder to schedule
observers
86.
87. Consider screen-sharing for observers
• Fosters collaboration
– Can accommodate observers from any location
– Facilitate discussions in conference setting
• Improved schedule
– Stakeholders get information immediately
– No waiting for recorded videos or report
• Cheaper
– Inexpensive compared to travel costs
89. Consider screen-recording for notes
• Helps with note-taking
– Reduces need to take notes or have a note-taker
during interview
– Can take more nuanced notes afterwards if you
can start and stop the video
• Helps after the interview
– Useful during debriefing to replay parts of video
– Accommodates observers who could not make it
to the actual session
90. Screen Recording Software Options
Price Software Comments
Free: $0 Camstudio,
Hypercam
Ok, but very basic
Midlevel: $200-$300 Screencam
Camtasia
Work fine if you only want
to record and play back
Professional: $1,100 Morae Professional usability
software for logging and
analyzing usability issues
Includes screen-sharing
software
91. Your testing plan
• Your date will be….
• Your location will be…
• You’ll be testing…
• With these participants….
• Who you’ll recruit this way….
91
92. Three weeks before the test date
• Get started on recruitment
• Organize your incentives
• Identify your focus/concerns
• Plan your measurements
93. Why: Identify testing focus/concerns
• General focus: can they complete the survey?
– More specific concern:
we are worried about the definitions
• More specific:
are hover-overs an effective way of providing
definitions?
– More specific: Do participants know definitions are
available?
– More specific: How easily do users understand what’s
hover-overable?
– More specific: How helpful/unhelpful are the definitions?
94. More examples of specific concerns
• Can participants use the sliders correctly?
• Do participants enjoy using the sliders or would they prefer to
answer differently?
• How well do users understand the survey instructions?
• Do users scroll to see the entire question before answering?
• Do participants know what to do on each screen?
• Can participants navigate through the survey correctly?
• How easily do participants find the information they need to
answer the questions?
95. Measurements to collect
• The actual answers they put in!
• Quantitative metadata
– Performance data: based actions/behaviors
– Preference data: pre/post questionnaires, ratings
on tasks
• Qualitative metadata
– Comments made by participant
– Responses to open-ended probing
– Non-verbal cues
96. Measurements to collect
• Examples of performance measures
– Success rate and/or speed for tasks
– Requests for help/assistance
– Number and types of errors that occurred (incorrect
selections, menu choices)
– Count of features used (help menu, hover-over definitions,
calculate button)
• Examples of preference measures
– Do you prefer A or B? Why?
– How or easy or difficult was it to do … Very easy, easy…
97. Your testing plan
• The incentive will be….
• Our focus/concerns are…
• We’ll measure….
97
98. One week before the test date
• Develop your test materials
• Organize roles in the test:
– Meet and greet
– Observer co-ordinator
– Test facilitator
• Do a practice run
• Arrange any refreshments
– “Get the good pizza”
99. Prepare your materials
• Develop consent forms, screeners
• Instructions/directions for participants
• Prepare written tasks/scenarios (index cards)
• Pretest/posttest questionnaires
100. Your testing plan
• The materials to prepare will be…
• I will do my practice run this way…
100
101. The day before the test date
• Send out reminders:
– Phone or email to respondents
– Email to stakeholders
• Equipment/Facility
– Check the computers and software (remote sharing, video
recording), keyboard, mouse
– Make sure the room you’ll use is tidy
– Make sure your meet/greet person
has the final list of participants’ names
– Incentives are available
103. Scenarios, Tasks, Probes
• Scenario – a “what if”; a situation you ask the
participant to put themselves in order to test
the instrument
• Task – something you want the participant to
accomplish using your instrument
• Probe – questions asked of the user to elicit
additional information and feedback
104. For some products, you need a task
• These are things that you want the user to do:
– “Please fill out this survey as you would at home”
• You may need specific tasks to match your test
focus and concerns
105. A scenario brings the data together
into a coherent story
• Keep scenarios short and simple
• Avoid extremely hypothetical scenarios or
scenarios that would be difficult to envision
• Use the participant’s words, not researchers
• May need to prepare fake data to answer
questions (e.g., SSN, phone number)
106. Don’t confuse participants with
too many scenarios
• Whittle lists of tasks/scenarios to manageable
number
• Prepare tasks to give to participants (index
cards are useful)
• Tasks should flow in order of the survey
• Okay to change tasks between rounds
107. Example 1 – No task/scenario
• B&B asks
different
questions for
teachers vs
other users
• Recruited some
teachers and
asked them to
complete
survey
108. Example 2
• Concern: Do users notice the checkbox to indicate
that a unit does not have any students?
• Task : Complete all survey questions for the
Entomology department
• Scenario: The Entomology department has one
postdoc and no graduate students. See attached
profile for the postdoc.
109.
110. Example 2
• Focus: Participants found it difficult to login to
the previous version. Will the new instructions
(using X’s instead of 9’s) solve the problem?
• Scenario: You received the ACS survey in the
mail but would prefer to complete the survey
online.
• Task: Log on and complete the survey on the
web.
111. Example 3
• Focus: Find out whether users can add and
delete units
• Scenario: State University just added a new
department for biochemistry. There will be 10
incoming PhD students.
• Task: Update the departments offered at your
school, by including biochemistry.
115. When you are running the test,
you need to look after your participant
• You must be a
“flight attendant”
– Welcome the participant
– Check that the participant
is feeling comfortable
and relaxed
– Explain what the participant has to do
– Look after the participant’s welfare and safety
From Carolyn Snyder, 2003 “Paper Prototyping”
115
116. When you are running the test,
you need to be objective
• You must be a “scientist”
– Be prepared for surprises
– Be balanced in your viewpoint
– Make sure you do everything
you planned to do
– Report accurately,
even if it’s uncomfortable
Based on Carolyn Snyder, 2003 “Paper Prototyping”
116
117. When you are running the test, you
need to think about what is happening
• You must be a
“sports commentator”
– Analyze what is happening
– Take notes for your reports
– Pay attention to what
the participant actually does
– Make sure your observers are
receiving the right information
Based on Carolyn Snyder, 2003 “Paper Prototyping”
117
118. “Think aloud” = getting the
respondent to be the commentator
• Ask participants to tell you what they are
thinking as they complete your survey
– Explain “thinking aloud” at the start
– Get the participant to try an example
– Remind them periodically (What are you thinking?
What did you think of X?)
• Snags:
– Thinking aloud is not natural for some people
– Others will start well, then forget
119. Users may need help with thinking aloud
• “What are you thinking?
• “What are you doing?”
• “What are you looking at?”
• “What were you expecting to happen?”
• “What do you think will happen?”
• “What are you trying to do?”
• “Tell me more about that.”
120. Plan your response…
• User is silent
• User asks you “is this right?”
• User asks you for help
• User blames himself/herself for problem, “You must
think I’m an idiot.”
121. Plan your response…
• User is silent
– Be patient. Then if necessary, ask “What are you thinking?”
• User asks you “is this right?”
– “Does it seem right to you?”
• User asks you for help
– “What would you do if I wasn’t here?”
• User blames himself/herself
– “Everything you’ve done has made complete sense to me.”
122. Moderating Tips
• Avoid yes/no questions, people tend to be acquiescent
– Bad: “Is that link helpful?”
– Good: “How helpful or unhelpful was the link?”
• Ask unbiased questions
– Bad: “Are you looking at the X link?”
– Good: “What are you looking at?”
• Be quiet and wait
– Bad: Impatiently asking “what’s happening?”
– Good: Count to 20 before jumping in. Or to 30.
123. When you hear yourself asking a
leading question, balance it
“So you think
that’s difficult
then?”
Leading
question
“...or was it
easy?”
Balanced
question
123
125. Don’t cherry-pick problems
• If you are writing notes then
write down everything
– If you only write bad things,
the participant will notice
• Provide praise/feedback for every task,
successful or unsuccessful
• The phrase “Thanks, that’s interesting/That’s
helpful” is encouraging and neutral
127. Exercise: Prepare tasks and scenarios
• Choose a survey (let us know if you need one
of the class examples)
• Take 10 minutes to:
– Write-out 2-3 of the most important tasks you
need respondents to do
– Choose one to work on
– Write a scenario for this task
• We will debrief as a class
128. Exercise: Practice Test
• Pair up with someone who has a laptop
• Take turns as moderator/participant
• 10 minutes each
• We can help if you have questions
• We will debrief as a class
130. Making Sense of It All
1. Collect all of your data together?
2. Understanding what it means?
3. What can/should we do about it?
-Barnum (2011)
131. Collect All of Your Data Together
• Quantitative data
– The actual data collected
by the instrument
– Metadata (e.g., pretest, ratings)
– Paradata (e.g., task timing and coding)
• Qualitative comments
– Interviewer notes
– Observer notes
133. The Steve Krug method:
focus on the most serious problems
• Run your usability test
• Have a meeting with the key stakeholders
• Decide on whatever is the most important
problem
– You can add one or two extra ones if they are really,
really important
• Go away and fix the most serious problem(s)
• Ignore everything else
• Test again and repeat
133
134. Determining the most serious problems
should be easy…
• Frequency of the problem (5 out of 5 users)
• How likely are others to have this problem?
• What’s the impact on the survey (e.g., causes
break-offs, inaccurate data)
• How much of the survey does it affect (e.g.,
local vs global finding)?
135. Determining what and how to fix
problems is harder…
• Group debrief after the test to discuss
• Set priorities
– Most serious problems (ignore “nice to haves”)
– Problems that are easy to fix (e.g., typos, wording)
• How long will it take to fix?
• Will fixing it cause other potential problems?
• Recommendations should be specific/doable
within timeframe and budget
136. The traditional method:
make use of all of your findings
• Run your usability test
• List everything that you found
• Group all the findings in a way that works for you:
– by topic
– by area of the survey
– by person who can fix the problem
– by anything else that you consider appropriate
• Write a report with recommendations
• Work on the recommendations
• Run another usability test and start again
136
137. Spreadsheets can help group findings
Participant Type Task Code Comments
1234 New user Add a new unit L - Liked Feature
Liked the mouse over feature, but
asked if there was a link to open a
new window
1234 New user Add a new unit S - Suggestion
Make the pop-up text stay open
longer
1234 New user Add a new unit C - Comment
Worried that they have been
reporting the wrong thing by
excluding business fields.
1234 New user Add a new unit N-Navigation
Was not sure which page to go to
do add a unit. Clicked through
several incorrect pages before
finding the right page.
1234 New user Add a new unit E- Error
Chose "edit" in table instead of
"add" button
139. With 5 users, each one really matters
• Are there outliers in small studies?
– How representative is each user?
– Are others likely to have this problem?
• Caveats for reporting data with few users
– Report numbers (4 out of 5) rather than
percentages
– Report with numbers rather than words (most,
usually, almost all)
140. What will you use for your study?
• Krug method?
• Traditional method?
• Something in between?
142. Usability testing is fun and easy
• Participants are (nearly always) helpful and
interesting
• It’s easy to get useful insights
• Use each test as an opportunity:
– Think about what went well; do more of it
– Think about what you could do better; learn for
next time
143. Focus on findings that improve quality
• When usability testing a survey, focus on:
– Improving data quality
– Reducing respondent burden
144. Recommended reading
Krug method:
“Rocket Surgery Made Easy:
The Do-It-Yourself Guide to
Finding and Fixing Usability
Problems” Steve Krug
Traditional method:
“Usability Testing Essentials:
Ready, set… Test!”
Carol Barnum
(foreword by Steve Krug)
ere’s an example of early interactive prototyping. For this study, we are planning on moving to a new survey platform this year.A challenge with this survey is that we work directly with physicians advisers who are leaders in the field. Naturally it’s hard to get a group experts to fully agree on anything so we usually have very little time to actually test the usability of the survey once the questionnaire wording is finalized.If you look at the left-hand navigation window though, you’ll see that there are about 10 sections to this survey. While the content of each section is different, the type of questions asked are similar across each section (radio buttons, text entry, etc.). Instead of waiting until we have the final version of the questions for each section, we are going to test one section of the survey with a few users and get feedback about the site overall that we can then modify and use for all questions. We’re testing the content of the questions via other means, so we’re mainly just interested in the usability. For example what do people think of the images, the request PDF button, the fact that they have to scroll, the navigation links, etc. We could get a lot of valuable feedback while the rest of the survey is still being developed. This is a great way to maintain your schedule, but improve your site without a lot of extra costs.