Download to read offline
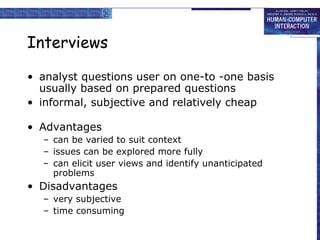
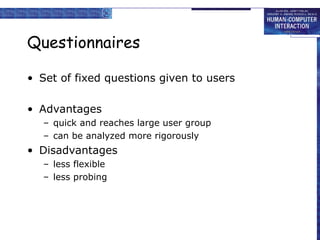
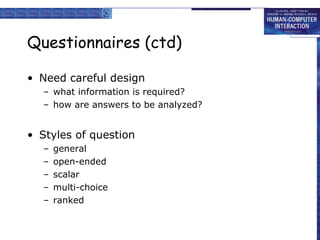

This document discusses various techniques for evaluating user interfaces and systems, including cognitive walkthroughs, heuristic evaluation, review-based evaluation, laboratory and field studies, experimental evaluation, interviews, questionnaires, eye tracking, and physiological measurements. The goals of evaluation are to assess system functionality, the effect of the interface on users, and identify specific problems. Evaluation should be considered at all stages of the design life cycle.