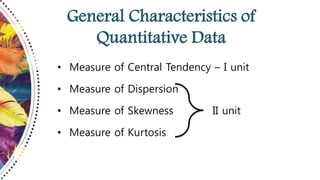
EVERYDAY IS A CHOICE.
LET’S CHOOSE TO BE
HAPPY
Presented By
Ms. A. DALLY MARIA EVANGELINE
ASSISTANT PROFESSOR
DEPARTMENT OF MATHEMATICS
BON SECOURS COLLEGE FOR WOMEN
THANJAVUR, TAMIL NADU 06
MATHEMATICAL
STATISTICS I
OBJECTIVE
To learn basic concepts of statistics
To learn the basic ideas of statistical data
Statistics
• Numerical statement of facts in any department
• Classified facts representing the conditions of the
people in a state….. Specially those facts which can
be stated in number or in tables of numbers
Statistics
• Branch of scientific methods which deals with the
data obtained by counting or measuring the
properties of population of natural phenomenon
• Deals with the method of collecting, classifying,
presenting comparing and interpreting numerical da
ta collected to throw some light on any sphere of
inquiry
Importance and Scope
• Statistics and planning
• Statistics and mathematics
• Statistics and economics
• Statistics and biology
Statistical data
• Data are individual pieces of factual information
recorded and used for the purpose of analysis
• Raw information from which statistics are created
• Statistics deals with collection, analysis and inter -
pretation of numerical data
Types of data
• Primary Data – first hand data gathered by the
researcher himself
• Secondary Data – data collected by someone else
earlier – data already available in library, internet
• Grouped and ungrouped data
Data collection methods
• Interviews
• Surveys
• Questionnaires
• Observations
Frequency Distribution
Representation of data as above is called frequency distribution
Frequency distribution
• Prepare the frequency distribution table for the
given set of scores:
39, 16, 30, 37, 53, 15, 16, 60, 58, 26, 28, 19, 20,
12, 14, 24, 59, 21, 57, 38, 25, 36, 24, 15, 25, 41,
52, 45, 60, 63, 18, 26, 43, 36, 18, 27, 59, 63, 46,
42, 48, 35, 64, 24.
Frequency Distribution
Class interval Frequency
10-20 9
20-30 12
30-40 8
40-50 7
50-60 6
60-70 5
Graphical Representation of Data
General Characteristics of
Quantitative Data
• Measure of Central Tendency – I unit
• Measure of Dispersion
• Measure of Skewness
• Measure of Kurtosis
II unit
Averages or Measure of
Central Tendency
• Arithmetic Mean
• Median
• Mode
• Geometric Mean
• Harmonic Mean

Mathematical statistics i

  • 1.
    EVERYDAY IS ACHOICE. LET’S CHOOSE TO BE HAPPY
  • 2.
    Presented By Ms. A.DALLY MARIA EVANGELINE ASSISTANT PROFESSOR DEPARTMENT OF MATHEMATICS BON SECOURS COLLEGE FOR WOMEN THANJAVUR, TAMIL NADU 06 MATHEMATICAL STATISTICS I
  • 3.
  • 4.
    To learn basicconcepts of statistics To learn the basic ideas of statistical data
  • 5.
    Statistics • Numerical statementof facts in any department • Classified facts representing the conditions of the people in a state….. Specially those facts which can be stated in number or in tables of numbers
  • 6.
    Statistics • Branch ofscientific methods which deals with the data obtained by counting or measuring the properties of population of natural phenomenon • Deals with the method of collecting, classifying, presenting comparing and interpreting numerical da ta collected to throw some light on any sphere of inquiry
  • 7.
    Importance and Scope •Statistics and planning • Statistics and mathematics • Statistics and economics • Statistics and biology
  • 8.
    Statistical data • Dataare individual pieces of factual information recorded and used for the purpose of analysis • Raw information from which statistics are created • Statistics deals with collection, analysis and inter - pretation of numerical data
  • 9.
    Types of data •Primary Data – first hand data gathered by the researcher himself • Secondary Data – data collected by someone else earlier – data already available in library, internet • Grouped and ungrouped data
  • 10.
    Data collection methods •Interviews • Surveys • Questionnaires • Observations
  • 11.
    Frequency Distribution Representation ofdata as above is called frequency distribution
  • 12.
    Frequency distribution • Preparethe frequency distribution table for the given set of scores: 39, 16, 30, 37, 53, 15, 16, 60, 58, 26, 28, 19, 20, 12, 14, 24, 59, 21, 57, 38, 25, 36, 24, 15, 25, 41, 52, 45, 60, 63, 18, 26, 43, 36, 18, 27, 59, 63, 46, 42, 48, 35, 64, 24.
  • 13.
    Frequency Distribution Class intervalFrequency 10-20 9 20-30 12 30-40 8 40-50 7 50-60 6 60-70 5
  • 14.
  • 15.
    General Characteristics of QuantitativeData • Measure of Central Tendency – I unit • Measure of Dispersion • Measure of Skewness • Measure of Kurtosis II unit
  • 16.
    Averages or Measureof Central Tendency • Arithmetic Mean • Median • Mode • Geometric Mean • Harmonic Mean