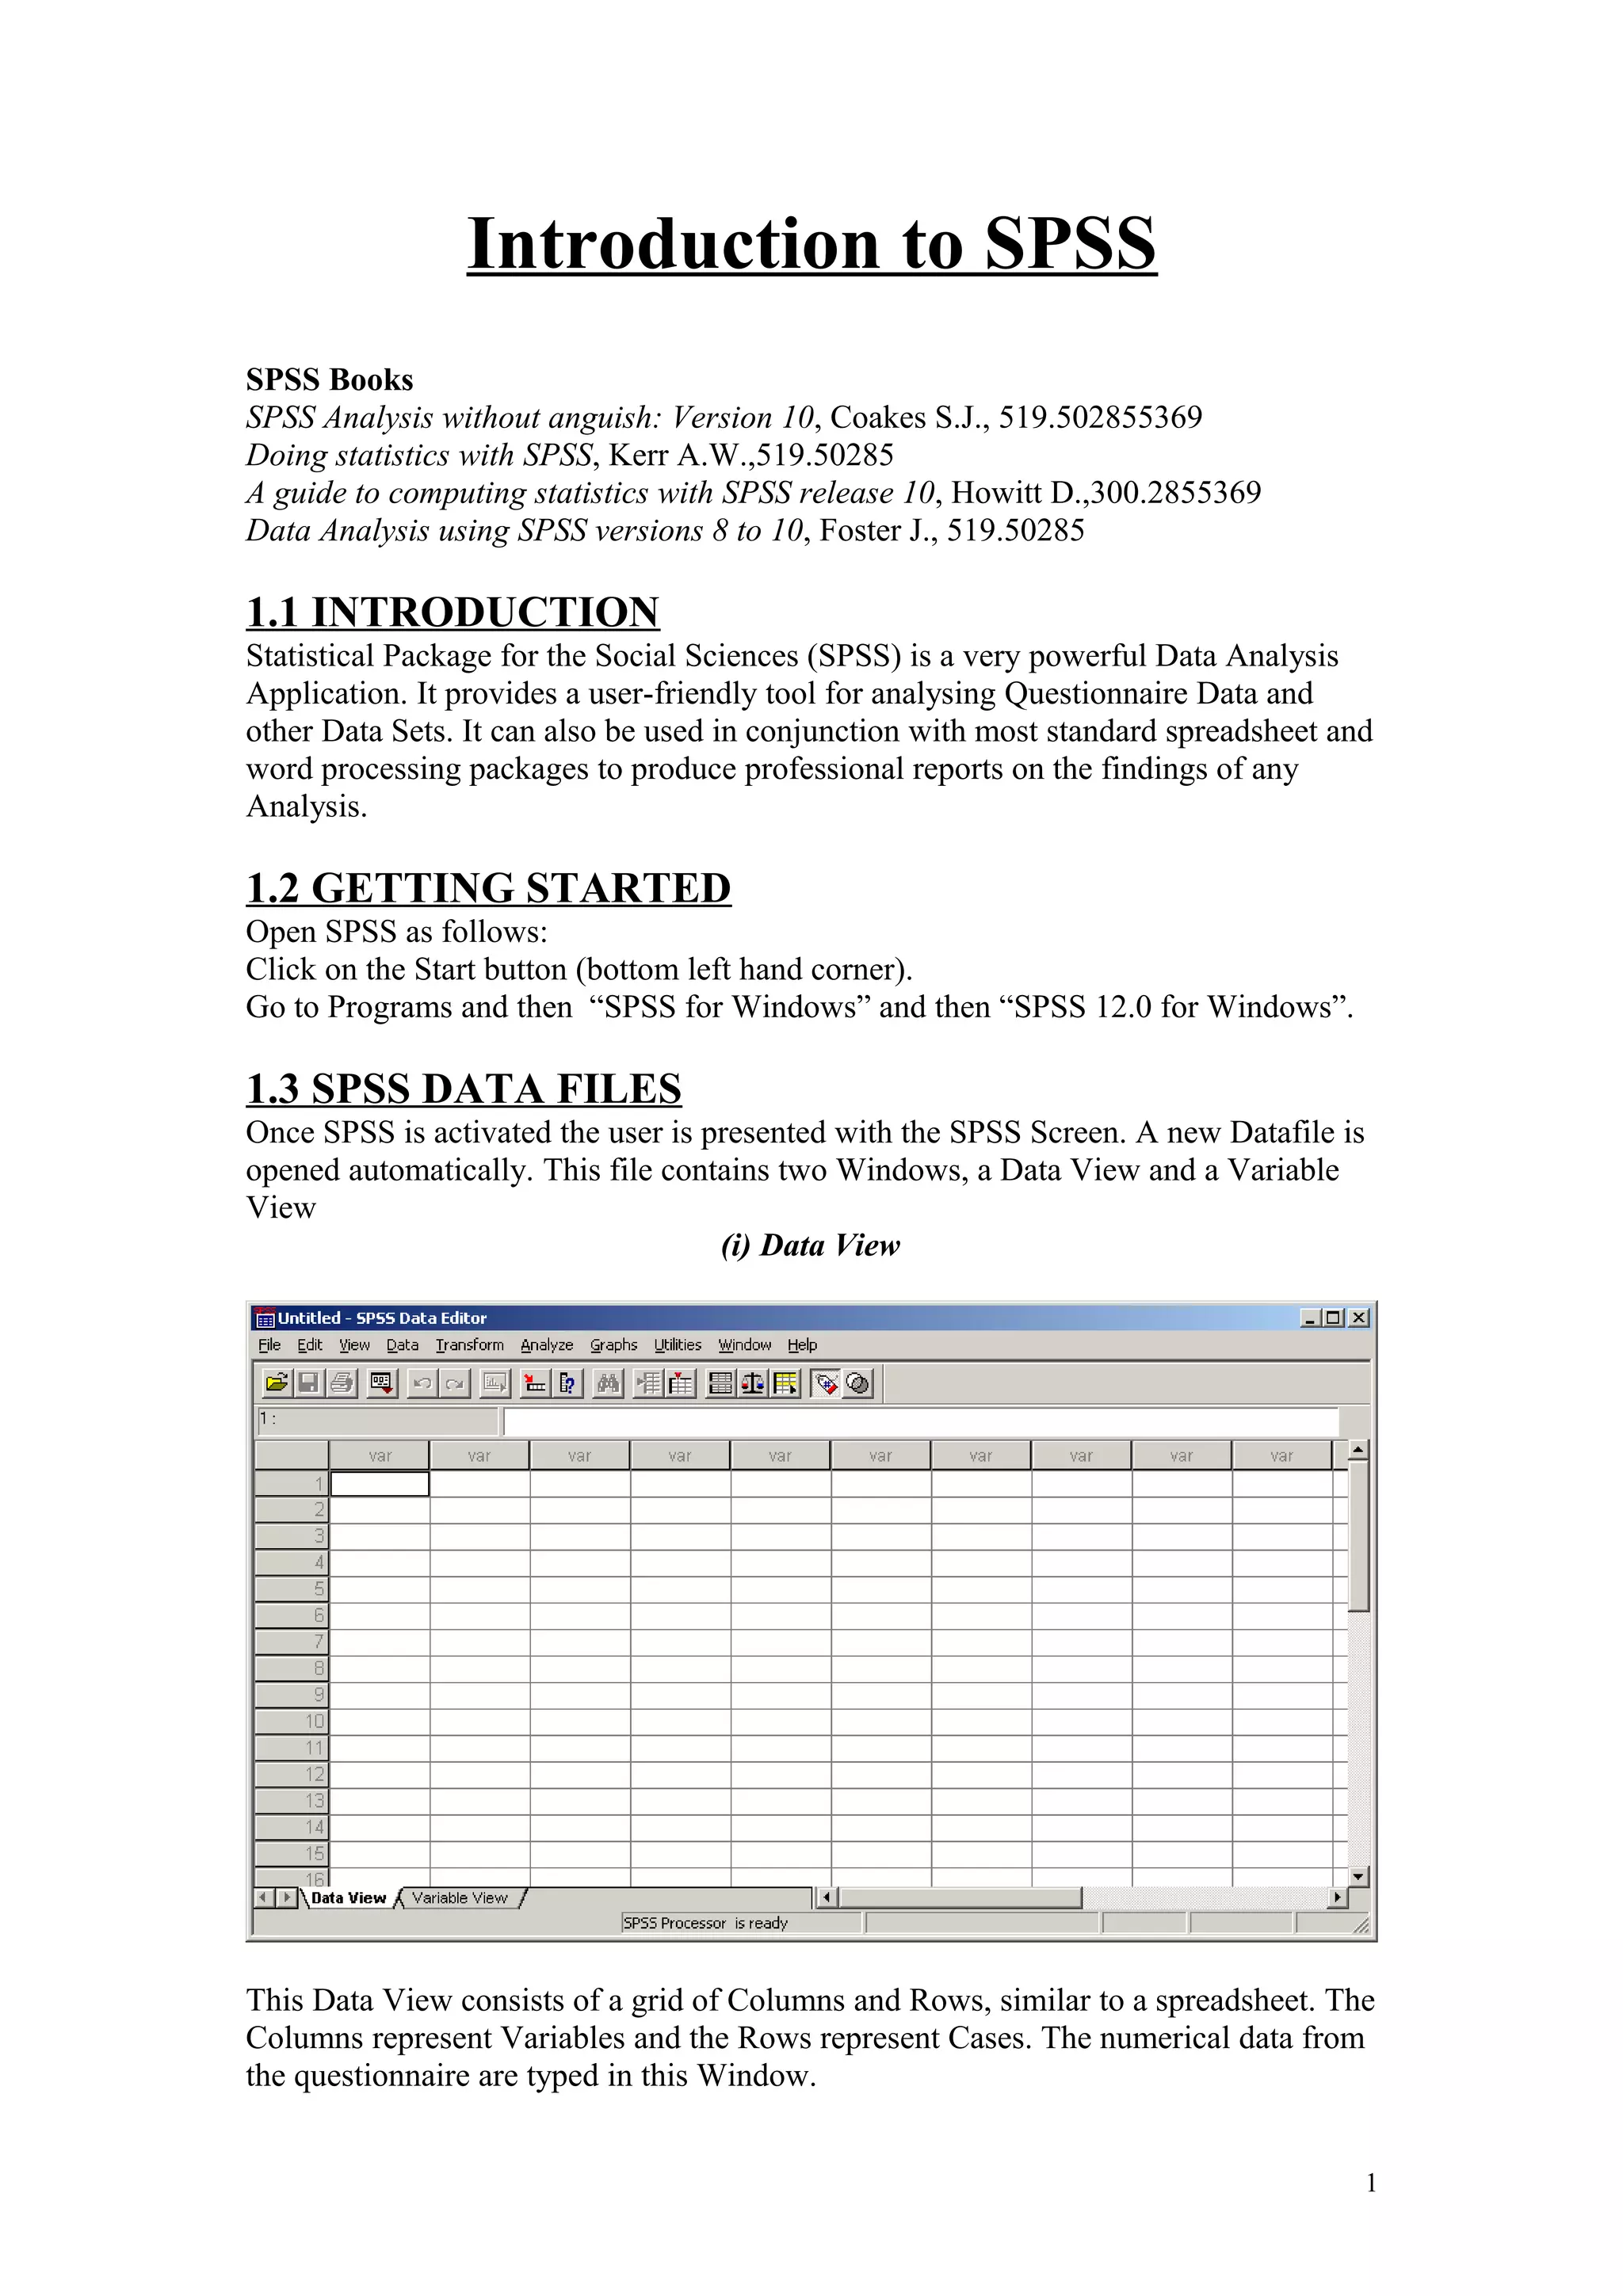
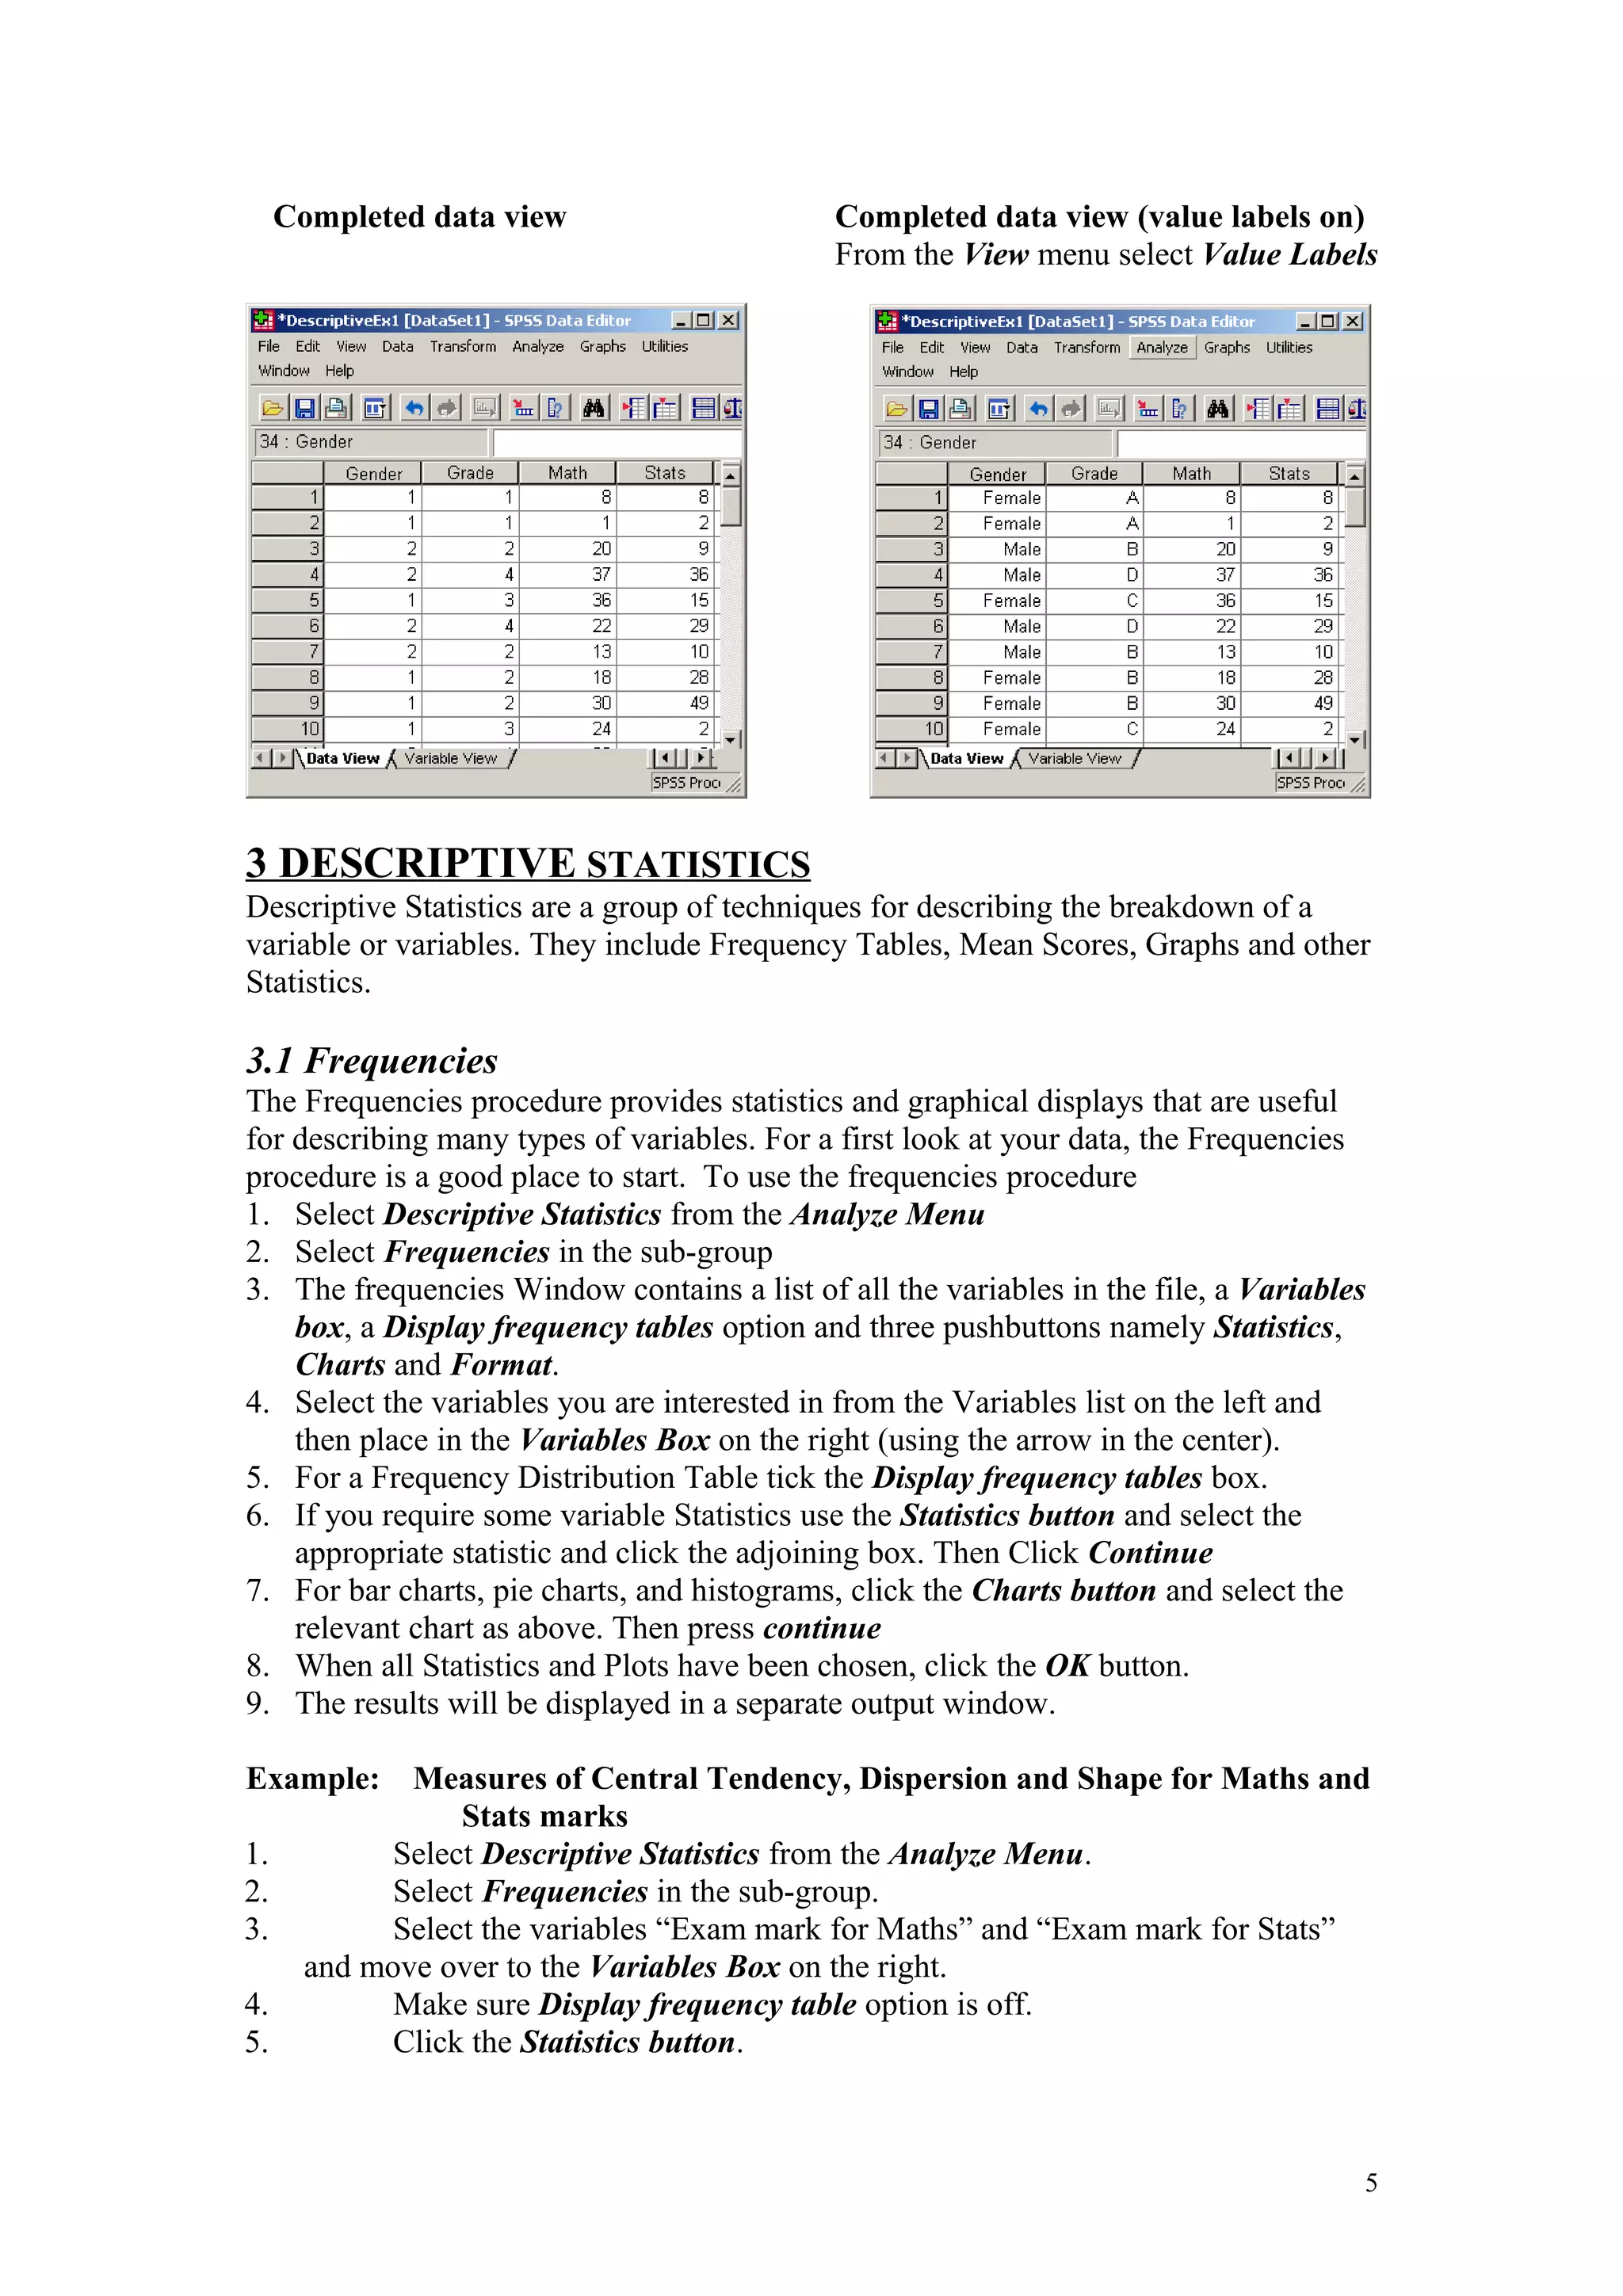
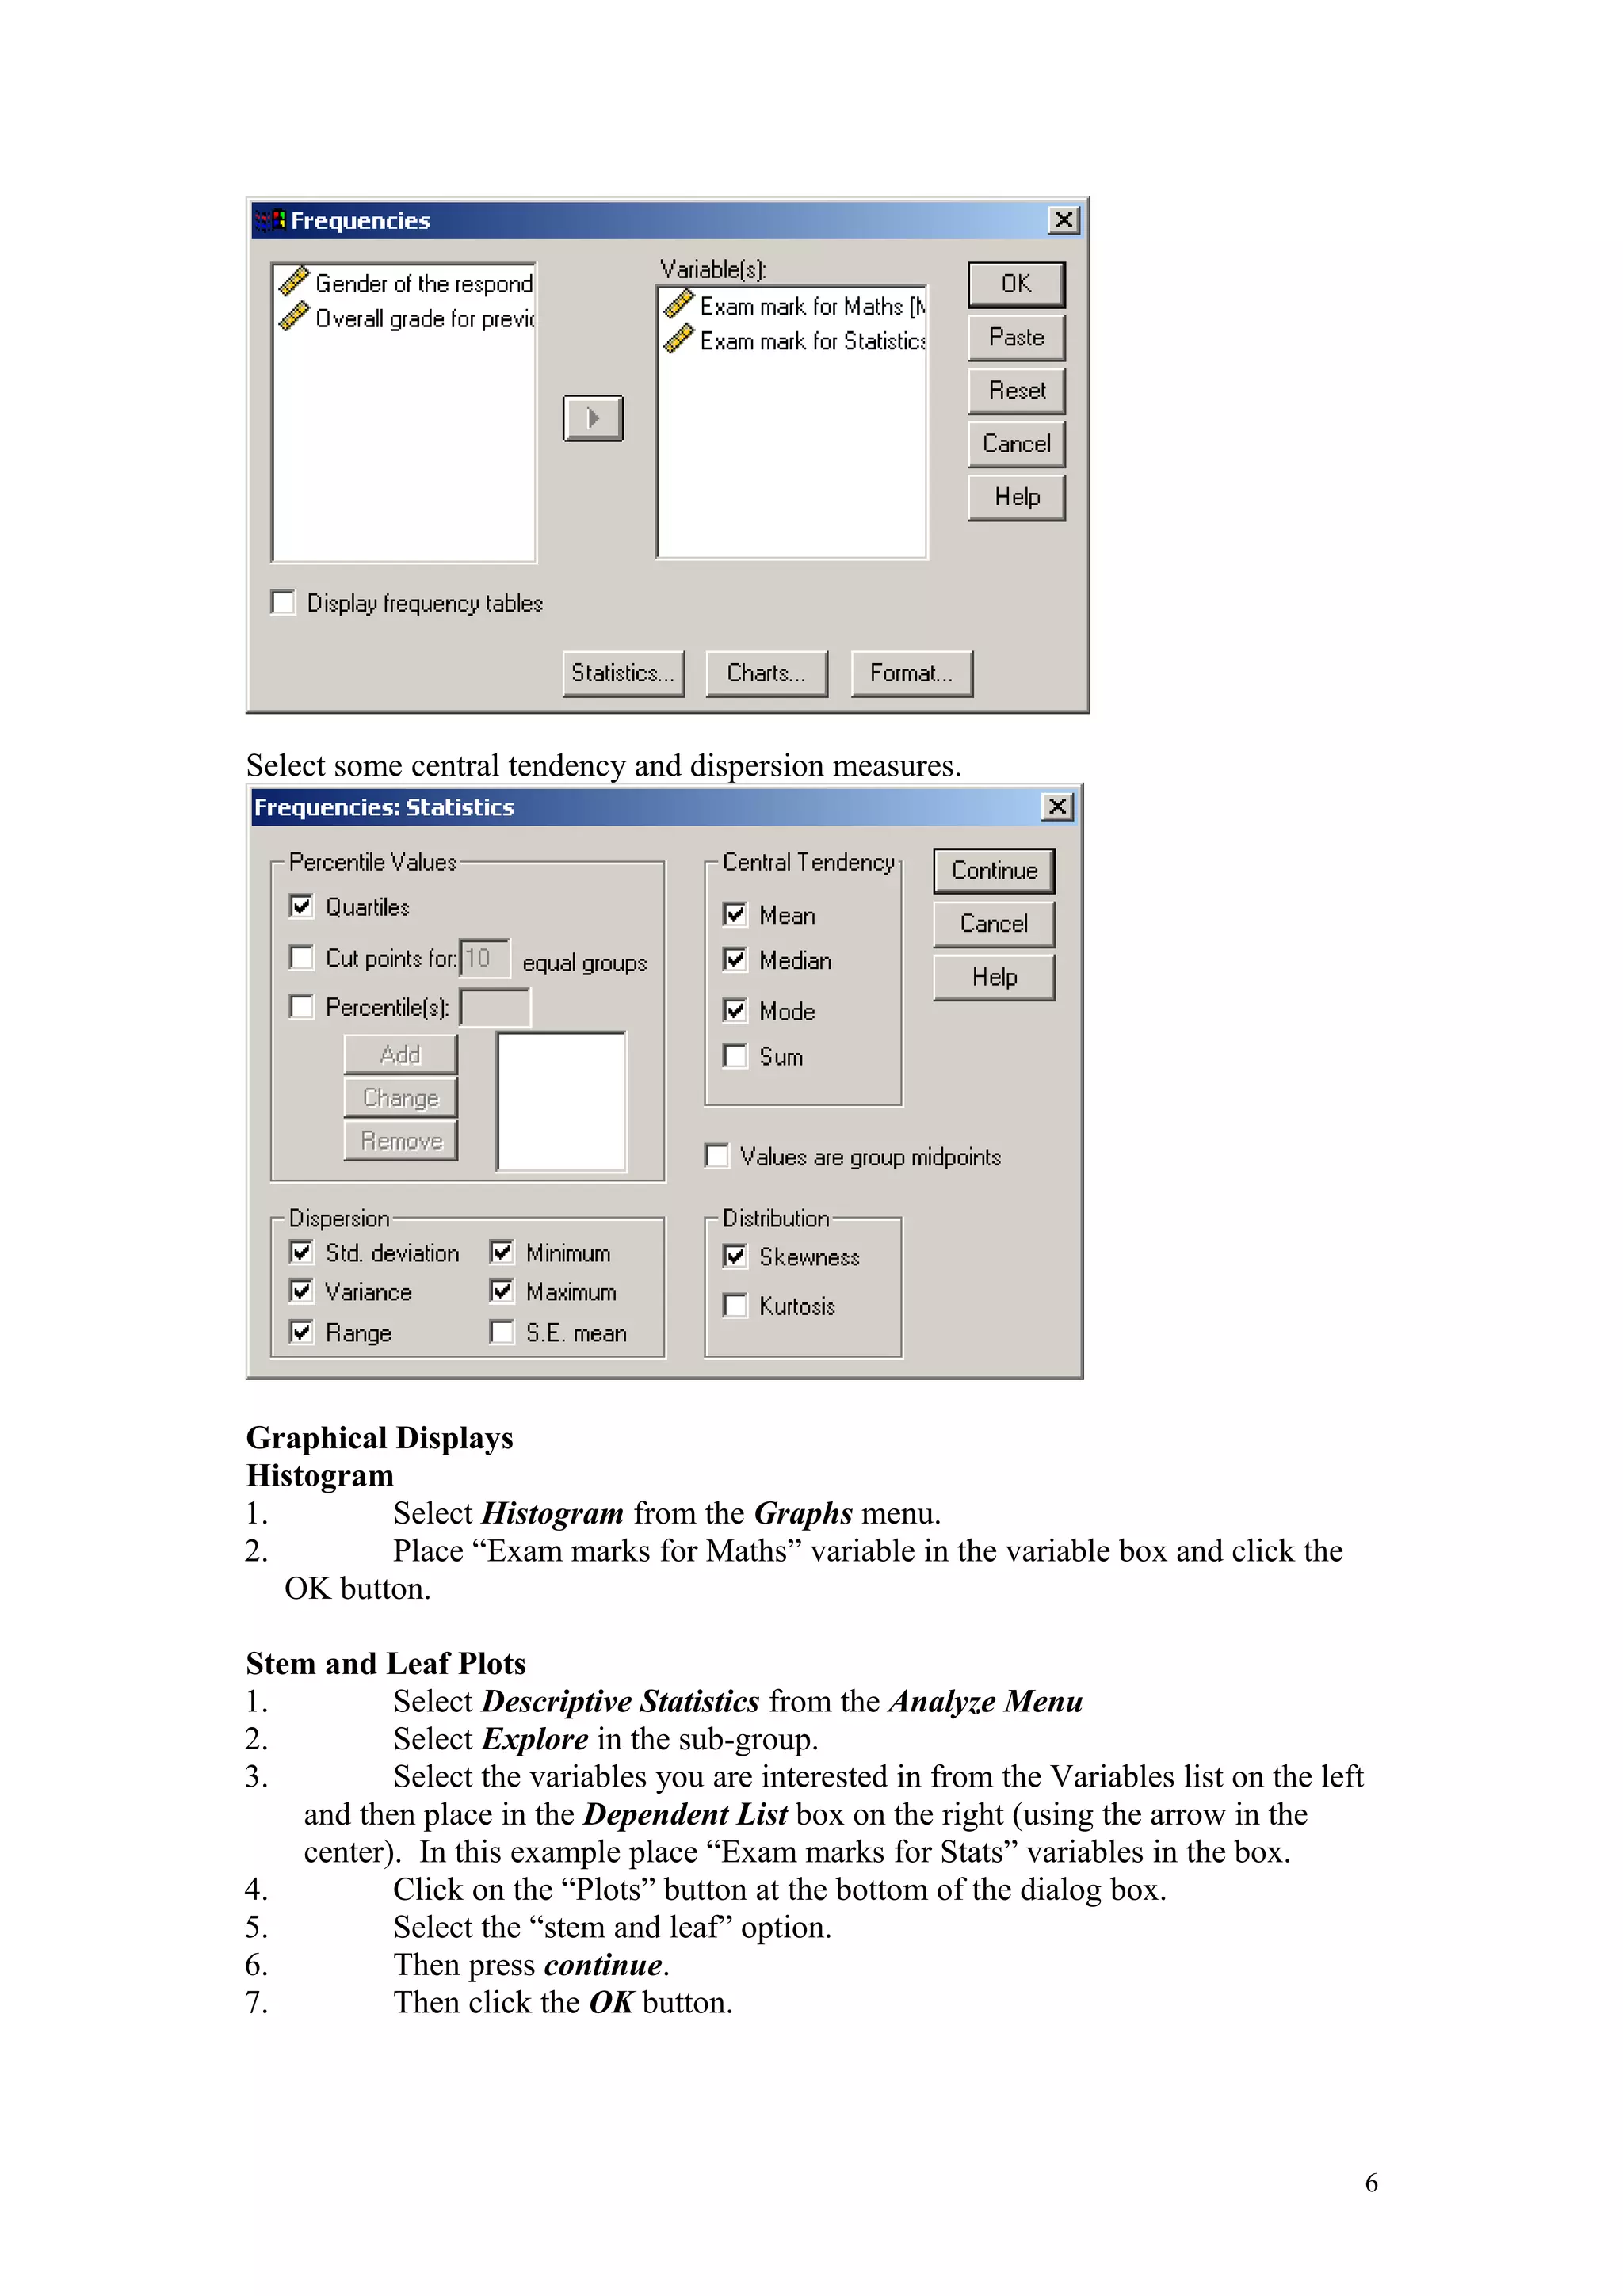
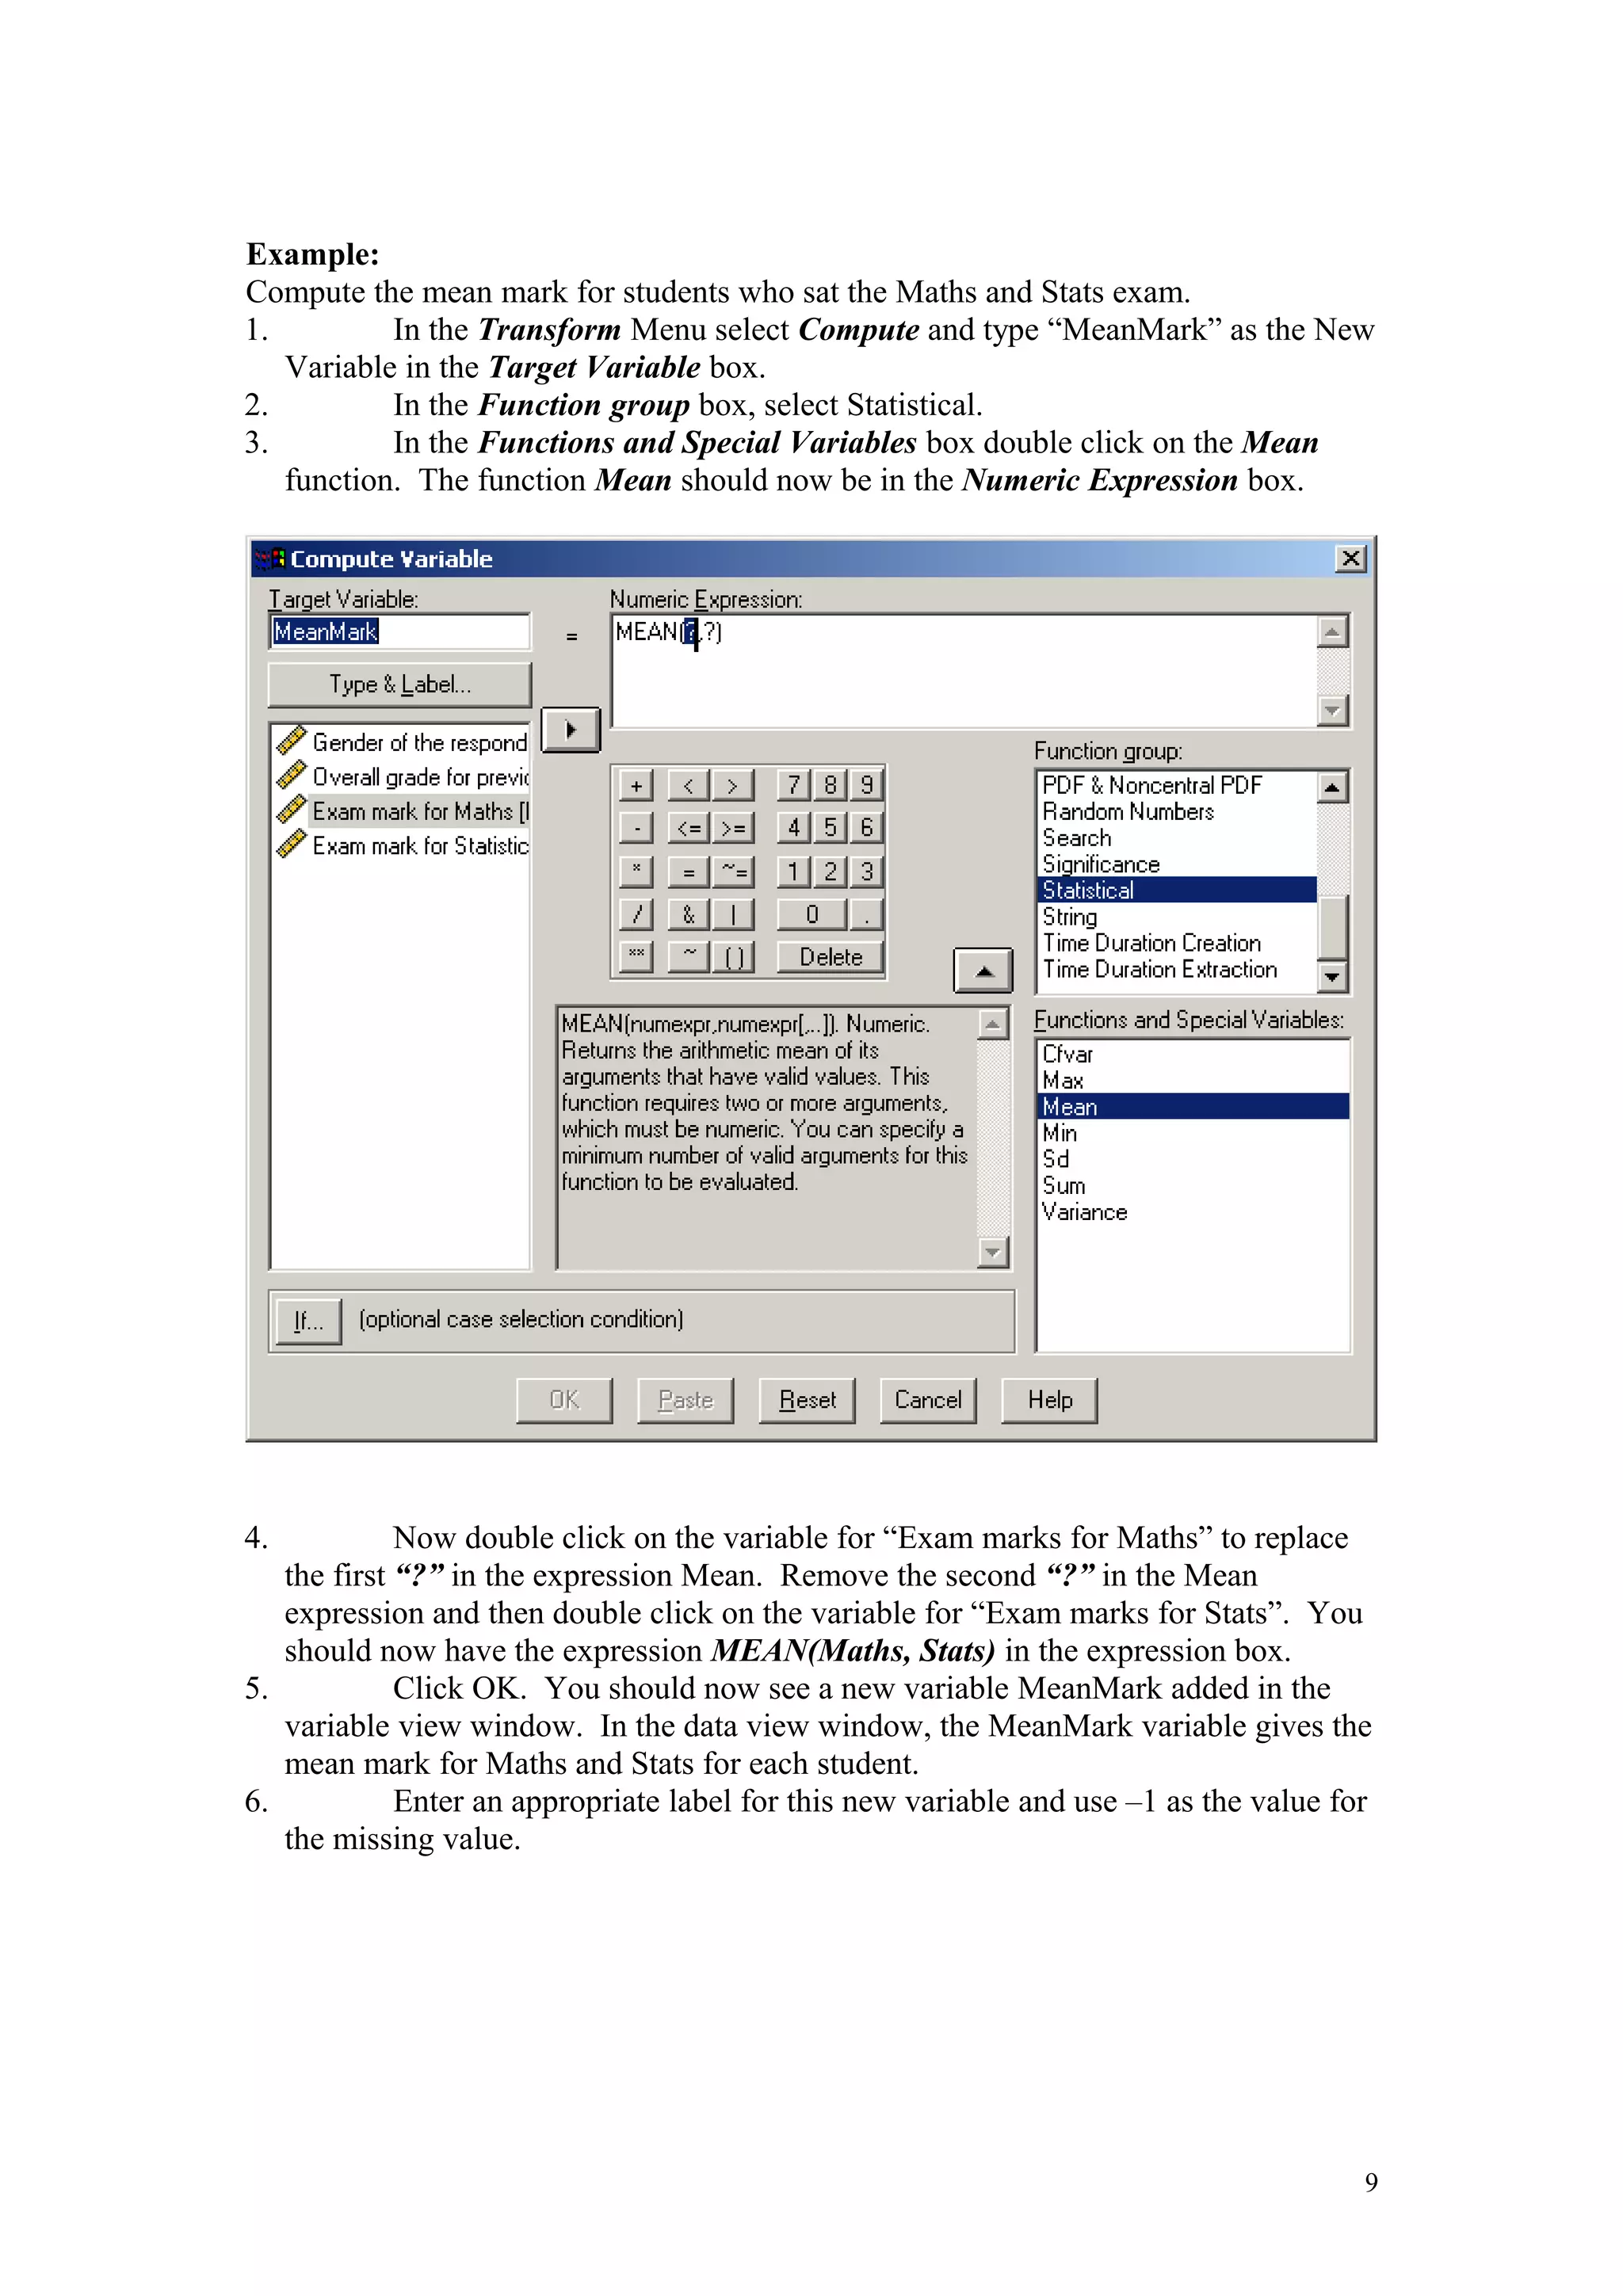
Introduction to SPSS
SPSS Books
SPSS Analysis without anguish: Version 10, Coakes S.J., 519.502855369
Doing statistics with SPSS, Kerr A.W.,519.50285
A guide to computing statistics with SPSS release 10, Howitt D.,300.2855369
Data Analysis using SPSS versions 8 to 10, Foster J., 519.50285
1.1 INTRODUCTION
Statistical Package for the Social Sciences (SPSS) is a very powerful Data Analysis
Application. It provides a user-friendly tool for analysing Questionnaire Data and
other Data Sets. It can also be used in conjunction with most standard spreadsheet and
word processing packages to produce professional reports on the findings of any
Analysis.
1.2 GETTING STARTED
Open SPSS as follows:
Click on the Start button (bottom left hand corner).
Go to Programs and then “SPSS for Windows” and then “SPSS 12.0 for Windows”.
1.3 SPSS DATA FILES
Once SPSS is activated the user is presented with the SPSS Screen. A new Datafile is
opened automatically. This file contains two Windows, a Data View and a Variable
View
(i) Data View
This Data View consists of a grid of Columns and Rows, similar to a spreadsheet. The
Columns represent Variables and the Rows represent Cases. The numerical data from
the questionnaire are typed in this Window.
1
(ii) Variable View
The variable view also contains a grid of rows and columns. In this Window the rows
represent the variables in the analysis and the columns are used to define the
characteristics of each variable. We will discuss this in greater detail in the next
section.
2. CODING DATA
Open the file “SPSSRawData.sav” at
http://www.computing.dcu.ie/~pgunning/CA151Course2007.htm.
When processing most questionnaires it is necessary to code each response to a given
question. For example, in answer to the gender question each reply is assigned a code
Gender Code
Male 1
Female 2
Each answer is assigned a numerical code, to ease computer data entry.
Using the Variable View for coding variables
To code a variable in SPSS we need to enter the Variable View by clicking the
Variable View tab.
1. Variable Name
In the first column enter the variable name. This can take a maximum of 8 characters.
In this example we can use the name “Gender” in the first column of the first row.
Note: The Variable Type, Width and Decimals will be entered automatically.
2
2. Variable Label
Enter a Variable Label in the box provided. The Variable Label provides a more
detailed description of the question than the Variable Name, as it can contain many
more characters. In our example we might enter ‘Gender of Respondent’ as the
Variable Label. If this variable is used in any analysis it is the Variable Label that
appears in the Output. If no Variable Label is entered then the Variable Name is used
in any Output.
3. Variable Values
Value labels are used to define the coding system for the variable. To define a coding
system for a variable, click the grey box in the Value cell.
Type the Value and the corresponding Value Label in the boxes provided (e.g. 1 as
the Value and Male as the Value Label) and then click the ADD button.
Repeat this process until all Values and Value Labels are entered.
4. Missing Values
Invariably when data is collected using self-completed questionnaire forms there will
be several questions left unanswered. This can happen for a variety of reasons,
including simple carelessness, a lack of willingness on the part of the respondent to
supply the desired information or a lack of competence to answer the question. Also a
question may not be relevant to some of the respondents. In SPSS we must enter a
code to represent missing data.
In this example we will enter the value 0 to represent a non-response. To enter a
missing value code, click the grey box in the missing values cell and select discrete
missing values. Enter 0 as the missing value and click OK.
3
All variables on the questionnaire can be coded in this way. It should be noted that
most ratio/interval variables will not need value labels. For example for the variable
“How many time have you been abroad”, there is no need to define value labels,
because the answers will already be numerical values.
Codes for grade
Use –1 as the missing value for Maths and Stats marks Completed variable view
4
Completed data view Completed data view (value labels on)
From the View menu select Value Labels
3 DESCRIPTIVE STATISTICS
Descriptive Statistics are a group of techniques for describing the breakdown of a
variable or variables. They include Frequency Tables, Mean Scores, Graphs and other
Statistics.
3.1 Frequencies
The Frequencies procedure provides statistics and graphical displays that are useful
for describing many types of variables. For a first look at your data, the Frequencies
procedure is a good place to start. To use the frequencies procedure
1. Select Descriptive Statistics from the Analyze Menu
2. Select Frequencies in the sub-group
3. The frequencies Window contains a list of all the variables in the file, a Variables
box, a Display frequency tables option and three pushbuttons namely Statistics,
Charts and Format.
4. Select the variables you are interested in from the Variables list on the left and
then place in the Variables Box on the right (using the arrow in the center).
5. For a Frequency Distribution Table tick the Display frequency tables box.
6. If you require some variable Statistics use the Statistics button and select the
appropriate statistic and click the adjoining box. Then Click Continue
7. For bar charts, pie charts, and histograms, click the Charts button and select the
relevant chart as above. Then press continue
8. When all Statistics and Plots have been chosen, click the OK button.
9. The results will be displayed in a separate output window.
Example: Measures of Central Tendency, Dispersion and Shape for Maths and
Stats marks
1. Select Descriptive Statistics from the Analyze Menu.
2. Select Frequencies in the sub-group.
3. Select the variables “Exam mark for Maths” and “Exam mark for Stats”
and move over to the Variables Box on the right.
4. Make sure Display frequency table option is off.
5. Click the Statistics button.
5
Select some central tendency and dispersion measures.
Graphical Displays
Histogram
1. Select Histogram from the Graphs menu.
2. Place “Exam marks for Maths” variable in the variable box and click the
OK button.
Stem and Leaf Plots
1. Select Descriptive Statistics from the Analyze Menu
2. Select Explore in the sub-group.
3. Select the variables you are interested in from the Variables list on the left
and then place in the Dependent List box on the right (using the arrow in the
center). In this example place “Exam marks for Stats” variables in the box.
4. Click on the “Plots” button at the bottom of the dialog box.
5. Select the “stem and leaf” option.
6. Then press continue.
7. Then click the OK button.
6
Box plots
1. Select Boxplot from the Graphs Menu
2. Select Simple in the sub-group and “Summaries of separate variables” and
then click the “Define” button.
3. Select the variables you are interested in from the Variables list on the left and
then place in the Box Represents box on the right (using the arrow in the center).
In this example place “Exam marks for Maths” and “Exam marks for Stats”
variables in the box.
4. Then Click OK
Frequency Distribution
1. Select Descriptive Statistics from the Analyze Menu
2. Select Frequencies in the sub-group.
3. Select the variable gender and place in the Variables Box.
4. For a Frequency Distribution Table tick the Display frequency
tables box.
5. For bar chart or pie chart click the Charts button and select the
relevant chart as above. Then press continue
6. Then click the OK button.
Bar Charts
1. Select Bar from the Graphs menu.
2. Select a “Simple” bar chart and “Summaries for groups of cases”.
3. Place “gender” in the “category axis” box and press “OK”.
Clustered Bar Charts
1. Select Bar from the Graphs menu.
2. Select a “Clustered” bar chart and “Summaries for groups of cases”.
3. Place the overall grade variable in the “Define clusters by” box and gender
in the “category axis” box and press “OK”.
4. Under Bars Represents select “% of cases”.
5. Click OK.
4. RE-CODING DATA
For analysis purposes it is often desirable to re-code a variable or to calculate a new
variable using a combination of old variables.
4.1 Re- coding
A variable like Grades with values (1 = A, 2 = B, 3 = C, 4 = D, 5 = Fail) can be re-
coded into a new variable with two values, say (1 = Grade C and higher, 2 = Grade D
and less) using the following procedure
1. In the Transform Menu select Recode
2. Select Into Different Variables
3. Select the Input variable (variable to be re-coded) from the Variable list and click
the black arrow. In this example, use the Grade variable.
4. Enter the Name of the New (Output) Variable e.g. GradeCat
5. Enter a Label for the New Variable (Optional).
6. Click the Change button.
7. Click the Old and New Values button.
7
8. Enter the old value of the variable on the left side of the screen and the new value
on the right and click the Add button.
For instance, in the example above a respondent who obtained an
A was coded as 1, a B was coded as 2 and a C was coded as 3 in the old variable,
and will be coded as 1 in the new variable.
Those who obtained a D or failed were coded as 4 and 5 respectively in the old
variable and will be coded as 2 in the new variable.
9. Click Continue
10. Click OK. The new variable should appear at the end of the variable list.
11. Enter an appropriate label for this new variable and code the value labels
appropriately. Use –1 as the value for the missing value.
4.2 Compute
The Compute command allows the user to form a new variable using a mathematical
combination of several variables in the data set. In many surveys a researcher will ask
several questions (Likert Scale) on a particular topic and ask the respondent to rate
their agreement. To gauge the respondents overall view on the topic he can combine
these questions and calculate the average score. To do this or calculate any other
combination of variables use the following procedure.
1. In the Transform Menu select Compute
2. Enter a name of the New Variable (Target Variable)
3. In the Numerical Expression Window enter the formula, using the variable list and
the calculator, for calculating the new variable.
e.g Var1 + Var 2.
Var1 * Var2 (Multiplied)
4. Click OK
There are a large number of mathematical functions available for these calculations.
The new variable will appear at the end of the variable list.
8
Example:
Compute the mean mark for students who sat the Maths and Stats exam.
1. In the Transform Menu select Compute and type “MeanMark” as the New
Variable in the Target Variable box.
2. In the Function group box, select Statistical.
3. In the Functions and Special Variables box double click on the Mean
function. The function Mean should now be in the Numeric Expression box.
4. Now double click on the variable for “Exam marks for Maths” to replace
the first “?” in the expression Mean. Remove the second “?” in the Mean
expression and then double click on the variable for “Exam marks for Stats”. You
should now have the expression MEAN(Maths, Stats) in the expression box.
5. Click OK. You should now see a new variable MeanMark added in the
variable view window. In the data view window, the MeanMark variable gives the
mean mark for Maths and Stats for each student.
6. Enter an appropriate label for this new variable and use –1 as the value for
the missing value.
9

Spss notes

  • 1.
    Introduction to SPSS SPSSBooks SPSS Analysis without anguish: Version 10, Coakes S.J., 519.502855369 Doing statistics with SPSS, Kerr A.W.,519.50285 A guide to computing statistics with SPSS release 10, Howitt D.,300.2855369 Data Analysis using SPSS versions 8 to 10, Foster J., 519.50285 1.1 INTRODUCTION Statistical Package for the Social Sciences (SPSS) is a very powerful Data Analysis Application. It provides a user-friendly tool for analysing Questionnaire Data and other Data Sets. It can also be used in conjunction with most standard spreadsheet and word processing packages to produce professional reports on the findings of any Analysis. 1.2 GETTING STARTED Open SPSS as follows: Click on the Start button (bottom left hand corner). Go to Programs and then “SPSS for Windows” and then “SPSS 12.0 for Windows”. 1.3 SPSS DATA FILES Once SPSS is activated the user is presented with the SPSS Screen. A new Datafile is opened automatically. This file contains two Windows, a Data View and a Variable View (i) Data View This Data View consists of a grid of Columns and Rows, similar to a spreadsheet. The Columns represent Variables and the Rows represent Cases. The numerical data from the questionnaire are typed in this Window. 1
  • 2.
    (ii) Variable View Thevariable view also contains a grid of rows and columns. In this Window the rows represent the variables in the analysis and the columns are used to define the characteristics of each variable. We will discuss this in greater detail in the next section. 2. CODING DATA Open the file “SPSSRawData.sav” at http://www.computing.dcu.ie/~pgunning/CA151Course2007.htm. When processing most questionnaires it is necessary to code each response to a given question. For example, in answer to the gender question each reply is assigned a code Gender Code Male 1 Female 2 Each answer is assigned a numerical code, to ease computer data entry. Using the Variable View for coding variables To code a variable in SPSS we need to enter the Variable View by clicking the Variable View tab. 1. Variable Name In the first column enter the variable name. This can take a maximum of 8 characters. In this example we can use the name “Gender” in the first column of the first row. Note: The Variable Type, Width and Decimals will be entered automatically. 2
  • 3.
    2. Variable Label Entera Variable Label in the box provided. The Variable Label provides a more detailed description of the question than the Variable Name, as it can contain many more characters. In our example we might enter ‘Gender of Respondent’ as the Variable Label. If this variable is used in any analysis it is the Variable Label that appears in the Output. If no Variable Label is entered then the Variable Name is used in any Output. 3. Variable Values Value labels are used to define the coding system for the variable. To define a coding system for a variable, click the grey box in the Value cell. Type the Value and the corresponding Value Label in the boxes provided (e.g. 1 as the Value and Male as the Value Label) and then click the ADD button. Repeat this process until all Values and Value Labels are entered. 4. Missing Values Invariably when data is collected using self-completed questionnaire forms there will be several questions left unanswered. This can happen for a variety of reasons, including simple carelessness, a lack of willingness on the part of the respondent to supply the desired information or a lack of competence to answer the question. Also a question may not be relevant to some of the respondents. In SPSS we must enter a code to represent missing data. In this example we will enter the value 0 to represent a non-response. To enter a missing value code, click the grey box in the missing values cell and select discrete missing values. Enter 0 as the missing value and click OK. 3
  • 4.
    All variables onthe questionnaire can be coded in this way. It should be noted that most ratio/interval variables will not need value labels. For example for the variable “How many time have you been abroad”, there is no need to define value labels, because the answers will already be numerical values. Codes for grade Use –1 as the missing value for Maths and Stats marks Completed variable view 4
  • 5.
    Completed data viewCompleted data view (value labels on) From the View menu select Value Labels 3 DESCRIPTIVE STATISTICS Descriptive Statistics are a group of techniques for describing the breakdown of a variable or variables. They include Frequency Tables, Mean Scores, Graphs and other Statistics. 3.1 Frequencies The Frequencies procedure provides statistics and graphical displays that are useful for describing many types of variables. For a first look at your data, the Frequencies procedure is a good place to start. To use the frequencies procedure 1. Select Descriptive Statistics from the Analyze Menu 2. Select Frequencies in the sub-group 3. The frequencies Window contains a list of all the variables in the file, a Variables box, a Display frequency tables option and three pushbuttons namely Statistics, Charts and Format. 4. Select the variables you are interested in from the Variables list on the left and then place in the Variables Box on the right (using the arrow in the center). 5. For a Frequency Distribution Table tick the Display frequency tables box. 6. If you require some variable Statistics use the Statistics button and select the appropriate statistic and click the adjoining box. Then Click Continue 7. For bar charts, pie charts, and histograms, click the Charts button and select the relevant chart as above. Then press continue 8. When all Statistics and Plots have been chosen, click the OK button. 9. The results will be displayed in a separate output window. Example: Measures of Central Tendency, Dispersion and Shape for Maths and Stats marks 1. Select Descriptive Statistics from the Analyze Menu. 2. Select Frequencies in the sub-group. 3. Select the variables “Exam mark for Maths” and “Exam mark for Stats” and move over to the Variables Box on the right. 4. Make sure Display frequency table option is off. 5. Click the Statistics button. 5
  • 6.
    Select some centraltendency and dispersion measures. Graphical Displays Histogram 1. Select Histogram from the Graphs menu. 2. Place “Exam marks for Maths” variable in the variable box and click the OK button. Stem and Leaf Plots 1. Select Descriptive Statistics from the Analyze Menu 2. Select Explore in the sub-group. 3. Select the variables you are interested in from the Variables list on the left and then place in the Dependent List box on the right (using the arrow in the center). In this example place “Exam marks for Stats” variables in the box. 4. Click on the “Plots” button at the bottom of the dialog box. 5. Select the “stem and leaf” option. 6. Then press continue. 7. Then click the OK button. 6
  • 7.
    Box plots 1. SelectBoxplot from the Graphs Menu 2. Select Simple in the sub-group and “Summaries of separate variables” and then click the “Define” button. 3. Select the variables you are interested in from the Variables list on the left and then place in the Box Represents box on the right (using the arrow in the center). In this example place “Exam marks for Maths” and “Exam marks for Stats” variables in the box. 4. Then Click OK Frequency Distribution 1. Select Descriptive Statistics from the Analyze Menu 2. Select Frequencies in the sub-group. 3. Select the variable gender and place in the Variables Box. 4. For a Frequency Distribution Table tick the Display frequency tables box. 5. For bar chart or pie chart click the Charts button and select the relevant chart as above. Then press continue 6. Then click the OK button. Bar Charts 1. Select Bar from the Graphs menu. 2. Select a “Simple” bar chart and “Summaries for groups of cases”. 3. Place “gender” in the “category axis” box and press “OK”. Clustered Bar Charts 1. Select Bar from the Graphs menu. 2. Select a “Clustered” bar chart and “Summaries for groups of cases”. 3. Place the overall grade variable in the “Define clusters by” box and gender in the “category axis” box and press “OK”. 4. Under Bars Represents select “% of cases”. 5. Click OK. 4. RE-CODING DATA For analysis purposes it is often desirable to re-code a variable or to calculate a new variable using a combination of old variables. 4.1 Re- coding A variable like Grades with values (1 = A, 2 = B, 3 = C, 4 = D, 5 = Fail) can be re- coded into a new variable with two values, say (1 = Grade C and higher, 2 = Grade D and less) using the following procedure 1. In the Transform Menu select Recode 2. Select Into Different Variables 3. Select the Input variable (variable to be re-coded) from the Variable list and click the black arrow. In this example, use the Grade variable. 4. Enter the Name of the New (Output) Variable e.g. GradeCat 5. Enter a Label for the New Variable (Optional). 6. Click the Change button. 7. Click the Old and New Values button. 7
  • 8.
    8. Enter theold value of the variable on the left side of the screen and the new value on the right and click the Add button. For instance, in the example above a respondent who obtained an A was coded as 1, a B was coded as 2 and a C was coded as 3 in the old variable, and will be coded as 1 in the new variable. Those who obtained a D or failed were coded as 4 and 5 respectively in the old variable and will be coded as 2 in the new variable. 9. Click Continue 10. Click OK. The new variable should appear at the end of the variable list. 11. Enter an appropriate label for this new variable and code the value labels appropriately. Use –1 as the value for the missing value. 4.2 Compute The Compute command allows the user to form a new variable using a mathematical combination of several variables in the data set. In many surveys a researcher will ask several questions (Likert Scale) on a particular topic and ask the respondent to rate their agreement. To gauge the respondents overall view on the topic he can combine these questions and calculate the average score. To do this or calculate any other combination of variables use the following procedure. 1. In the Transform Menu select Compute 2. Enter a name of the New Variable (Target Variable) 3. In the Numerical Expression Window enter the formula, using the variable list and the calculator, for calculating the new variable. e.g Var1 + Var 2. Var1 * Var2 (Multiplied) 4. Click OK There are a large number of mathematical functions available for these calculations. The new variable will appear at the end of the variable list. 8
  • 9.
    Example: Compute the meanmark for students who sat the Maths and Stats exam. 1. In the Transform Menu select Compute and type “MeanMark” as the New Variable in the Target Variable box. 2. In the Function group box, select Statistical. 3. In the Functions and Special Variables box double click on the Mean function. The function Mean should now be in the Numeric Expression box. 4. Now double click on the variable for “Exam marks for Maths” to replace the first “?” in the expression Mean. Remove the second “?” in the Mean expression and then double click on the variable for “Exam marks for Stats”. You should now have the expression MEAN(Maths, Stats) in the expression box. 5. Click OK. You should now see a new variable MeanMark added in the variable view window. In the data view window, the MeanMark variable gives the mean mark for Maths and Stats for each student. 6. Enter an appropriate label for this new variable and use –1 as the value for the missing value. 9
  • 10.
    Example: Compute the meanmark for students who sat the Maths and Stats exam. 1. In the Transform Menu select Compute and type “MeanMark” as the New Variable in the Target Variable box. 2. In the Function group box, select Statistical. 3. In the Functions and Special Variables box double click on the Mean function. The function Mean should now be in the Numeric Expression box. 4. Now double click on the variable for “Exam marks for Maths” to replace the first “?” in the expression Mean. Remove the second “?” in the Mean expression and then double click on the variable for “Exam marks for Stats”. You should now have the expression MEAN(Maths, Stats) in the expression box. 5. Click OK. You should now see a new variable MeanMark added in the variable view window. In the data view window, the MeanMark variable gives the mean mark for Maths and Stats for each student. 6. Enter an appropriate label for this new variable and use –1 as the value for the missing value. 9