Downloaded 144 times
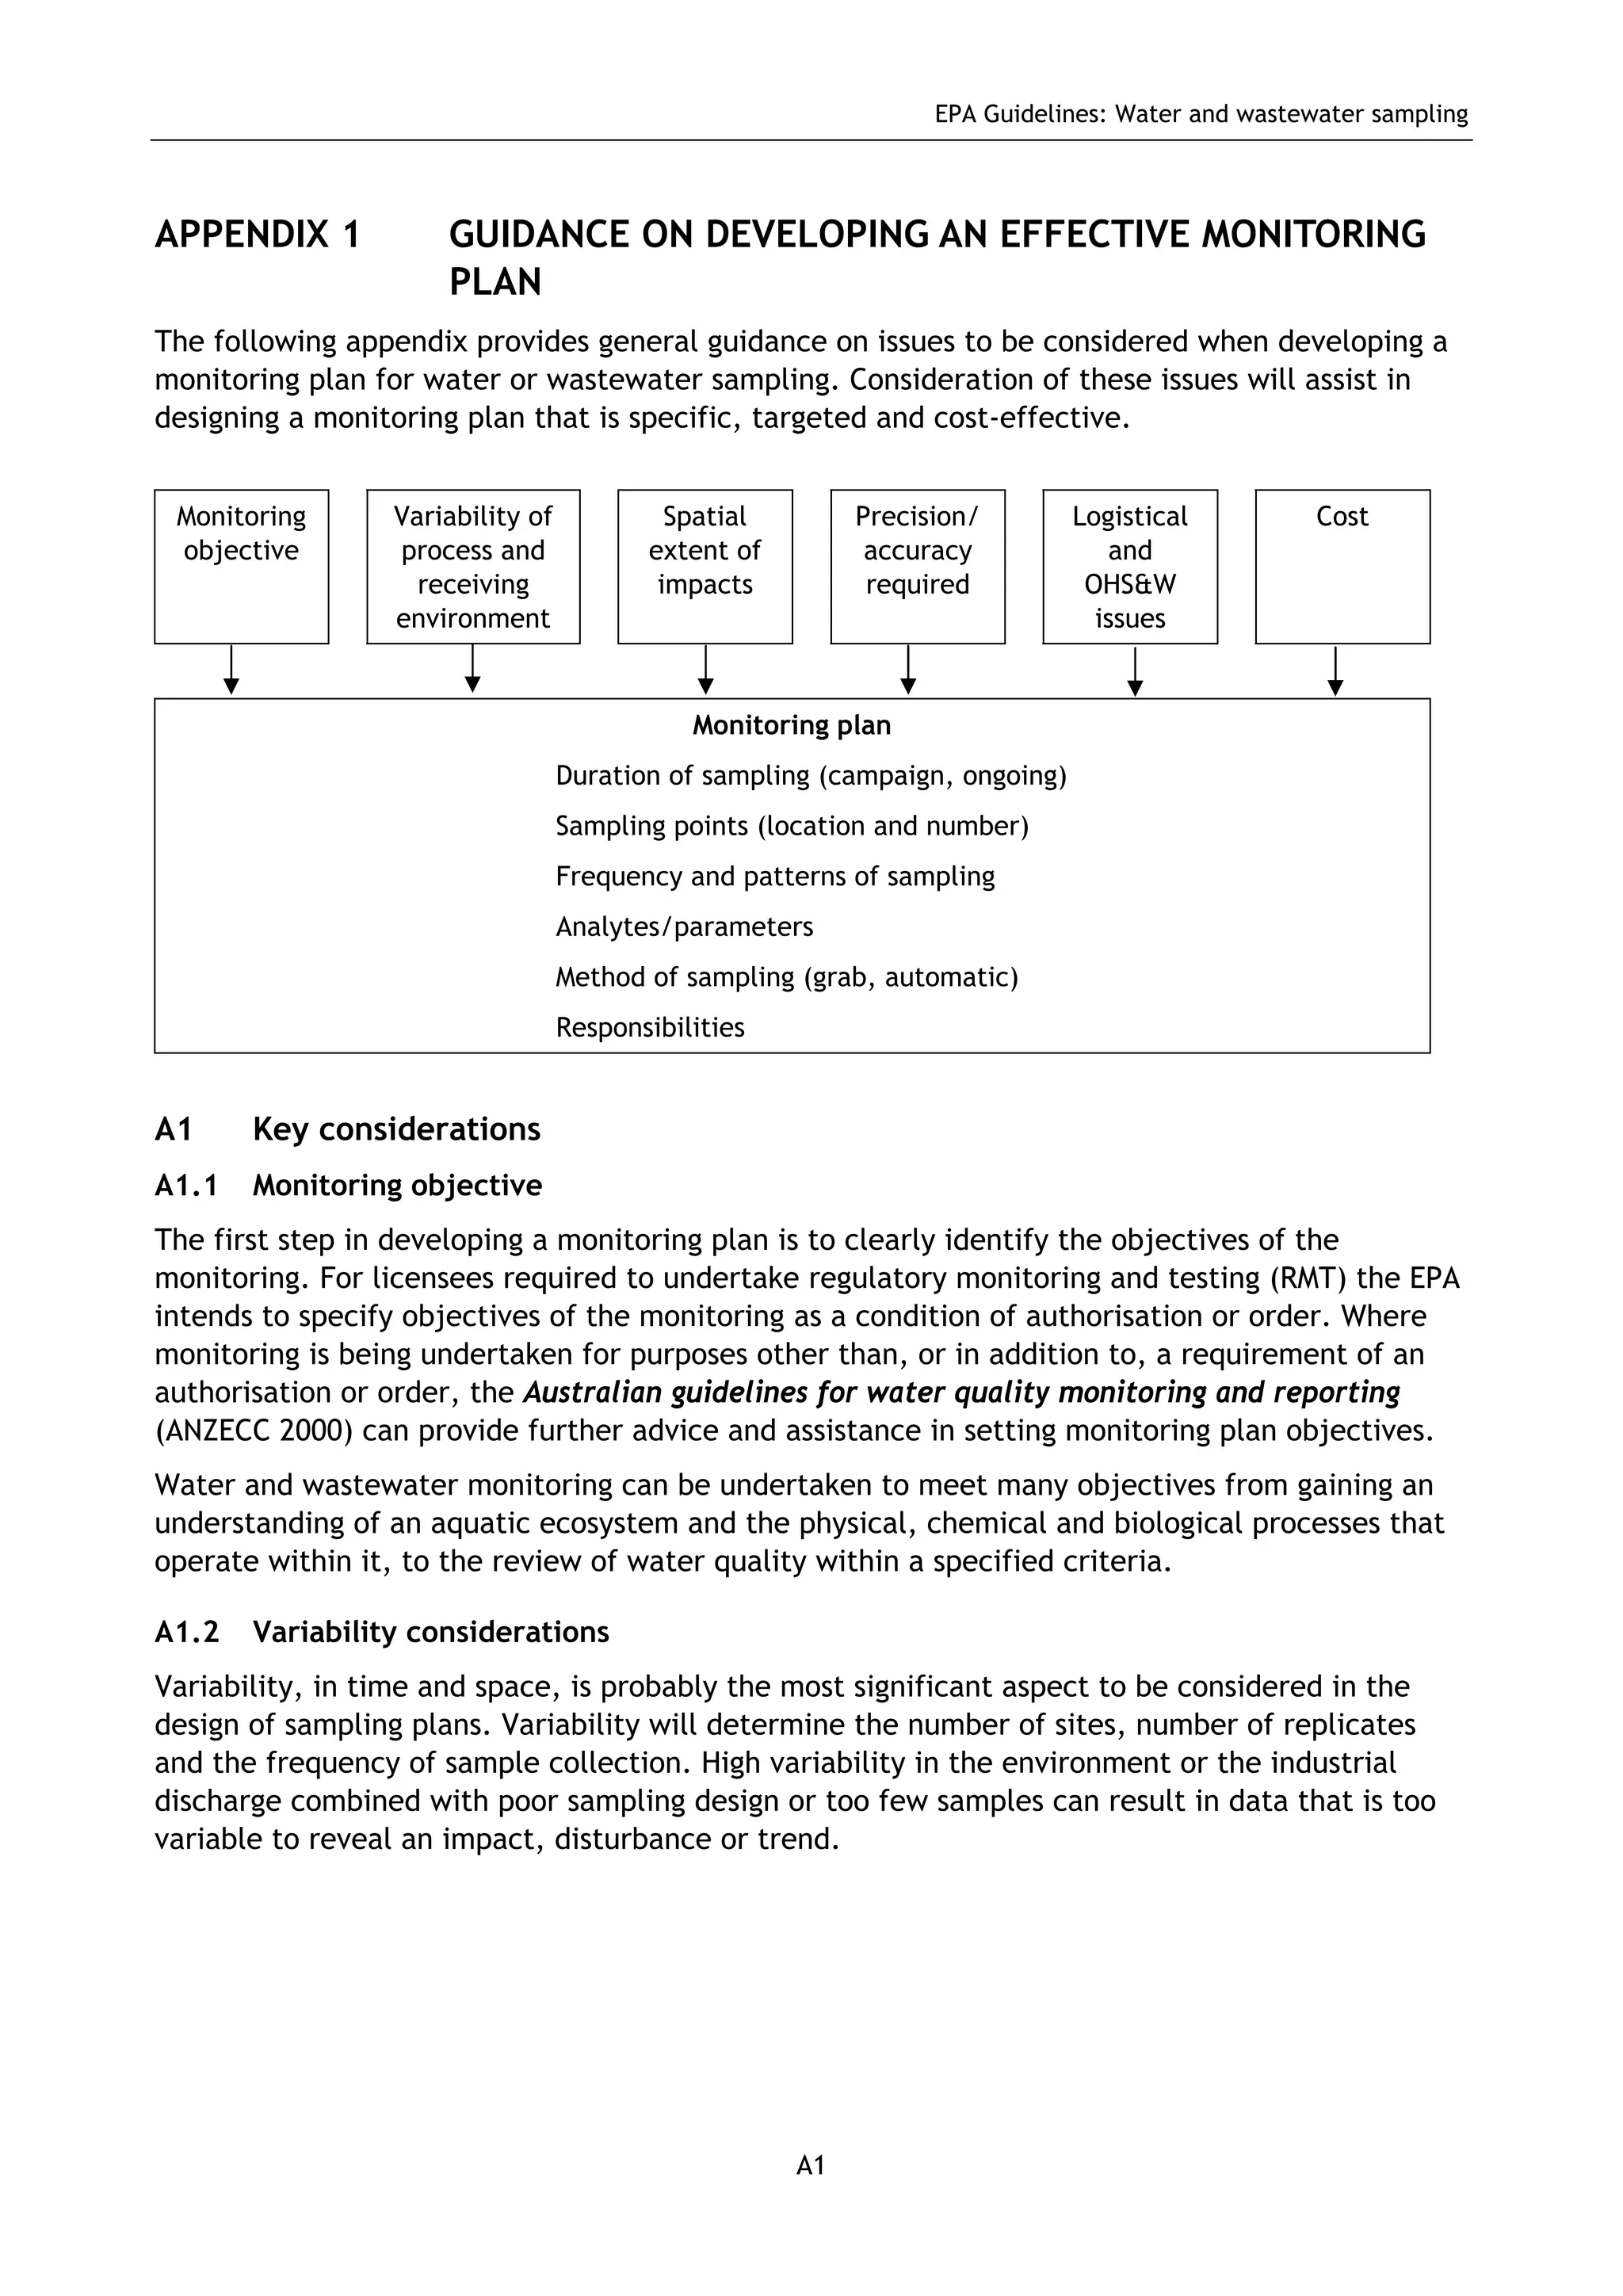

The EPA document provides guidelines for regulatory monitoring and testing of water and wastewater sampling in South Australia. It outlines the steps in developing an effective monitoring plan, preparing for sampling events, procedures for sample collection and field testing, and quality control measures. The document aims to ensure sampling is consistent and provides representative data that can be used to assess compliance with environmental regulations.