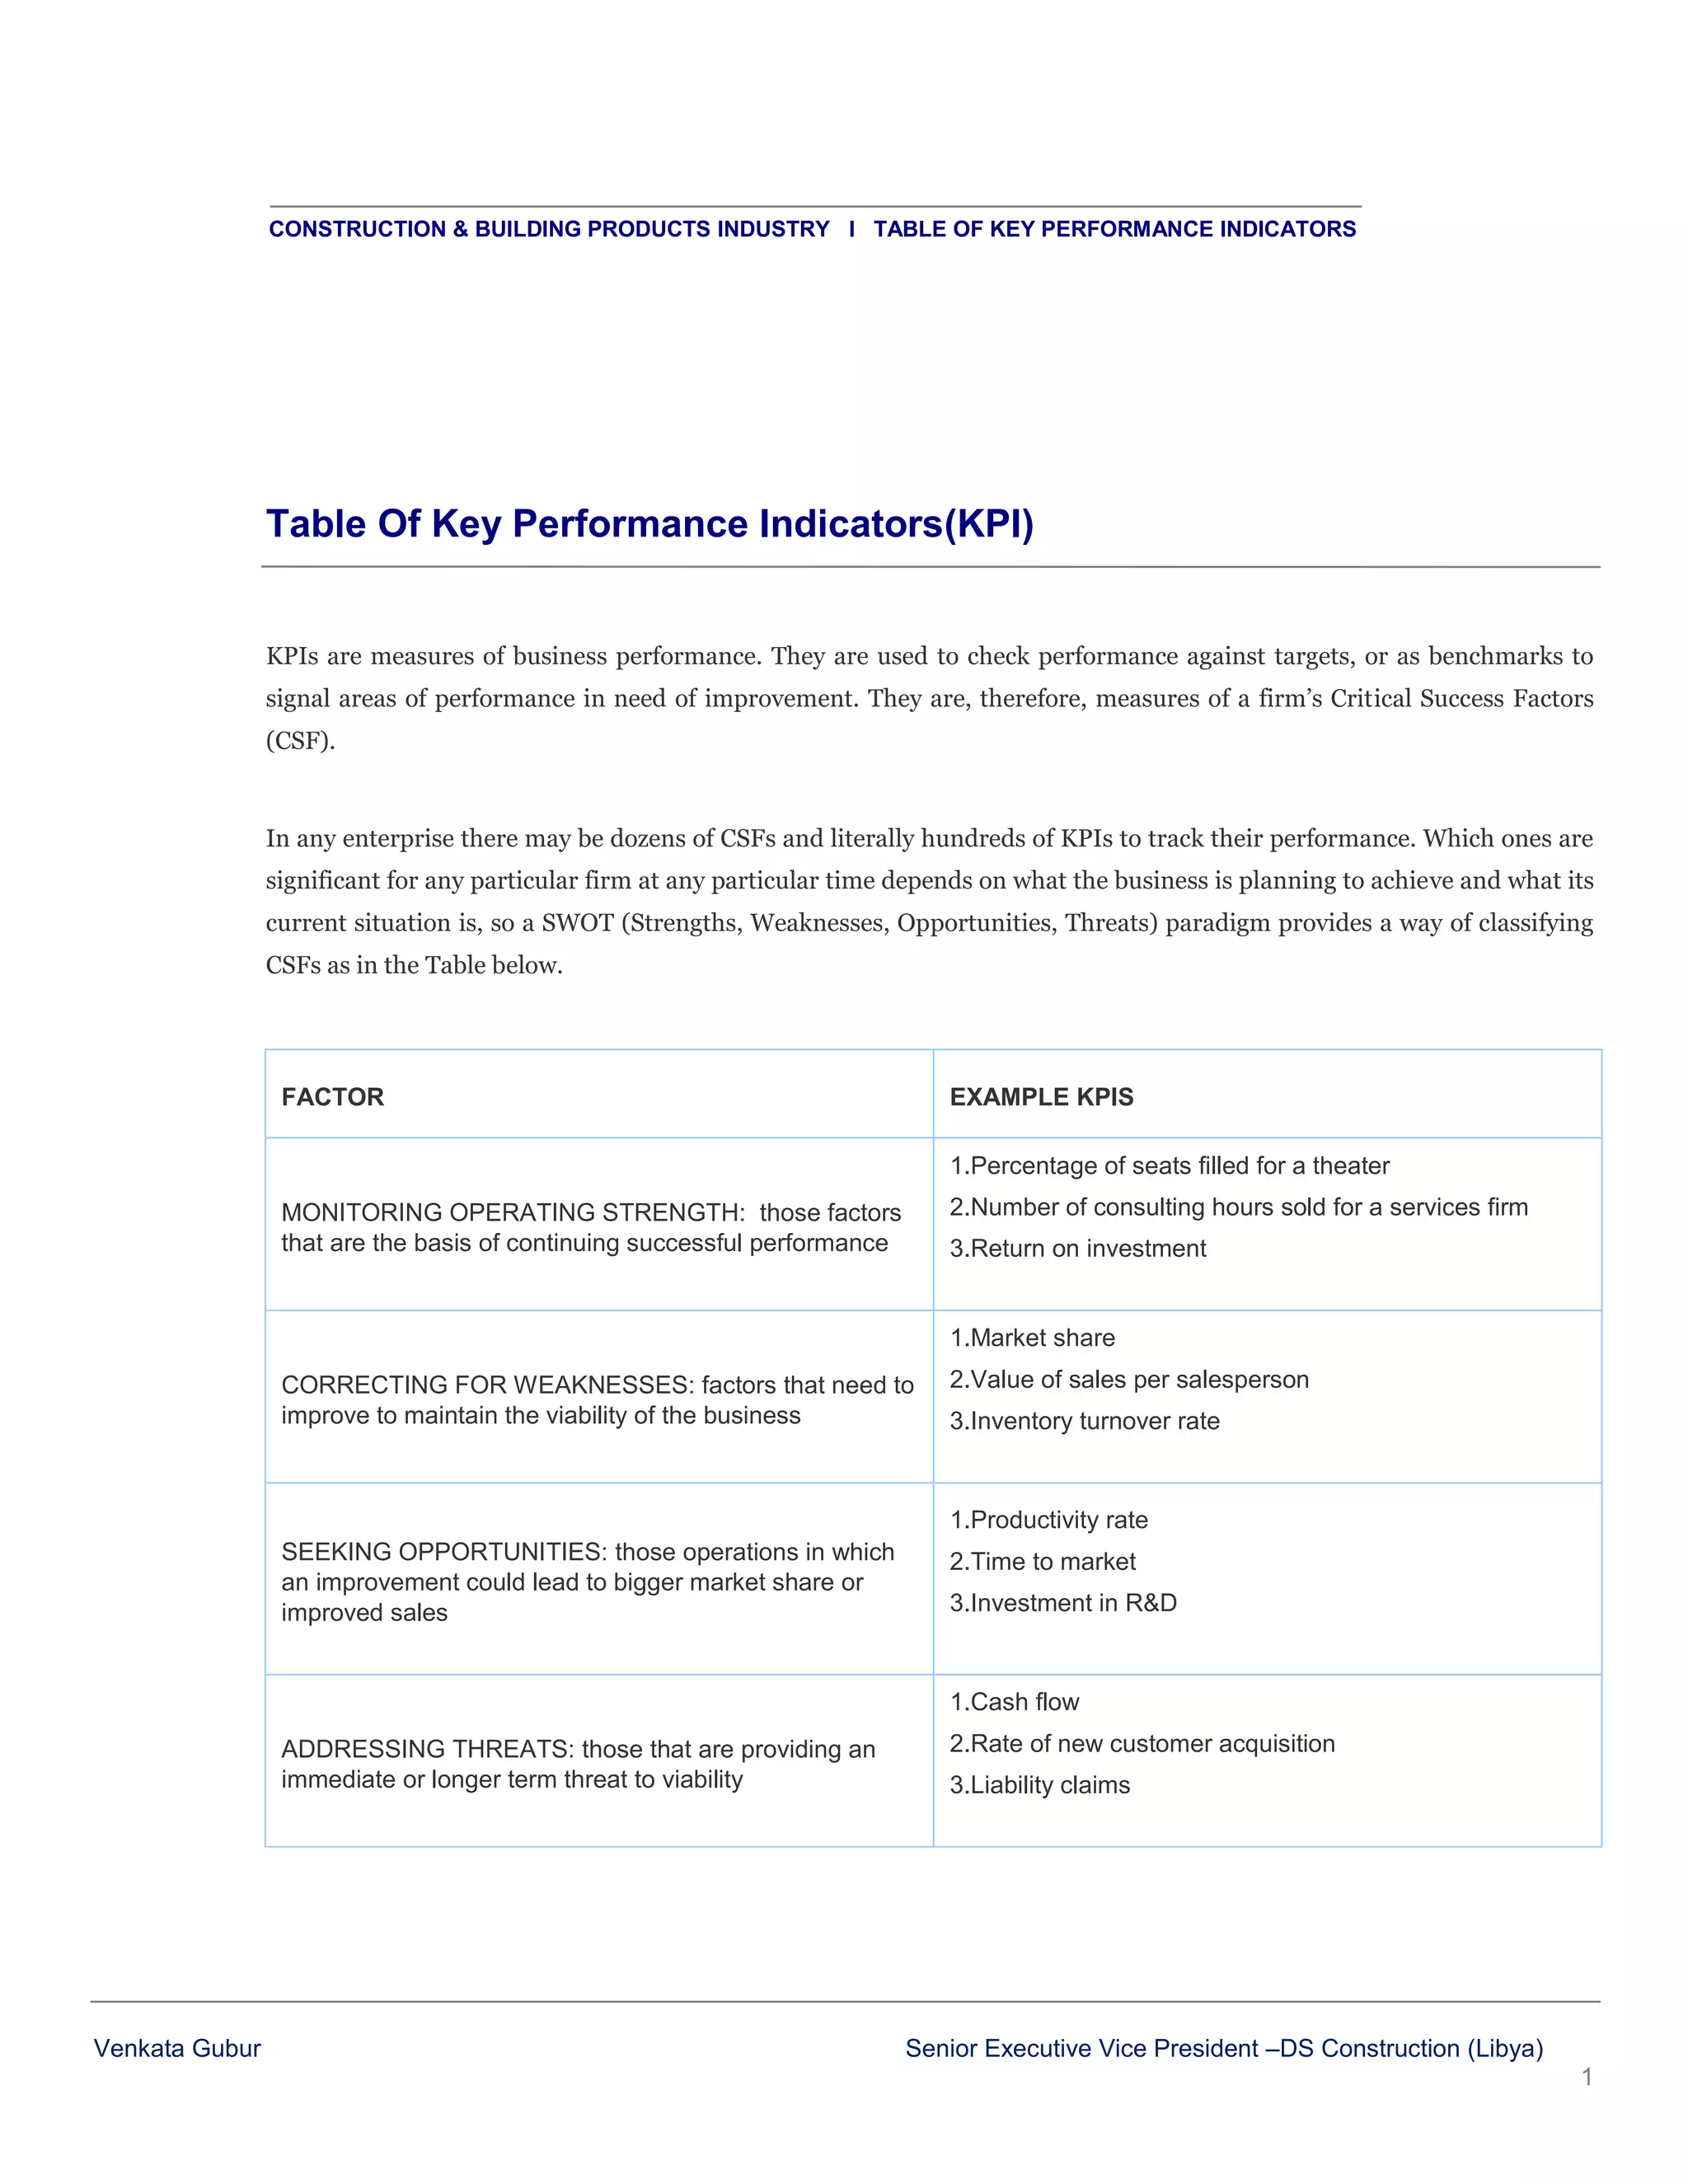
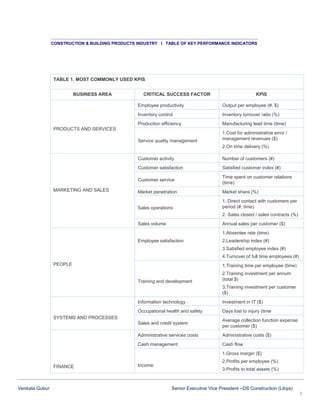
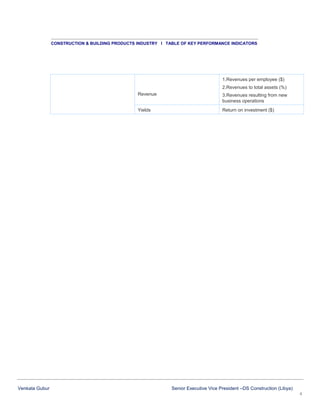
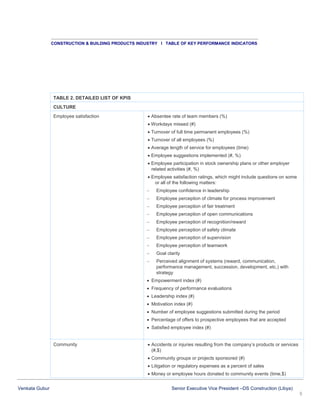
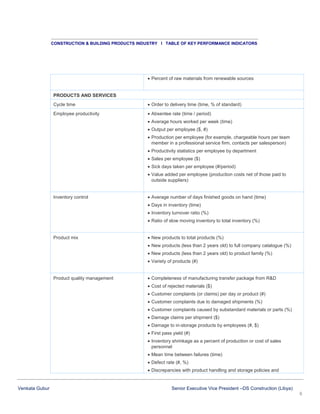
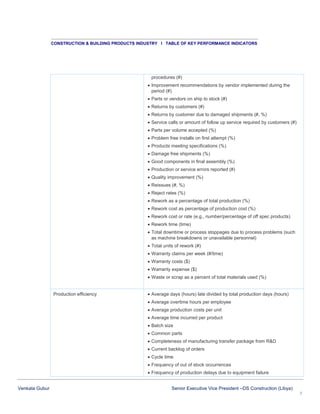
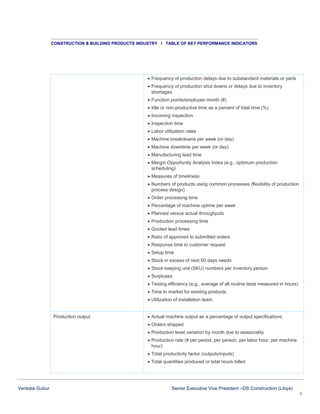
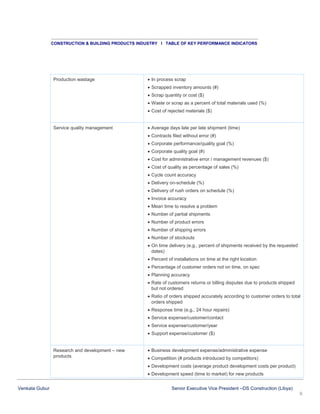
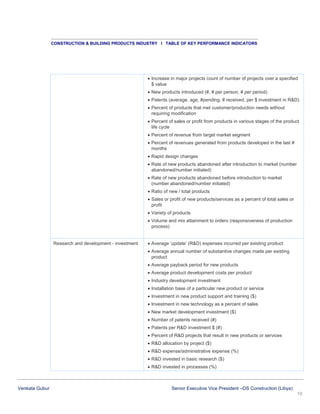
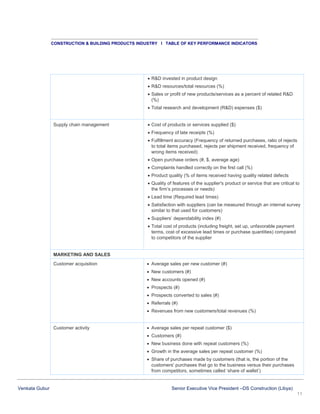
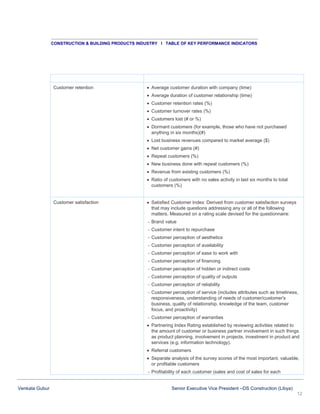
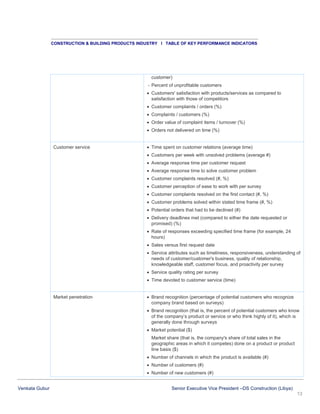
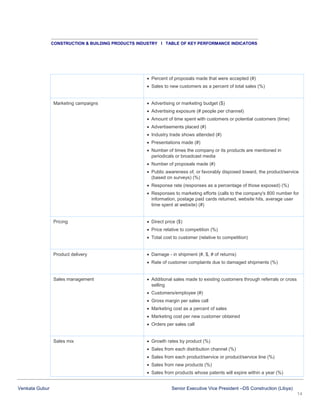
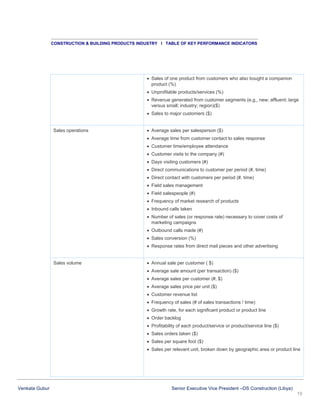
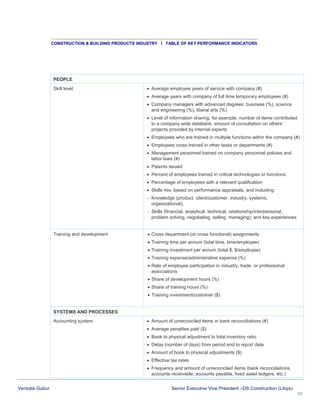
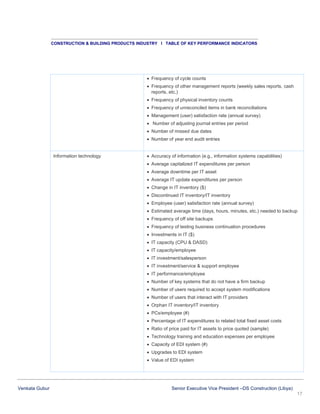
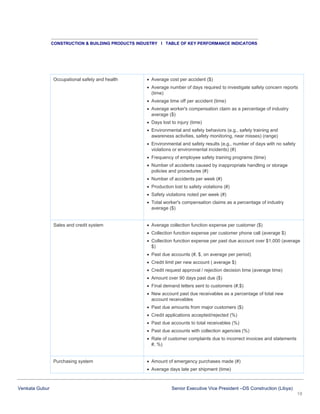
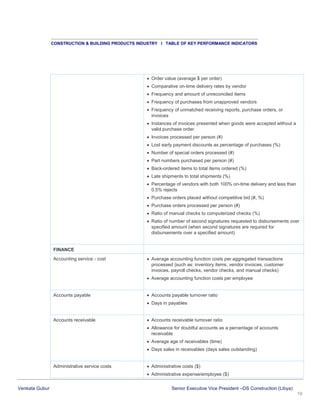
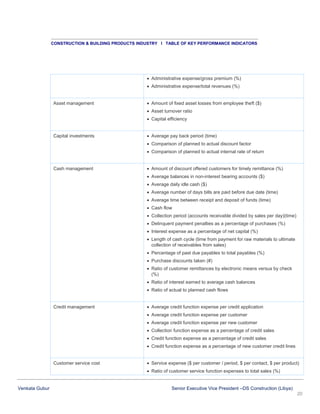
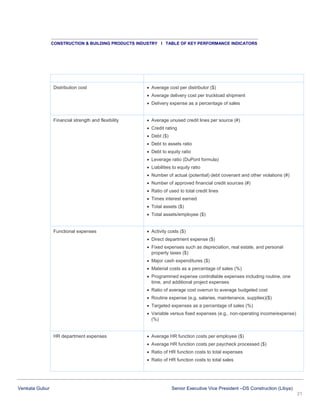
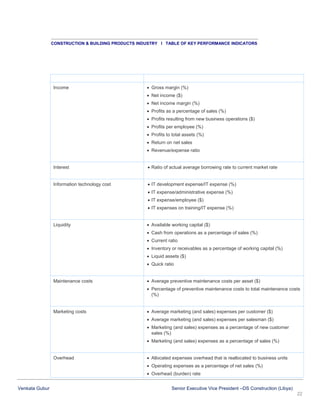
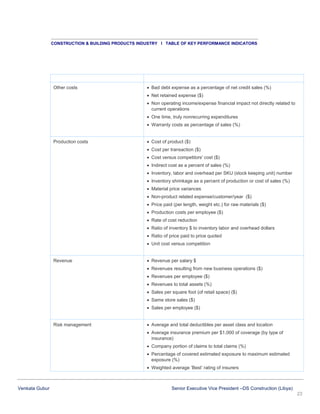
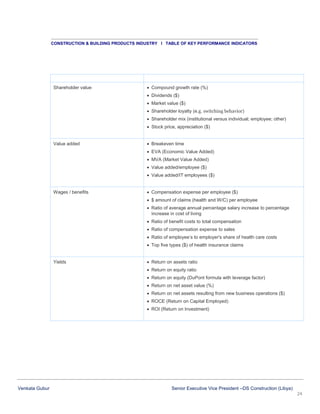
This document provides tables of key performance indicators (KPIs) for monitoring business performance in the construction and building products industry. Table 1 lists KPIs organized by business area such as products/services, marketing/sales, people, systems/processes, and finance. Table 2 provides a more detailed list of potential KPIs measuring factors like employee productivity, inventory control, production efficiency, customer satisfaction, research/development, and marketing/sales metrics. The tables are intended to help companies select relevant KPIs to track critical success factors based on their objectives, industry knowledge, and targeted drivers of performance improvement.
This document discusses key performance indicators (KPIs) for a project controller position. It provides information on developing KPIs for a project controller, including defining objectives, identifying key result areas and tasks, and determining how to measure results. The document recommends that KPIs be clearly linked to strategy and answer important questions. It also warns against creating too many KPIs and notes that KPIs should change based on goals. Various types of KPIs are defined. The document directs the reader to an external website for additional KPI samples and materials.
The document discusses key performance indicators (KPIs) for a project officer position. It provides information on developing KPIs for a project officer, including identifying their key result areas, tasks, and methods for measuring performance. The document recommends that KPIs be clearly linked to strategy and empower employees. It also lists different types of KPIs and directs the reader to a website for additional KPI materials and resources.
This document discusses key performance indicators (KPIs) for a project support officer position. It provides examples of KPI materials that can be used, including lists of KPIs, performance appraisals, job skills, and key result areas. It also outlines steps for creating KPIs for this role, such as defining objectives and identifying tasks and measurements. Common mistakes to avoid when setting KPIs, like having too many, are also covered. Finally, the document recommends a website for additional KPI samples and materials.
The document discusses key performance indicators (KPIs) for a web project manager position. It provides examples of KPIs, steps for creating KPIs, common mistakes to avoid, and how to design effective KPIs. The document recommends visiting kpi123.com for additional KPI samples, performance appraisal forms, review methods and phrases to help evaluate a web project manager's performance.
This document discusses key performance indicators (KPIs) for project managers in the construction industry. It provides examples of KPIs that could be used, including project timelines, budgets, and quality metrics. It also outlines best practices for developing a KPI system, such as linking KPIs to overall business strategy and goals, ensuring they are measurable, and avoiding having too many KPIs. The document recommends focusing KPIs on 3-5 key result areas to effectively evaluate project manager performance.
This document discusses key performance indicators (KPIs) for construction projects. It provides information on developing KPIs, including defining objectives, identifying key result areas and tasks, and determining methods to measure results. The document also discusses common mistakes in creating KPIs, such as having too many KPIs not linked to key result areas. Additionally, it describes different types of KPIs like process, input, output, leading, lagging, outcome, qualitative and quantitative KPIs. The document aims to provide guidance on establishing an effective KPI system for evaluating construction project and employee performance.
This document discusses key performance indicators (KPIs) for a special projects manager position. It provides examples of KPIs, steps for creating KPIs for this role, and common mistakes to avoid, such as having too many KPIs not linked to key result areas. The document recommends KPIs be clearly linked to strategy and empower employees. It also lists different types of KPIs and provides a link to access additional KPI materials and resources.
The document discusses key performance indicator (KPI) examples for project management. It provides links to materials on KPIs including lists of KPIs, performance appraisal metrics, and ebooks. It also discusses steps for creating KPIs such as defining objectives, identifying key result areas and tasks, and determining methods to measure results. Common mistakes in creating KPIs include having too many KPIs and not tailoring KPIs to change over time. KPIs should be linked to strategy and empower employees. The document also describes different types of KPIs including process, input, output, leading, lagging, outcome, qualitative, and quantitative.
Key Performance Indicators: Valuable Tools for Measuring PerformanceVesta Corporation
Key performance indicators, or KPIs, can be a valuable tool to help companies evaluate how they are performing. This presentation examines how KPI rates and indicators are calculated, why they can vary from business to business, and when not to compare KPIs to others in the industry. A handy checklist is included to help companies ensure their KPIs support their business needs, as well as how existing KPIs can be refined and thoughts on developing a forward-looking KPI strategy to evolve as the business does.
Visit www.trustvesta.com to view the integrated fraud and guaranteed payments solutions available to your organization.
The document discusses key performance indicators (KPIs) and provides examples of KPIs across different areas of a business. It defines KPIs and explains their purpose is to measure performance against objectives. KPIs can be input, process, output, or outcome measures and should be meaningful, measurable, quantitative or qualitative, routinely collected, comparable, and useful. The document provides examples of KPIs for areas like return/profit, productivity, employee development, quality assurance, research and development, organizational image, and legislative relations.
This document discusses key performance indicator (KPI) examples for maintenance. It provides links to materials on KPIs including lists of KPIs, performance appraisal metrics, and ebooks. It also outlines steps for creating KPIs such as defining objectives, identifying key result areas and tasks, and determining methods to measure results. Common mistakes to avoid when building KPI systems are creating too many KPIs and not tailoring KPIs to change with goals. KPIs should be linked to strategy and empower employees. The document also describes different types of KPIs including process, input, output, leading, lagging, outcome, qualitative, and quantitative.
This document discusses key performance indicators (KPIs) and how to develop a project management KPI dashboard. It provides resources for KPIs, performance metrics, and steps for creating a KPI system. The top materials listed are a list of 2436 free KPIs, top 28 performance appraisal forms, and 11 performance appraisal methods. The document also discusses types of KPIs such as process, input, output, leading, lagging, outcome, qualitative and quantitative KPIs.
This document discusses key performance indicators (KPIs) for a project controls manager position. It provides examples of KPIs, steps for creating a KPI system, and common mistakes to avoid, such as having too many KPIs not linked to key result areas. The document recommends KPIs be clearly linked to strategy and empower employees. It also lists different types of KPIs and provides a link to additional KPI materials and resources.
The document outlines a process for developing key performance indicators (KPIs) to measure the success of design and construction projects at the SCA. It discusses establishing a task force to identify existing KPIs and develop new ones. A proposed framework includes identifying KPI sources, categories, and mapping KPIs to the project lifecycle. A timeline is proposed to explore KPIs in Phase 1, execute in Phase 2 by approving KPIs and identifying tools to track them, validate KPIs in Phase 3 through pilot projects, and deploy KPIs organization-wide in Phase 4. The document seeks input on the roadmap and discusses next steps to confirm the process and establish the project team.
This document discusses key performance indicators (KPIs) for project managers. It provides information on developing KPIs, including identifying key result areas, tasks, and methods for measuring results. The document also discusses common mistakes in creating KPIs, such as having too many KPIs or not adjusting KPIs based on goals. Additionally, it describes different types of KPIs like process, input, output, leading, lagging, outcome, qualitative and quantitative KPIs.
This document discusses key performance indicators (KPIs) for construction project managers. It provides information on developing KPIs for this role, including defining objectives, key result areas, and tasks. The document recommends that KPIs be clearly linked to strategy and empower employees. Mistakes to avoid are creating too many KPIs and not adjusting KPIs based on goals. Additional KPI materials can be found on the listed website.
This document discusses key performance indicators (KPIs) for release management and performance appraisal. It provides information on developing KPIs, including defining objectives, identifying key result areas and tasks, and determining methods to measure results. The document also discusses common mistakes in creating KPIs, such as having too many KPIs, and ensuring KPIs change based on goals. Different types of KPIs are outlined, including process, input, output, leading, lagging, outcome, qualitative and quantitative KPIs.
This document discusses key performance indicators (KPIs) for senior project managers. It provides examples of KPIs, steps for creating a KPI system, common mistakes to avoid, and how to design effective KPIs. The document recommends visiting an online site for additional KPI samples, performance appraisal forms, review methods and phrases.
This document discusses key performance indicator (KPI) examples and how to create effective KPIs. It provides links to resources on KPIs, including lists of sample KPIs and performance appraisal forms and methods. It outlines steps for creating KPIs for a specific position and discusses common mistakes to avoid, such as having too many KPIs or ones that do not change based on goals. Finally, it describes different types of KPIs, such as process, input, output, leading, lagging, outcome, qualitative and quantitative KPIs.
Project managers use Key Performance Indicators (KPIs) and dashboards to monitor and communicate the status of a project. KPIs should be measurable metrics that indicate if objectives are being met. Effective KPIs are specific, measurable, attainable, relevant and time-bound. KPIs can be quantitative or qualitative and should be selected to provide insights without overwhelming stakeholders with too much data. Dashboards consolidate multiple KPIs using visual widgets like charts, tables and gauges to give viewers a quick status update in an easy to understand format.
This document discusses key performance indicators (KPIs) for a quality control (QC) manager position. It provides examples of KPIs, steps for creating a KPI system, common mistakes to avoid, and how to design effective KPIs. The document recommends visiting an external website for additional KPI samples and materials related to performance appraisal forms, methods, and review phrases.
This document discusses key performance indicators (KPIs) for a web development manager position. It provides examples of KPIs, lists the typical steps to create KPIs for this role, discusses common mistakes to avoid, and how KPIs should be designed. The document recommends visiting an external website for additional KPI samples and materials related to performance reviews.
Download⚡PDF❤ Project Management Metrics KPIs and Dashboards A Guide to Mea...moerbouthererrt
Harold Kerzner's essential strategies on measuring project management performanceWith the growth of complex projects stakeholder involvement and advancements in visualbased technology metrics and KPIs (key performance indicators) are key factors in evaluating project performance. Dashboard reporting systems provide accessible project performance data and sharing this vital data in a concise and consistent manner is a key communication responsibility of all project managers.This third edition of Kerzner's groundbreaking work Project Management Metrics KPIs and Dashboards A Guide to Measuring and Monitoring Project Performance helps functional managers gain a thorough grasp of what metrics and KPIs are and how to use them. Plus this edition includes new sections on processing dashboard information portfolio management PMO and metrics and BI tool flexibility. Offers comprehensive coverage o
This document discusses quality key performance indicator (KPI) examples and how to design effective KPIs. It provides examples of different types of KPIs such as process, input, output, leading, and lagging KPIs. The document also outlines steps for creating KPIs, including defining objectives, identifying key result areas and tasks, and determining methods to measure results. Common mistakes in developing KPIs, such as having too many metrics or ones that do not change over time, are also examined.
The document discusses key performance indicators (KPIs) for a project coordinator position. It provides information on developing KPIs, including defining objectives, identifying key result areas and tasks, and determining how to measure results. The document recommends that KPIs be clearly linked to strategy and empower employees. It also lists types of KPIs and directs the reader to a website for additional KPI materials and resources.
This document discusses key performance indicators (KPIs) for project managers. It provides information on developing KPIs, including defining objectives, identifying key result areas and tasks, and determining methods to measure results. The document warns against creating too many KPIs and notes that KPIs should be linked to strategy and empower employees. It also outlines different types of KPIs, such as process, input, output, leading, lagging, outcome, qualitative and quantitative.
This document discusses qualitative key performance indicators (KPIs) such as lists of KPIs, performance appraisal metrics, job skills, and balanced scorecard elements. It provides links to download additional qualitative KPI materials like ebooks on KPIs, performance appraisal forms, and review phrases. The document also outlines steps for creating KPIs for specific job roles and common mistakes to avoid, such as having too many KPIs or ones that do not change based on goals. Finally, it describes different types of KPIs including process, input, output, leading, lagging, outcome, qualitative, and quantitative.
This document discusses key performance indicators (KPIs) and how to effectively display them for project management. It defines KPIs and provides examples of common project KPIs like schedule progress and resource allocation. The document also outlines different types of widgets that can be used to visually represent KPIs, such as histograms, pie charts, and speedometers. It emphasizes that KPI displays should be concise and avoid clutter. Finally, it recommends using a dashboard to showcase multiple KPIs arranged in an easy-to-read format.
This document discusses key performance indicators (KPIs) for construction project engineers. It provides examples of KPIs that could be used, including metrics for construction project engineer performance appraisal, job skills, key result areas, and balanced scorecard. The document recommends following steps to create KPIs for this position, such as defining objectives and identifying key result areas, tasks, and methods to measure results. It also warns against common mistakes like creating too many KPIs and having KPIs that do not change to suit different goals and stages. The document directs the reader to an online source for additional KPI samples and materials.
This document discusses key performance indicators (KPIs) for construction projects. It provides information on developing KPIs, including defining objectives, identifying key result areas and tasks, and determining methods to measure results. The document outlines common mistakes in creating KPIs, such as having too many KPIs or ones that do not change based on goals. It also describes different types of KPIs, such as process, input, output, leading, lagging, outcome, qualitative and quantitative KPIs. Resources for additional construction KPI materials and examples are provided.
Definition of the Key Performance Indicators + infographics, explaining types of KPIs and data visualization.
Originally posted here with the article: https://www.kpi.com/blog/2016/02/03/intro-to-key-performance-indicators-infographic/
The document discusses key performance indicators (KPIs) and their use in evaluating organizational success. It provides several definitions of KPIs, noting they are metrics tied to targets that measure progress toward goals. KPIs should be SMART (specific, measurable, achievable, relevant, and time-bound). The document gives an example of how KPIs could be used to measure progress on a strategic aim of improving student IT skills, including setting targets and measuring actual performance against past data. It demonstrates defining initiatives, associated KPIs, past baseline data, targets, and assessing actual results.
This document proposes key performance indicators (KPIs) for measuring radio access network (RAN) performance on a RNC. It defines KPIs in areas such as coverage, accessibility, retainability, mobility, service integrity, availability and traffic. Templates are provided for each KPI, specifying the name, description, measurement scope, calculation formula and associated counters. A total of 38 KPIs are defined and classified into the different performance areas.
Example of scorecard template dashboard that is visual with colorful buttons and arrows. Three templates and a legend provided. Templates applicable to multiple project types.
This document discusses key performance indicators (KPIs) and how to develop them. It provides information on defining objectives and key result areas, identifying tasks and work procedures, and measuring results to create KPIs. The document outlines common mistakes to avoid when developing KPIs, such as creating too many or not tailoring them to goals. It also describes how to design KPIs so they are linked to strategy and empower employees. Finally, it discusses different types of KPIs including process, input, output, leading, lagging, outcome, qualitative and quantitative.
This document provides an overview of key performance indicators (KPIs) and performance management systems. It discusses what KPIs are, how to establish goals and objectives, different types of KPIs, using the balanced scorecard approach, and the benefits of implementing a performance management system. The document contains several sections that define concepts, provide examples, and outline best practices for setting up an effective KPI and performance management system.
The document discusses key concepts related to engineering and production costs. It covers topics like product development processes, design considerations, and health and safety. Specifically, it describes the stages of research and development from basic research to prototypes. It also discusses factors that influence design decisions such as standardization, manufacturability, and the make-or-buy analysis. Finally, it emphasizes the importance of production health and safety to reduce accidents and interruptions.
This document discusses Key Performance Indicators (KPIs) for measuring warehouse inventory performance. It defines KPIs and lists 10 important warehouse inventory KPIs to monitor, including inventory turnover, inventory accuracy, rate of demand, average days on hand, carrying cost of inventory, rate of return, perfect order rate, back order rate, percentage of out of stock items, and inventory to sales ratio. Each KPI is defined and an example calculation is provided. Monitoring these KPIs can help optimize inventory levels and identify issues impacting operations.
How to build a Key Performance Indicator (KPI) - Consider Elevator ManagementAxel Marrocco
What exactly is a KPI. This lesson was developed to help consider how to evaluate the effectiveness of a problem / solution proposal. Elevator Management is used, since it provides a topic almost all can relate with. The focus is not to development an understanding of Critical Success Factors, but to concentrate on elements necessary in constructing a Key Performance Indicator (KPI) of a proposal's effectiveness.
Here are the key terms defined according to terminology standards:
Objective: To obtain profit before interest, taxes, depreciation and amortization (EBITDA) ≥ B
KPI: $ EBITDA
Initiative: Implement cost reduction program
The document discusses the difference between metrics and key performance indicators (KPIs). It states that a KPI is a specific type of metric that is important for measuring organizational goals, is decided by management, and leads to action. The document provides examples of online marketing KPIs such as ad click-through rate, cost per new subscriber, web customer interactions, and look-to-book ratio. It emphasizes that developing the right KPIs is important for maximizing organizational performance.
This presentation gives a very high-level explanation of what a dashboard should be used for, what type of content it should consider and how it should look to be most effective.
The document provides a template for an HR manager's key performance indicator (KPI) table. It includes instructions on defining key result areas, selecting KPIs, assigning weights and targets for each KPI, tracking actual results, calculating scores, and using the final score to determine bonuses, salary increases, and promotions. The template and additional HR tools can be downloaded from www.exploreHR.org.
Developing Metrics and KPI (Key Performance IndicatorsVictor Holman
Get a FREE performance management kit and access to all of Victor's full videos at:
www.lifecycle-performance-pros.com
This presentation covers the basics of developing successful performance metrics, from developing winning KPIs, learning how to develop the right metrics, the rules of developing KPIs and metrics and common performance metrics for managing a successful organization.
Business Metrics and Web Marketing
What is "business metrics"? Type of metrics in business and aviation examples.
How to distinguish traditional and dynamic metrics?
What is Ad Words
What is Acquisition Cost
What is Bounce Rate?
Most Importantly what is "Conversion Rate"?
The document discusses performance indicators and key performance indicators (KPIs) which are used to measure and monitor the performance of organizations. It provides examples of KPIs for different business functions such as manufacturing, purchasing, sales, finance, maintenance, and human resources. Some key aspects covered include selecting KPIs based on critical success factors and customer requirements, using a balanced scorecard and performance dashboards to monitor KPIs, and characteristics of effective performance indicators.
The document discusses key concepts in operations management including defining OM, distinguishing between goods and services, and explaining productivity and its measurement. It covers the critical decisions OM managers make, trends in the field, and strategies to improve productivity, noting that productivity increases are needed for economic growth. Labor, capital, and management each contribute to about 10%, 38%, and 52% of annual productivity gains respectively.
The document discusses key concepts in operations management including defining OM, distinguishing between goods and services, and explaining productivity and its measurement. It covers the critical decisions OM managers make, trends in OM, and factors that influence productivity. Productivity is the ratio of outputs to inputs and can be improved through variables like labor, capital, management skills, and technology.
Top 10 most important manufacturing performance indicators in 2019MRPeasy
mrpeasy.com
In manufacturing, there are many outside influencing factors, tracking the performance of an operation with KPI metrics means the difference between success and failure. Here are the most important manufacturing performance indicators.
Product and Services Design & DevelopmentRaj Vardhan
This PPT is about product design and development and it's the significance, advantages and disadvantages and its impacts on sales and performance of the product or services of the company.
IRJET- A Holistic Review of the Elements and the Tools of Lean ManufacturingIRJET Journal
This document provides a holistic review of the elements and tools of lean manufacturing. It discusses the key elements of lean manufacturing including customer value, value stream, value flow, customer pull, and continuous improvement. The primary lean tools described are 5S, total productive maintenance, workcells, and value stream mapping. Secondary lean tools discussed include cause and effect diagrams and Pareto charts. The document aims to analyze and examine the basic elements and tools of lean manufacturing along with the benefits and drawbacks of implementing lean in a manufacturing industry.
Edgewater Ranzal Oracle Ace and Director of Technology Mike Killeen was invited to present on the need for profitability and cost management, at Oracle EPM Day in New York.
This document provides an overview of SCG's agile development process and what clients can expect when partnering with them. It discusses their focus on design and ROI, as well as their experience developing platforms in Jamaica, Trinidad, and Barbados. SCG offers flexible development solutions from one-off projects to full digital transformations. They utilize agile development principles to deliver results on time and on budget through iterative development and continuous improvement.
The survey found that the average short-term financial impact of an isolated technology failure was $10.8 million. Customer service was identified as the area most negatively impacted by technology issues. While half of executives attributed failures to software or hardware issues, three-quarters said the same failures had occurred previously. To resolve issues, 90% of companies took actions like purchasing new software or hardware.
This document provides a summary of Yoichiro Imamura's resume. It lists his contact information, work experience, education, skills, and technical expertise. The document highlights that he has over 30 years of experience in semiconductor manufacturing, primarily in quality management and process development roles. It also outlines his responsibilities and accomplishments in positions at Texas Instruments and other companies, with a focus on improving product quality, reducing costs, and resolving technical issues.
The document provides information about designing new products and services. It discusses trends in product design such as a shift toward services and information technology. It also covers product life cycles and strategies for different stages. The document presents methods for managing design processes, including concurrent engineering. It provides an example of quality function deployment to translate customer wants into product characteristics. Finally, it discusses tools for decision making in product design, including using a decision tree to analyze introducing a new product.
The document discusses product and service design. It covers key aspects of product and service design including objectives, phases in the design process, differences between product and service design, guidelines for successful service design, and how design impacts operations strategy. The overall goal of design is to translate customer needs into high-quality, cost-effective products and services that satisfy customers and contribute to business success. Legal and ethical considerations must also be taken into account in the design process.
2 wks
3 wks
Generate
Quote
SQO
Customer
Contact Customer
Conduct POC
Conduct Sales Mtg / Demo
Sales / Technical
Review Special Bid
Deliver
Quote
Execute Proposal
Finalize Procurement
PT = 5 days
LT = 2 wks
PT = 3 hrs
LT = 1 wk
PT = 2 wks
LT = 3 wks
Total PT = 138 Hrs (3.4 wks)
Total LT = 605 Hrs (15.1 wks)
5 days
2 wks
Current State Value Stream Mapping for Sales Conversion
PT = 3.5 hrs
LT = 4 wks
2 hrs
2 wks
3.5 hrs
4 wks
1
2
3
4
5
6a
7
8
9
PT = 2 hrs
LT = 2 wks
Sales
Technical
Pricers
Review Standard Bid
PT = 20 min
LT = 1 hr
6b
Pricers
Sales
PT = 3 hrs
LT = 3 hrs
Sales
Sales
PT = 2 hrs
LT = 2 hrs
PT = 4 hrs
LT = 3 wks
Sales
25
10
2
2
10
5
1
1
2
5
7
12
7
10
7
7
7
2 hrs
2 hrs
3 hrs
1 wk
3 hrs
3 hrs
4 hrs
3 wks
Current State Metrics for Sales Conversion
Overview of the Process
The Sales Conversion Process begins with contact with the customer and includes the activities to understand their requirements, present a solution (both in concept and to prove out), provide pricing proposals through to procuring the software and executing a PO. The Sales Process has not been traditionally included when mapping operations within an organization; thus, there are no defined metrics for the steps of the process. The PT and LT times shown are anecdotal and should be more formally assessed by “going to the gemba.”
Challenges
As a workforce, Sales reps are likely one of the hardest groups to map as many Sales Reps would argue that what they do is more art than science. Typically, Sales Reps have not been required to account for their time to any detail. This makes the Sales Process challenging in that there have not been any true time studies to use a foundation. The Sales Process needs to be studied at the process level, not at an individual customer level.
There are categories of waste within the areas of waiting, extra processing, correction, etc. Much of the process is manual, and likely to continue to be manual, which means you are relying on human action which is prone to error, distraction, etc. This is further support to study in detail.
Variability is a third challenge. The variability across reps (personalities and skills), customers, industries, and geographic locations makes it harder to determine what is value add and what is wasteful which will be critical in establishing a process on a large, repeatable scale. There is also variability in the execution of the process (what steps are taken, in what order, etc.) which causes variability in the process times.
Bottlenecks
Within Sales, the customer is heavily involved. There is a lot of external wait time spent waiting for the customer to respond, be available, etc. As an example, the Meeting noted is on average 2 hours; however, the elapsed time is 2 weeks. This time is waiting for the customer to respond and to find available time on their calendar that matches your own. Another example is the procurement process. At this point, the Sales Rep is waiting .
The document provides an overview of Quality Function Deployment (QFD), a structured methodology for incorporating customer needs into product design and development. It discusses the key aspects of QFD, including identifying customer requirements, design attributes, and their relationships. It describes the "House of Quality" diagram which maps these relationships. It also discusses how additional houses can be used to flow customer needs through different stages of development and production to ensure the customer voice is maintained.
The document discusses key concepts in production management including productivity, factors that impact productivity, and techniques to improve labor productivity. It defines productivity and provides examples of how it can be measured at different levels. It also outlines traditional and modern techniques for improving labor productivity, materials productivity, machine productivity, and overall productivity.
The document discusses performance management and target setting processes. It describes setting targets at the organizational, departmental, and individual levels by examining goals, strengths/barriers, and resource availability. Individual targets should be SMART (specific, measurable, agreed, realistic, time-bound) and cover functional, process improvement, and subordinate development areas. Examples of target areas are provided for various functions like production, marketing, engineering, R&D, and materials. Approaches for integrating functional plans with business plans are also outlined.
The document discusses balanced scorecards and how they can be used as a management toolkit to measure performance from customer, internal process, and learning and growth perspectives in addition to traditional financial measures. It provides examples of how metrics can be cascaded down from strategic scorecards to operational unit scorecards. Cause and effect relationships between metrics are also discussed, as well as how balanced scorecards can be linked to other frameworks like COBIT and used to track performance against business objectives.
This document discusses the importance of addressable spend and how increasing addressable spend can considerably increase net profit. It defines addressable spend as the total spend under the control of procurement and supply chain executives. The document advocates thinking beyond traditional categories to include more spend, such as indirect categories, CAPEX, R&D, salaries and taxes. Including these non-traditional categories can lead to savings of 20-35% and increase net profit by 20-75%. More mature procurement organizations with a higher percentage of revenue as addressable spend can achieve even larger increases in net profit.
Similar to Kpi basics construction _building material_industry 2009 (20)
CERTIFICATE COURSE on Eco Petrol_ S A I _NEW YORK_ USAVenkat Subbu
This certificate recognizes Jane Hwang for successfully completing a training program on measuring and improving labor standards performance. The certificate is dated 2016-06-26 and is signed by Gobburu Venkata on behalf of Social Accountability International.
CEERTIFICATE ON HOW TO IMPROVE LABOUR PERFORMANCE STANDARDS _S A I_ NEWYORK_USAVenkat Subbu
This certificate recognizes Jane Hwang for successfully completing a training program on measuring and improving labor standards performance. The certificate is dated 2016-06-26 and is signed by Gobburu Venkata on behalf of Social Accountability International.
Integrated Management System: 3 Party AUDIT -GUIDE Venkat Subbu
1. The document discusses implementing an integrated management system using ISO 9001, 14001, and 18001 standards. It provides tips on interviewing employees during audits and reviewing documentation to check for compliance.
2. Key points on interviewing include using open-ended questions, putting interviewees at ease, and avoiding judgmental questions. Typical employees to interview include managers, training staff, and operations workers.
3. When reviewing documentation, auditors check that the system addresses standards requirements and that procedures match actual practices. Common documents reviewed include policies, objectives, training records, and operational instructions.
Social Accountability 8000 2014-auditor-guidance-for-social-fingerprintVenkat Subbu
The document introduces Social Fingerprint, a methodology for SA8000 certified organizations to assess the maturity of their management systems for social performance. It consists of a self-assessment conducted by the organization and an independent evaluation by auditors. The methodology measures management systems across 10 key criteria corresponding to SA8000 requirements. Organizations are rated on a scale of 1-5 to indicate their level of maturity, with a level 4 generally corresponding to full SA8000 compliance. Social Fingerprint aims to standardize assessments and help organizations identify areas for continual improvement.
XLRI Transactional Analysis for managerial EffectivenessVenkat Subbu
Eric Berne developed TA and suggested we can think of all of our communication as coming from one of three ‘ego states’. When we speak, we speak as a parent does, as an adult does, or as a child does. We all encompass all three, but address others from one at a time, depending on the relationship, how we feel, and how the other person is acting.
When it’s used correctly, you get a description of all the types – not just your own; You get confirmation that you aren’t alone in how you act and react; You get an objective framework for viewing people in your life; You begin to understand why some activities drain you and some energize you; You can use your personality preferences as a guide to finding your strengths
Digital analytics fundamentals October 2013Venkat Subbu
Google, eBay and LinkedIn were among the first to experiment with big data. They developed proof of concept and small-scale projects to learn if their analytical models could be improved with new data sources.
The document outlines a workshop on e-commerce tactics with 9 secrets to be discussed over 3 sections. Section one will cover building value ladders and funnels, finding customers, and traffic sources. Section two focuses on communication funnels, including developing an attractive character and storytelling techniques. Section three is about using funnels to repeatedly lead customers to purchases by reverse engineering successful funnels.
Venkata Subbarao Gobburu RAO has completed an Occupational Health & Safety Management System Auditor/Lead Auditor Course and was assessed as competent in auditing management systems, occupational health & safety management systems, and leading auditing teams.
GVS Rao has over 30 years of experience in marketing and business development roles. He has worked in pharmaceutical, engineering, construction, and education industries. Some of the companies he has worked for include Alkem Labs, Vam Group, Ch2Mhill, MB Group, and ANC Holdings. He holds a PG D in HR and Marketing from Osmania University and an MBA in Global Management from Kellogg Business School. Currently, he works as a consultant in education, helping universities with student selection, seminars, workshops, and ISO certifications. He also teaches various marketing and management courses at the undergraduate and graduate levels.
FOUNDATIONS OF ANALYTICS in DIGITAL MARKETING Venkat Subbu
The document announces a workshop on foundations of digital marketing analytics conducted by Gobburu Venkata on March 8, 2016. It provides the workshop title, date, and contact information for Gobburu Venkata, who designed the workshop. Each page contains an explanation section that is left blank.
This document outlines an e-commerce workshop conducted by Gobburu Venkata. The workshop covers topics such as the vision and mission of an e-commerce company, its functioning and objectives, attracting and retaining customers, e-commerce site design, transactions and fulfillment, and future expansion into global markets. The workshop provides information to help design and implement a successful e-commerce strategy and business.
Digital Marketing strategy workshop student docVenkat Subbu
How to traditional Marketers differ to Digital Marketing, basics of Digital Marketing; Basics of Strategic digital marketing; how do plan campaigns in Social media
Digital Marketing with a Focus on Sustainabilitysssourabhsharma
Digital Marketing best practices including influencer marketing, content creators, and omnichannel marketing for Sustainable Brands at the Sustainable Cosmetics Summit 2024 in New York
[To download this presentation, visit:
https://www.oeconsulting.com.sg/training-presentations]
This PowerPoint compilation offers a comprehensive overview of 20 leading innovation management frameworks and methodologies, selected for their broad applicability across various industries and organizational contexts. These frameworks are valuable resources for a wide range of users, including business professionals, educators, and consultants.
Each framework is presented with visually engaging diagrams and templates, ensuring the content is both informative and appealing. While this compilation is thorough, please note that the slides are intended as supplementary resources and may not be sufficient for standalone instructional purposes.
This compilation is ideal for anyone looking to enhance their understanding of innovation management and drive meaningful change within their organization. Whether you aim to improve product development processes, enhance customer experiences, or drive digital transformation, these frameworks offer valuable insights and tools to help you achieve your goals.
INCLUDED FRAMEWORKS/MODELS:
1. Stanford’s Design Thinking
2. IDEO’s Human-Centered Design
3. Strategyzer’s Business Model Innovation
4. Lean Startup Methodology
5. Agile Innovation Framework
6. Doblin’s Ten Types of Innovation
7. McKinsey’s Three Horizons of Growth
8. Customer Journey Map
9. Christensen’s Disruptive Innovation Theory
10. Blue Ocean Strategy
11. Strategyn’s Jobs-To-Be-Done (JTBD) Framework with Job Map
12. Design Sprint Framework
13. The Double Diamond
14. Lean Six Sigma DMAIC
15. TRIZ Problem-Solving Framework
16. Edward de Bono’s Six Thinking Hats
17. Stage-Gate Model
18. Toyota’s Six Steps of Kaizen
19. Microsoft’s Digital Transformation Framework
20. Design for Six Sigma (DFSS)
To download this presentation, visit:
https://www.oeconsulting.com.sg/training-presentations
Brian Fitzsimmons on the Business Strategy and Content Flywheel of Barstool S...Neil Horowitz
On episode 272 of the Digital and Social Media Sports Podcast, Neil chatted with Brian Fitzsimmons, Director of Licensing and Business Development for Barstool Sports.
What follows is a collection of snippets from the podcast. To hear the full interview and more, check out the podcast on all podcast platforms and at www.dsmsports.net
The Genesis of BriansClub.cm Famous Dark WEb PlatformSabaaSudozai
BriansClub.cm, a famous platform on the dark web, has become one of the most infamous carding marketplaces, specializing in the sale of stolen credit card data.
Best practices for project execution and deliveryCLIVE MINCHIN
A select set of project management best practices to keep your project on-track, on-cost and aligned to scope. Many firms have don't have the necessary skills, diligence, methods and oversight of their projects; this leads to slippage, higher costs and longer timeframes. Often firms have a history of projects that simply failed to move the needle. These best practices will help your firm avoid these pitfalls but they require fortitude to apply.
Industrial Tech SW: Category Renewal and CreationChristian Dahlen
Every industrial revolution has created a new set of categories and a new set of players.
Multiple new technologies have emerged, but Samsara and C3.ai are only two companies which have gone public so far.
Manufacturing startups constitute the largest pipeline share of unicorns and IPO candidates in the SF Bay Area, and software startups dominate in Germany.
Event Report - SAP Sapphire 2024 Orlando - lots of innovation and old challengesHolger Mueller
Holger Mueller of Constellation Research shares his key takeaways from SAP's Sapphire confernece, held in Orlando, June 3rd till 5th 2024, in the Orange Convention Center.
Understanding User Needs and Satisfying ThemAggregage
https://www.productmanagementtoday.com/frs/26903918/understanding-user-needs-and-satisfying-them
We know we want to create products which our customers find to be valuable. Whether we label it as customer-centric or product-led depends on how long we've been doing product management. There are three challenges we face when doing this. The obvious challenge is figuring out what our users need; the non-obvious challenges are in creating a shared understanding of those needs and in sensing if what we're doing is meeting those needs.
In this webinar, we won't focus on the research methods for discovering user-needs. We will focus on synthesis of the needs we discover, communication and alignment tools, and how we operationalize addressing those needs.
Industry expert Scott Sehlhorst will:
• Introduce a taxonomy for user goals with real world examples
• Present the Onion Diagram, a tool for contextualizing task-level goals
• Illustrate how customer journey maps capture activity-level and task-level goals
• Demonstrate the best approach to selection and prioritization of user-goals to address
• Highlight the crucial benchmarks, observable changes, in ensuring fulfillment of customer needs
The APCO Geopolitical Radar - Q3 2024 The Global Operating Environment for Bu...APCO
The Radar reflects input from APCO’s teams located around the world. It distils a host of interconnected events and trends into insights to inform operational and strategic decisions. Issues covered in this edition include:
Unveiling the Dynamic Personalities, Key Dates, and Horoscope Insights: Gemin...my Pandit
Explore the fascinating world of the Gemini Zodiac Sign. Discover the unique personality traits, key dates, and horoscope insights of Gemini individuals. Learn how their sociable, communicative nature and boundless curiosity make them the dynamic explorers of the zodiac. Dive into the duality of the Gemini sign and understand their intellectual and adventurous spirit.
Company Valuation webinar series - Tuesday, 4 June 2024FelixPerez547899
This session provided an update as to the latest valuation data in the UK and then delved into a discussion on the upcoming election and the impacts on valuation. We finished, as always with a Q&A
Discover timeless style with the 2022 Vintage Roman Numerals Men's Ring. Crafted from premium stainless steel, this 6mm wide ring embodies elegance and durability. Perfect as a gift, it seamlessly blends classic Roman numeral detailing with modern sophistication, making it an ideal accessory for any occasion.
https://rb.gy/usj1a2
3 Simple Steps To Buy Verified Payoneer Account In 2024SEOSMMEARTH
Buy Verified Payoneer Account: Quick and Secure Way to Receive Payments
Buy Verified Payoneer Account With 100% secure documents, [ USA, UK, CA ]. Are you looking for a reliable and safe way to receive payments online? Then you need buy verified Payoneer account ! Payoneer is a global payment platform that allows businesses and individuals to send and receive money in over 200 countries.
If You Want To More Information just Contact Now:
Skype: SEOSMMEARTH
Telegram: @seosmmearth
Gmail: seosmmearth@gmail.com
3 Simple Steps To Buy Verified Payoneer Account In 2024
Kpi basics construction _building material_industry 2009
1. CONSTRUCTION & BUILDING PRODUCTS INDUSTRY I TABLE OF KEY PERFORMANCE INDICATORS
Table Of Key Performance Indicators(KPI)
KPIs are measures of business performance. They are used to check performance against targets, or as benchmarks to
signal areas of performance in need of improvement. They are, therefore, measures of a firm’s Critical Success Factors
(CSF).
In any enterprise there may be dozens of CSFs and literally hundreds of KPIs to track their performance. Which ones are
significant for any particular firm at any particular time depends on what the business is planning to achieve and what its
current situation is, so a SWOT (Strengths, Weaknesses, Opportunities, Threats) paradigm provides a way of classifying
CSFs as in the Table below.
FACTOR
EXAMPLE KPIS
1.Percentage of seats filled for a theater
2.Number of consulting hours sold for a services firm
MONITORING OPERATING STRENGTH: those factors
that are the basis of continuing successful performance
3.Return on investment
1.Market share
CORRECTING FOR WEAKNESSES: factors that need to
improve to maintain the viability of the business
2.Value of sales per salesperson
3.Inventory turnover rate
1.Productivity rate
SEEKING OPPORTUNITIES: those operations in which
an improvement could lead to bigger market share or
improved sales
2.Time to market
3.Investment in R&D
1.Cash flow
ADDRESSING THREATS: those that are providing an
immediate or longer term threat to viability
Venkata Gubur
2.Rate of new customer acquisition
3.Liability claims
Senior Executive Vice President –DS Construction (Libya)
1
2. CONSTRUCTION & BUILDING PRODUCTS INDUSTRY I TABLE OF KEY PERFORMANCE INDICATORS
As is apparent the set of KPIs that might be relevant to any one CSF can be drawn from a number of processes –
eliminating a weakness factor might involve improving sales per salesperson, decreasing invoicing errors, improving
safety record, and so on.
How you decide on which KPIs to track and act on depends on:
1.Industry Knowledge: What are the numbers that must be on track in a particular industry and where does the firm
under review rate with regard to industry averages? What is happening in the industry that will have an effect on the
firm’s viability?
2.Business Plan Objectives: A business plan based on a strategic planning exercise will provide the key objectives for the
next planning period and so determine which CSFs to focus on.
3.Targeting Selected Drivers: since it is unusual that all the drivers of any one CSF can be acted on at once it is necessary
to decide which to concentrate on to achieve the stated objective. For example, increasing the customer satisfaction score
could involve a range of drivers such as greater customer contact, reduced delivery errors, better installation procedures,
and product design improvement. These become your KPIs for measuring how the process is going.
Following is a very comprehensive set of KPIs arranged on a business process model - products and services, sales and
marketing, finance etc. Each KPI is followed by the type of measure that can be applied, a length of time, a dollar cost etc.
Venkata Gubur
Senior Executive Vice President –DS Construction (Libya)
2
3. CONSTRUCTION & BUILDING PRODUCTS INDUSTRY I TABLE OF KEY PERFORMANCE INDICATORS
TABLE 1. MOST COMMONLY USED KPIS
BUSINESS AREA
CRITICAL SUCCESS FACTOR
KPIS
Employee productivity
Output per employee (#, $)
Inventory control
Inventory turnover ratio (%)
Production efficiency
Manufacturing lead time (time)
Service quality management
1.Cost for administrative error /
management revenues ($)
PRODUCTS AND SERVICES
2.On time delivery (%)
Customer activity
Customer satisfaction
Satisfied customer index (#)
Customer service
Time spent on customer relations
(time)
Market penetration
Market share (%)
Sales operations
MARKETING AND SALES
Number of customers (#)
1. Direct contact with customers per
period (#, time)
2. Sales closed / sales contracts (%)
Sales volume
Annual sales per customer ($)
1.Absentee rate (time)
Employee satisfaction
2.Leadership index (#)
3.Satisfied employee index (#)
4.Turnover of full time employees (#)
PEOPLE
1.Training time per employee (time)
Training and development
2.Training investment per annum
(total $)
3.Training investment per customer
($)
Information technology
Investment in IT ($)
Occupational health and safety
Days lost to injury (time
Sales and credit system
Average collection function expense
per customer ($)
Administrative services costs
Administrative costs ($)
Cash management
Cash flow
SYSTEMS AND PROCESSES
1.Gross margin ($)
FINANCE
Venkata Gubur
Income
2.Profits per employee (%)
3.Profits to total assets (%)
Senior Executive Vice President –DS Construction (Libya)
3
4. CONSTRUCTION & BUILDING PRODUCTS INDUSTRY I TABLE OF KEY PERFORMANCE INDICATORS
1.Revenues per employee ($)
2.Revenues to total assets (%)
Revenue
Yields
Venkata Gubur
3.Revenues resulting from new
business operations
Return on investment ($)
Senior Executive Vice President –DS Construction (Libya)
4
5. CONSTRUCTION & BUILDING PRODUCTS INDUSTRY I TABLE OF KEY PERFORMANCE INDICATORS
TABLE 2. DETAILED LIST OF KPIS
CULTURE
Employee satisfaction
Absentee rate of team members (%)
Workdays missed (#)
Turnover of full time permanent employees (%)
Turnover of all employees (%)
Average length of service for employees (time)
Employee suggestions implemented (#, %)
Employee participation in stock ownership plans or other employer
related activities (#, %)
Employee satisfaction ratings, which might include questions on some
or all of the following matters:
–
Employee confidence in leadership
–
Employee perception of climate for process improvement
–
Employee perception of fair treatment
–
Employee perception of open communications
–
Employee perception of recognition/reward
–
Employee perception of safety climate
–
Employee perception of supervision
–
Employee perception of teamwork
–
Goal clarity
–
Perceived alignment of systems (reward, communication,
performance management, succession, development, etc.) with
strategy
Empowerment index (#)
Frequency of performance evaluations
Leadership index (#)
Motivation index (#)
Number of employee suggestions submitted during the period
Percentage of offers to prospective employees that are accepted
Satisfied employee index (#)
Community
Accidents or injuries resulting from the company’s products or services
(#,$)
Community groups or projects sponsored (#)
Litigation or regulatory expenses as a percent of sales
Money or employee hours donated to community events (time,$)
Venkata Gubur
Senior Executive Vice President –DS Construction (Libya)
5
6. CONSTRUCTION & BUILDING PRODUCTS INDUSTRY I TABLE OF KEY PERFORMANCE INDICATORS
Percent of raw materials from renewable sources
PRODUCTS AND SERVICES
Cycle time
Order to delivery time (time, % of standard)
Employee productivity
Absentee rate (time / period)
Average hours worked per week (time)
Output per employee ($, #)
Production per employee (for example, chargeable hours per team
member in a professional service firm, contacts per salesperson)
Productivity statistics per employee by department
Sales per employee ($)
Sick days taken per employee (#/period)
Value added per employee (production costs net of those paid to
outside suppliers)
Inventory control
Average number of days finished goods on hand (time)
Days in inventory (time)
Inventory turnover ratio (%)
Ratio of slow moving inventory to total inventory (%)
Product mix
New products to total products (%)
New products (less than 2 years old) to full company catalogue (%)
New products (less than 2 years old) to product family (%)
Variety of products (#)
Product quality management
Completeness of manufacturing transfer package from R&D
Cost of rejected materials ($)
Customer complaints (or claims) per day or product (#)
Customer complaints due to damaged shipments (%)
Customer complaints caused by substandard materials or parts (%)
Damage claims per shipment ($)
Damage to in-storage products by employees (#, $)
First pass yield (#)
Inventory shrinkage as a percent of production or cost of sales
personnel
Mean time between failures (time)
Defect rate (#, %)
Discrepancies with product handling and storage policies and
Venkata Gubur
Senior Executive Vice President –DS Construction (Libya)
6
7. CONSTRUCTION & BUILDING PRODUCTS INDUSTRY I TABLE OF KEY PERFORMANCE INDICATORS
procedures (#)
Improvement recommendations by vendor implemented during the
period (#)
Parts or vendors on ship to stock (#)
Returns by customers (#)
Returns by customer due to damaged shipments (#, %)
Service calls or amount of follow up service required by customers (#)
Parts per volume accepted (%)
Problem free installs on first attempt (%)
Products meeting specifications (%)
Damage free shipments (%)
Good components in final assembly (%)
Production or service errors reported (#)
Quality improvement (%)
Reissues (#, %)
Reject rates (%)
Rework as a percentage of total production (%)
Rework cost as percentage of production cost (%)
Rework cost or rate (e.g., number/percentage of off spec products)
Rework time (time)
Total downtime or process stoppages due to process problems (such
as machine breakdowns or unavailable personnel)
Total units of rework (#)
Warranty claims per week (#/time)
Warranty costs ($)
Warranty expense ($)
Waste or scrap as a percent of total materials used (%)
Production efficiency
Average days (hours) late divided by total production days (hours)
Average overtime hours per employee
Average production costs per unit
Average time incurred per product
Batch size
Common parts
Completeness of manufacturing transfer package from R&D
Current backlog of orders
Cycle time
Frequency of out of stock occurrences
Frequency of production delays due to equipment failure
Venkata Gubur
Senior Executive Vice President –DS Construction (Libya)
7
8. CONSTRUCTION & BUILDING PRODUCTS INDUSTRY I TABLE OF KEY PERFORMANCE INDICATORS
Frequency of production delays due to substandard materials or parts
Frequency of production shut downs or delays due to inventory
shortages
Function points/employee month (#)
Idle or non-productive time as a percent of total time (%)
Incoming inspection
Inspection time
Labor utilization rates
Machine breakdowns per week (or day)
Machine downtime per week (or day)
Manufacturing lead time
Margin Opportunity Analysis Index (e.g., optimum production
scheduling)
Measures of timeliness
Numbers of products using common processes (flexibility of production
process design)
Order processing time
Percentage of machine uptime per week
Planned versus actual throughputs
Production processing time
Quoted lead times
Ratio of approved to submitted orders
Response time to customer request
Setup time
Stock in excess of next 60 days needs
Stock keeping unit (SKU) numbers per inventory person
Surpluses
Testing efficiency (e.g., average of all routine tests measured in hours)
Time to market for existing products
Utilization of installation team
Production output
Actual machine output as a percentage of output specifications
Orders shipped
Production level variation by month due to seasonality
Production rate (# per period, per person, per labor hour, per machine
hour)
Total productivity factor (outputs/inputs)
Total quantities produced or total hours billed
Venkata Gubur
Senior Executive Vice President –DS Construction (Libya)
8
9. CONSTRUCTION & BUILDING PRODUCTS INDUSTRY I TABLE OF KEY PERFORMANCE INDICATORS
Production wastage
In process scrap
Scrapped inventory amounts (#)
Scrap quantity or cost ($)
Waste or scrap as a percent of total materials used (%)
Cost of rejected materials ($)
Service quality management
Average days late per late shipment (time)
Contracts filed without error (#)
Corporate performance/quality goal (%)
Corporate quality goal (#)
Cost for administrative error / management revenues ($)
Cost of quality as percentage of sales (%)
Cycle count accuracy
Delivery on-schedule (%)
Delivery of rush orders on schedule (%)
Invoice accuracy
Mean time to resolve a problem
Number of partial shipments
Number of product errors
Number of shipping errors
Number of stockouts
On time delivery (e.g., percent of shipments received by the requested
dates)
Percent of installations on time at the right location
Percentage of customer orders not on time, on spec
Planning accuracy
Rate of customers returns or billing disputes due to products shipped
but not ordered
Ratio of orders shipped accurately according to customer orders to total
orders shipped
Response time (e.g., 24 hour repairs)
Service expense/customer/contact
Service expense/customer/year
Support expense/customer ($)
Research and development – new
products
Business development expense/administrative expense
Competition (# products introduced by competitors)
Development costs (average product development costs per product)
Development speed (time to market) for new products
Venkata Gubur
Senior Executive Vice President –DS Construction (Libya)
9
10. CONSTRUCTION & BUILDING PRODUCTS INDUSTRY I TABLE OF KEY PERFORMANCE INDICATORS
Increase in major projects count of number of projects over a specified
$ value
New products introduced (#, # per person, # per period)
Patents (average. age, #pending, # received, per $ investment in R&D)
Percent of products that met customer/production needs without
requiring modification
Percent of sales or profit from products in various stages of the product
life cycle
Percent of revenue from target market segment
Percent of revenues generated from products developed in the last #
months
Rapid design changes
Rate of new products abandoned after introduction to market (number
abandoned/number initiated)
Rate of new products abandoned before introduction to market
(number abandoned/number initiated)
Ratio of new / total products
Sales or profit of new products/services as a percent of total sales or
profit
Variety of products
Volume and mix attainment to orders (responsiveness of production
process)
Research and development - investment
Average ‘update’ (R&D) expenses incurred per existing product
Average annual number of substantive changes made per existing
product
Average payback period for new products
Average product development costs per product
Industry development investment
Installation base of a particular new product or service
Investment in new product support and training ($)
Investment in new technology as a percent of sales
New market development investment ($)
Number of patents received (#)
Patents per R&D investment $ (#)
Percent of R&D projects that result in new products or services
R&D allocation by project ($)
R&D expense/administrative expense (%)
R&D invested in basic research ($)
R&D invested in processes (%)
Venkata Gubur
Senior Executive Vice President –DS Construction (Libya)
10
11. CONSTRUCTION & BUILDING PRODUCTS INDUSTRY I TABLE OF KEY PERFORMANCE INDICATORS
R&D invested in product design
R&D resources/total resources (%)
Sales or profit of new products/services as a percent of related R&D
(%)
Total research and development (R&D) expenses ($)
Supply chain management
Cost of products or services supplied ($)
Frequency of late receipts (%)
Fulfillment accuracy (Frequency of returned purchases, ratio of rejects
to total items purchased, rejects per shipment received, frequency of
wrong items received)
Open purchase orders (#, $, average age)
Complaints handled correctly on the first call (%)
Product quality (% of items received having quality related defects
Quality of features of the supplier's product or service that are critical to
the firm’s processes or needs)
Lead time (Required lead times)
Satisfaction with suppliers (can be measured through an internal survey
similar to that used for customers)
Suppliers’ dependability index (#)
Total cost of products (including freight, set up, unfavorable payment
terms, cost of excessive lead times or purchase quantities) compared
to competitors of the supplier
MARKETING AND SALES
Customer acquisition
Average sales per new customer (#)
New customers (#)
New accounts opened (#)
Prospects (#)
Prospects converted to sales (#)
Referrals (#)
Revenues from new customers/total revenues (%)
Customer activity
Average sales per repeat customer ($)
Customers (#)
New business done with repeat customers (%)
Growth in the average sales per repeat customer (%)
Share of purchases made by customers (that is, the portion of the
customers' purchases that go to the business versus their purchases
from competitors, sometimes called ‘share of wallet’)
Venkata Gubur
Senior Executive Vice President –DS Construction (Libya)
11
12. CONSTRUCTION & BUILDING PRODUCTS INDUSTRY I TABLE OF KEY PERFORMANCE INDICATORS
Customer retention
Average customer duration with company (time)
Average duration of customer relationship (time)
Customer retention rates (%)
Customer turnover rates (%)
Customers lost (# or %)
Dormant customers (for example, those who have not purchased
anything in six months)(#)
Lost business revenues compared to market average ($)
Net customer gains (#)
Repeat customers (%)
New business done with repeat customers (%)
Revenue from existing customers (%)
Ratio of customers with no sales activity in last six months to total
customers (%)
Customer satisfaction
Satisfied Customer Index: Derived from customer satisfaction surveys
that may include questions addressing any or all of the following
matters. Measured on a rating scale devised for the questionnaire:
– Brand value
– Customer intent to repurchase
– Customer perception of aesthetics
– Customer perception of availability
– Customer perception of ease to work with
– Customer perception of financing
– Customer perception of hidden or indirect costs
– Customer perception of quality of outputs
– Customer perception of reliability
– Customer perception of service (includes attributes such as timeliness,
responsiveness, understanding of needs of customer/customer's
business, quality of relationship, knowledge of the team, customer
focus, and proactivity)
– Customer perception of warranties
Partnering Index Rating established by reviewing activities related to
the amount of customer or business partner involvement in such things
as product planning, involvement in projects, investment in product and
services (e.g. information technology).
Referral customers
Separate analysis of the survey scores of the most important, valuable,
or profitable customers
– Profitability of each customer (sales and cost of sales for each
Venkata Gubur
Senior Executive Vice President –DS Construction (Libya)
12
13. CONSTRUCTION & BUILDING PRODUCTS INDUSTRY I TABLE OF KEY PERFORMANCE INDICATORS
customer)
– Percent of unprofitable customers
Customers' satisfaction with products/services as compared to
satisfaction with those of competitors
Customer complaints / orders (%)
Complaints / customers (%)
Order value of complaint items / turnover (%)
Orders not delivered on time (%)
Time spent on customer relations (average time)
Customer service
Customers per week with unsolved problems (average #)
Average response time per customer request
Average response time to solve customer problem
Customer complaints resolved (#, %)
Customer perception of ease to work with per survey
Customer complaints resolved on the first contact (#, %)
Customer problems solved within stated time frame (#, %)
Potential orders that had to be declined (#)
Delivery deadlines met (compared to either the date requested or
promised) (%)
Rate of responses exceeding specified time frame (for example, 24
hours)
Sales versus first request date
Service attributes such as timeliness, responsiveness, understanding of
needs of customer/customer's business, quality of relationship,
knowledgeable staff, customer focus, and proactivity per survey
Service quality rating per survey
Time devoted to customer service (time)
Brand recognition (percentage of potential customers who recognize
company brand based on surveys)
Market penetration
Brand recognition (that is, the percent of potential customers who know
of the company’s product or service or who think highly of it), which is
generally done through surveys
Market potential ($)
Market share (that is, the company's share of total sales in the
geographic areas in which it competes) done on a product or product
line basis ($)
Number of channels in which the product is available (#)
Number of customers (#)
Number of new customers (#)
Venkata Gubur
Senior Executive Vice President –DS Construction (Libya)
13
14. CONSTRUCTION & BUILDING PRODUCTS INDUSTRY I TABLE OF KEY PERFORMANCE INDICATORS
Percent of proposals made that were accepted (#)
Sales to new customers as a percent of total sales (%)
Marketing campaigns
Advertising or marketing budget ($)
Advertising exposure (# people per channel)
Amount of time spent with customers or potential customers (time)
Advertisements placed (#)
Industry trade shows attended (#)
Presentations made (#)
Number of times the company or its products are mentioned in
periodicals or broadcast media
Number of proposals made (#)
Public awareness of, or favorably disposed toward, the product/service
(based on surveys) (%)
Response rate (responses as a percentage of those exposed) (%)
Responses to marketing efforts (calls to the company's 800 number for
information, postage paid cards returned, website hits, average user
time spent at website) (#)
Pricing
Direct price ($)
Price relative to competition (%)
Total cost to customer (relative to competition)
Product delivery
Damage - in shipment (#, $, # of returns)
Rate of customer complaints due to damaged shipments (%)
Sales management
Additional sales made to existing customers through referrals or cross
selling
Customers/employee (#)
Gross margin per sales call
Marketing cost as a percent of sales
Marketing cost per new customer obtained
Orders per sales call
Sales mix
Growth rates by product (%)
Sales from each distribution channel (%)
Sales from each product/service or product/service line (%)
Sales from new products (%)
Sales from products whose patents will expire within a year (%)
Venkata Gubur
Senior Executive Vice President –DS Construction (Libya)
14
15. CONSTRUCTION & BUILDING PRODUCTS INDUSTRY I TABLE OF KEY PERFORMANCE INDICATORS
Sales of one product from customers who also bought a companion
product (%)
Unprofitable products/services (%)
Revenue generated from customer segments (e.g., new; affluent; large
versus small; industry; region)($)
Sales to major customers ($)
Sales operations
Average sales per salesperson ($)
Average time from customer contact to sales response
Customer time/employee attendance
Customer visits to the company (#)
Days visiting customers (#)
Direct communications to customer per period (#, time)
Direct contact with customers per period (#, time)
Field sales management
Field salespeople (#)
Frequency of market research of products
Inbound calls taken
Number of sales (or response rate) necessary to cover costs of
marketing campaigns
Outbound calls made (#)
Sales conversion (%)
Response rates from direct mail pieces and other advertising
Sales volume
Annual sale per customer ( $)
Average sale amount (per transaction) ($)
Average sales per customer (#, $)
Average sales price per unit ($)
Customer revenue list
Frequency of sales (# of sales transactions / time)
Growth rate, for each significant product or product line
Order backlog
Profitability of each product/service or product/service line ($)
Sales orders taken ($)
Sales per square foot ($)
Sales per relevant unit, broken down by geographic area or product line
Venkata Gubur
Senior Executive Vice President –DS Construction (Libya)
15
16. CONSTRUCTION & BUILDING PRODUCTS INDUSTRY I TABLE OF KEY PERFORMANCE INDICATORS
PEOPLE
Skill level
Average employee years of service with company (#)
Average years with company of full time temporary employees (#)
Company managers with advanced degrees: business (%), science
and engineering (%), liberal arts (%)
Level of information sharing, for example, number of items contributed
to a company wide databank, amount of consultation on others'
projects provided by internal experts
Employees who are trained in multiple functions within the company (#)
Employees cross trained in other tasks or departments (#)
Management personnel trained on company personnel policies and
labor laws (#)
Patents issued
Percent of employees trained in critical technologies or functions
Percentage of employees with a relevant qualification
Skills mix, based on performance appraisals, and including:
– Knowledge (product, client/customer, industry, systems,
organizational);
– Skills (financial, analytical, technical, relationship/interpersonal,
problem solving, negotiating, selling, managing); and key experiences
Training and development
Cross department (or cross functional) assignments
Training time per annum (total time, time/employee)
Training investment per annum (total $, $/employee)
Training expense/administrative expense (%)
Rate of employee participation in industry, trade, or professional
associations
Share of development hours (%)
Share of training hours (%)
Training investment/customer ($)
SYSTEMS AND PROCESSES
Accounting system
Amount of unreconciled items in bank reconciliations (#)
Average penalties paid ($)
Book to physical adjustment to total inventory ratio
Delay (number of days) from period end to report date
Amount of book to physical adjustments ($)
Effective tax rates
Frequency and amount of unreconciled items (bank reconciliations,
accounts receivable, accounts payable, fixed asset ledgers, etc.)
Venkata Gubur
Senior Executive Vice President –DS Construction (Libya)
16
17. CONSTRUCTION & BUILDING PRODUCTS INDUSTRY I TABLE OF KEY PERFORMANCE INDICATORS
Frequency of cycle counts
Frequency of other management reports (weekly sales reports, cash
reports, etc.)
Frequency of physical inventory counts
Frequency of unreconciled items in bank reconciliations
Management (user) satisfaction rate (annual survey)
Number of adjusting journal entries per period
Number of missed due dates
Number of year end audit entries
Information technology
Accuracy of information (e.g., information systems capabilities)
Average capitalized IT expenditures per person
Average downtime per IT asset
Average IT update expenditures per person
Change in IT inventory ($)
Discontinued IT inventory/IT inventory
Employee (user) satisfaction rate (annual survey)
Estimated average time (days, hours, minutes, etc.) needed to backup
Frequency of off site backups
Frequency of testing business continuation procedures
Investments in IT ($)
IT capacity (CPU & DASD)
IT capacity/employee
IT investment/salesperson
IT investment/service & support employee
IT performance/employee
Number of key systems that do not have a firm backup
Number of users required to accept system modifications
Number of users that interact with IT providers
Orphan IT inventory/IT inventory
PCs/employee (#)
Percentage of IT expenditures to related total fixed asset costs
Ratio of price paid for IT assets to price quoted (sample)
Technology training and education expenses per employee
Capacity of EDI system (#)
Upgrades to EDI system
Value of EDI system
Venkata Gubur
Senior Executive Vice President –DS Construction (Libya)
17
18. CONSTRUCTION & BUILDING PRODUCTS INDUSTRY I TABLE OF KEY PERFORMANCE INDICATORS
Occupational safety and health
Average cost per accident ($)
Average number of days required to investigate safety concern reports
(time)
Average time off per accident (time)
Average worker's compensation claim as a percentage of industry
average ($)
Days lost to injury (time)
Environmental and safety behaviors (e.g., safety training and
awareness activities, safety monitoring, near misses) (range)
Environmental and safety results (e.g., number of days with no safety
violations or environmental incidents) (#)
Frequency of employee safety training programs (time)
Number of accidents caused by inappropriate handling or storage
policies and procedures (#)
Number of accidents per week (#)
Production lost to safety violations (#)
Safety violations noted per week (#)
Total worker's compensation claims as a percentage of industry
average ($)
Sales and credit system
Average collection function expense per customer ($)
Collection function expense per customer phone call (average $)
Collection function expense per past due account over $1,000 (average
$)
Past due accounts (#, $, on average per period)
Credit limit per new account ( average $)
Credit request approval / rejection decision time (average time)
Amount over 90 days past due ($)
Final demand letters sent to customers (#,$)
New account past due receivables as a percentage of total new
account receivables
Past due amounts from major customers ($)
Credit applications accepted/rejected (%)
Past due accounts to total receivables (%)
Past due accounts with collection agencies (%)
Rate of customer complaints due to incorrect invoices and statements
#, %)
Purchasing system
Amount of emergency purchases made (#)
Average days late per shipment (time)
Venkata Gubur
Senior Executive Vice President –DS Construction (Libya)
18
19. CONSTRUCTION & BUILDING PRODUCTS INDUSTRY I TABLE OF KEY PERFORMANCE INDICATORS
Order value (average $ per order)
Comparative on-time delivery rates by vendor
Frequency and amount of unreconciled items
Frequency of purchases from unapproved vendors
Frequency of unmatched receiving reports, purchase orders, or
invoices
Instances of invoices presented when goods were accepted without a
valid purchase order
Invoices processed per person (#)
Lost early payment discounts as percentage of purchases (%)
Number of special orders processed (#)
Part numbers purchased per person (#)
Back-ordered items to total items ordered (%)
Late shipments to total shipments (%)
Percentage of vendors with both 100% on-time delivery and less than
0.5% rejects
Purchase orders placed without competitive bid (#, %)
Purchase orders processed per person (#)
Ratio of manual checks to computerized checks (%)
Ratio of number of second signatures requested to disbursements over
specified amount (when second signatures are required for
disbursements over a specified amount)
FINANCE
Accounting service - cost
Average accounting function costs per aggregated transactions
processed (such as: inventory items, vendor invoices, customer
invoices, payroll checks, vendor checks, and manual checks)
Average accounting function costs per employee
Accounts payable
Accounts payable turnover ratio
Days in payables
Accounts receivable
Accounts receivable turnover ratio
Allowance for doubtful accounts as a percentage of accounts
receivable
Average age of receivables (time)
Days sales in receivables (days sales outstanding)
Administrative service costs
Administrative costs ($)
Administrative expense/employee ($)
Venkata Gubur
Senior Executive Vice President –DS Construction (Libya)
19
20. CONSTRUCTION & BUILDING PRODUCTS INDUSTRY I TABLE OF KEY PERFORMANCE INDICATORS
Administrative expense/gross premium (%)
Administrative expense/total revenues (%)
Asset management
Amount of fixed asset losses from employee theft ($)
Asset turnover ratio
Capital efficiency
Capital investments
Average pay back period (time)
Comparison of planned to actual discount factor
Comparison of planned to actual internal rate of return
Cash management
Amount of discount offered customers for timely remittance (%)
Average balances in non-interest bearing accounts ($)
Average daily idle cash ($)
Average number of days bills are paid before due date (time)
Average time between receipt and deposit of funds (time)
Cash flow
Collection period (accounts receivable divided by sales per day)(time)
Delinquent payment penalties as a percentage of purchases (%)
Interest expense as a percentage of net capital (%)
Length of cash cycle (time from payment for raw materials to ultimate
collection of receivables from sales)
Percentage of past due payables to total payables (%)
Purchase discounts taken (#)
Ratio of customer remittances by electronic means versus by check
(%)
Ratio of interest earned to average cash balances
Ratio of actual to planned cash flows
Credit management
Average credit function expense per credit application
Average credit function expense per customer
Average credit function expense per new customer
Collection function expense as a percentage of credit sales
Credit function expense as a percentage of credit sales
Credit function expense as a percentage of new customer credit lines
Customer service cost
Service expense ($ per customer / period, $ per contact, $ per product)
Ratio of customer service function expenses to total sales (%)
Venkata Gubur
Senior Executive Vice President –DS Construction (Libya)
20
21. CONSTRUCTION & BUILDING PRODUCTS INDUSTRY I TABLE OF KEY PERFORMANCE INDICATORS
Distribution cost
Average cost per distributor ($)
Average delivery cost per truckload shipment
Delivery expense as a percentage of sales
Financial strength and flexibility
Average unused credit lines per source (#)
Credit rating
Debt ($)
Debt to assets ratio
Debt to equity ratio
Leverage ratio (DuPont formula)
Liabilities to equity ratio
Number of actual (potential) debt covenant and other violations (#)
Number of approved financial credit sources (#)
Ratio of used to total credit lines
Times interest earned
Total assets ($)
Total assets/employee ($)
Functional expenses
Activity costs ($)
Direct department expense ($)
Fixed expenses such as depreciation, real estate, and personal
property taxes ($)
Major cash expenditures ($)
Material costs as a percentage of sales (%)
Programmed expense controllable expenses including routine, one
time, and additional project expenses
Ratio of average cost overrun to average budgeted cost
Routine expense (e.g. salaries, maintenance, supplies)($)
Targeted expenses as a percentage of sales (%)
Variable versus fixed expenses (e.g., non-operating income/expense)
(%)
HR department expenses
Average HR function costs per employee ($)
Average HR function costs per paycheck processed ($)
Ratio of HR function costs to total expenses
Ratio of HR function costs to total sales
Venkata Gubur
Senior Executive Vice President –DS Construction (Libya)
21
22. CONSTRUCTION & BUILDING PRODUCTS INDUSTRY I TABLE OF KEY PERFORMANCE INDICATORS
Income
Gross margin (%)
Net income ($)
Net income margin (%)
Profits as a percentage of sales (%)
Profits resulting from new business operations ($)
Profits per employee (%)
Profits to total assets (%)
Return on net sales
Revenue/expense ratio
Interest
Ratio of actual average borrowing rate to current market rate
Information technology cost
IT development expense/IT expense (%)
IT expense/administrative expense (%)
IT expense/employee ($)
IT expenses on training/IT expense (%)
Liquidity
Available working capital ($)
Cash from operations as a percentage of sales (%)
Current ratio
Inventory or receivables as a percentage of working capital (%)
Liquid assets ($)
Quick ratio
Maintenance costs
Average preventive maintenance costs per asset ($)
Percentage of preventive maintenance costs to total maintenance costs
(%)
Marketing costs
Average marketing (and sales) expenses per customer ($)
Average marketing (and sales) expenses per salesman ($)
Marketing (and sales) expenses as a percentage of new customer
sales (%)
Marketing (and sales) expenses as a percentage of sales (%)
Overhead
Allocated expenses overhead that is reallocated to business units
Operating expenses as a percentage of net sales (%)
Overhead (burden) rate
Venkata Gubur
Senior Executive Vice President –DS Construction (Libya)
22
23. CONSTRUCTION & BUILDING PRODUCTS INDUSTRY I TABLE OF KEY PERFORMANCE INDICATORS
Other costs
Bad debt expense as a percentage of net credit sales (%)
Net retained expense ($)
Non operating income/expense financial impact not directly related to
current operations
One time, truly nonrecurring expenditures
Warranty costs as percentage of sales (%)
Production costs
Cost of product ($)
Cost per transaction ($)
Cost versus competitors' cost ($)
Indirect cost as a percent of sales (%)
Inventory, labor and overhead per SKU (stock keeping unit) number
Inventory shrinkage as a percent of production or cost of sales (%)
Material price variances
Non-product related expense/customer/year ($)
Price paid (per length, weight etc.) for raw materials ($)
Production costs per employee ($)
Rate of cost reduction
Ratio of inventory $ to inventory labor and overhead dollars
Ratio of price paid to price quoted
Unit cost versus competition
Revenue
Revenue per salary $
Revenues resulting from new business operations ($)
Revenues per employee ($)
Revenues to total assets (%)
Sales per square foot (of retail space) ($)
Same store sales ($)
Sales per employee ($)
Risk management
Average and total deductibles per asset class and location
Average insurance premium per $1,000 of coverage (by type of
insurance)
Company portion of claims to total claims (%)
Percentage of covered estimated exposure to maximum estimated
exposure (%)
Weighted average ‘Best’ rating of insurers
Venkata Gubur
Senior Executive Vice President –DS Construction (Libya)
23
24. CONSTRUCTION & BUILDING PRODUCTS INDUSTRY I TABLE OF KEY PERFORMANCE INDICATORS
Shareholder value
Compound growth rate (%)
Dividends ($)
Market value ($)
Shareholder loyalty (e.g. switching behavior)
Shareholder mix (institutional versus individual; employee; other)
Stock price, appreciation ($)
Value added
Breakeven time
EVA (Economic Value Added)
MVA (Market Value Added)
Value added/employee ($)
Value added/IT employees ($)
Wages / benefits
Compensation expense per employee ($)
$ amount of claims (health and W/C) per employee
Ratio of average annual percentage salary increase to percentage
increase in cost of living
Ratio of benefit costs to total compensation
Ratio of compensation expense to sales
Ratio of employee’s to employer's share of health care costs
Top five types ($) of health insurance claims
Yields
Return on assets ratio
Return on equity ratio
Return on equity (DuPont formula with leverage factor)
Return on net asset value (%)
Return on net assets resulting from new business operations ($)
ROCE (Return on Capital Employed)
ROI (Return on Investment)
Venkata Gubur
Senior Executive Vice President –DS Construction (Libya)
24