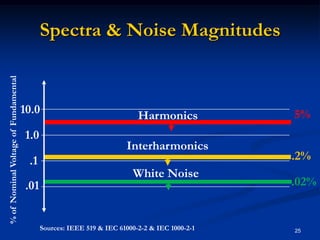
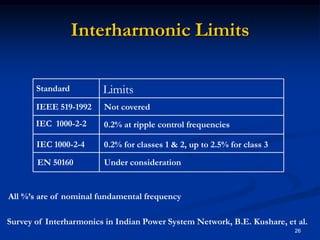
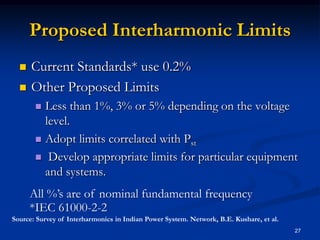
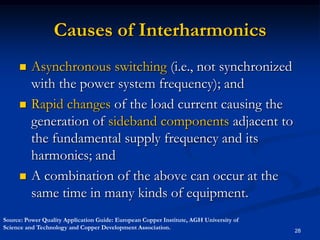
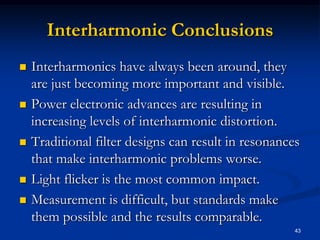
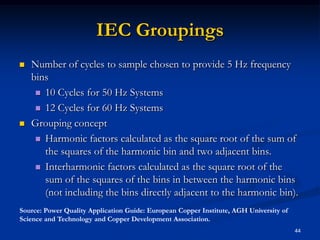
This document provides an overview of harmonics and interharmonics, including their definitions, causes, impacts, and measurement. Interharmonics are frequencies that are not integer multiples of the fundamental power system frequency. They can be caused by non-linear and time-varying loads like variable speed drives, arc furnaces, and cycloconverters. Interharmonics can cause issues like light flicker and equipment heating. While difficult to measure due to their non-periodic nature, standards like IEC 61000-4-7 define methods to quantify interharmonics through frequency groupings. Understanding interharmonics is increasingly important as power electronics continue to generate more interharmonic distortion on power systems.
Harmonic study and analysisHarmonic study and analysisHarmonic study and analysisHarmonic study and analysisHarmonic study and analysisHarmonic study and analysisHarmonic study and analysisHarmonic study and analysisHarmonic study and analysisHarmonic study and analysisHarmonic study and analysisHarmonic study and analysisHarmonic study and analysisHarmonic study and analysisHarmonic study and analysisHarmonic study and analysisHarmonic study and analysisHarmonic study and analysisHarmonic study and analysisHarmonic study and analysisHarmonic study and analysisHarmonic study and analysisHarmonic study and analysisHarmonic study and analysisHarmonic study and analysisHarmonic study and analysisHarmonic study and analysisHarmonic study and analysisHarmonic study and analysisHarmonic study and analysisHarmonic study and analysisHarmonic study and analysisHarmonic study and analysisHarmonic study and analysisHarmonic study and analysisHarmonic study and analysisHarmonic study and analysisHarmonic study and analysis
These slides present an introduction to load flow analysis for distribution system. Later the detail algorithm, matlab coding and application to IEEE radial distribution system will be subsequently provided.
Highlights:
* Analyses studies to identify problems created by adverse power quality.
* Describes the equipment needed to mitigate the problems.
* Presents estimates of the associated costs.
* Reliability is the critical concern, followed by voltage dips.
* Solutions involve changes to the grid, the customer’s system or the equipment causing the problem.
Introduction
PMU requirements
Synchrophasor Estimation Algorithms
Example of DFT‐based synchrophasor estimation
Implementation
Experimental validation
Conclusions
Introduction
Drivers
Evolution of the whole power systems infrastructure
major changes in their operational procedures;
need of advanced and smarter tools to manage the increasing complexity of the grid;
main involved aspect is the network monitoring by means of Phasor Measurement Units (PMUs);
A power quality presentation includes definitions of power quality, most common power quality problems and the solutions, standard carves, and practical example of an active filter. Presented by - Eng. Shemy Elhady
he main purpose of transient stability studies is to determineThe main purpose of transient stability studies is to determine
whether a system will remain in synchronism following major
disturbances such as transmission system faults, sudden load
changes, loss of generating units, or line switching.
Applications of power electronics in HVDCKabilesh K
Role of Power electronics in HVDC and Transmission system. What are the components of Power electronics used in HVDC. Types of HVDC Links. Advantages of HVDC over HVAC.
Network Modelling for Harmonic Studies
Introduction
Study Domain and Modelling Approaches
Classical Network Element Models
Power Electronic Based Network Element Models
General Considerations for Harmonic Studies
Conclusions
As PSS®E continues to evolve, one of our primary concerns is to ensure backward compatibility so
that current studies can be transferred to the latest program release with minimum disruption. With
each new release of PSS®E, dynamic simulation users need to recompile their connection subroutines
if they are still needed, and user-written models, and relink them into the new uesr model
libraries.
While the vast majority of program Line Mode dialog remains unchanged, the introduction of new
program features can affect this dialog. Accordingly, it is recommended that the first use in a new
program release of any existing Response File or IPLAN program be monitored closely to ensure
that it performs as intended. The version activity can be used to direct the line mode interpreter
(LMI) to accept responses for earlier versions of the line mode dialog, back to version 29. Please
note that API commands will nearly always be backward comapatible, in batch command or Python
form.
The following sections discuss compatibility issues pertaining to the last several releases of
PSS®E. These sections include summaries of the program corrections that were implemented in
the corresponding major PSS®E release and any point releases. Starting with PSS®E-29, new
program features are summarized. Users upgrading from a release earlier than the one immediately
preceding the current release are strongly encouraged to review the notes below pertaining to all
intervening program releases.
Power System Analysis was a core subject for Electrical & Electronics Engineering, Based On Anna University Syllabus. The Whole Subject was there in this document.
Share with it ur friends & Follow me for more updates.!
Small-Signal (or Small Disturbance) Stability is the ability of a power system to maintain synchronism when subjected to small disturbances
such disturbances occur continually on the system due to small variations in loads and generation
disturbance considered sufficiently small if linearization of system equations is permissible for analysis
Corresponds to Liapunov's first method of stability analysis
Small-signal analysis using powerful linear analysis techniques provides valuable information about the inherent dynamic characteristics of the power system and assists in its robust design
Mitigation of Voltage Sag/Swell with Fuzzy Control Reduced Rating DVRIJERD Editor
Power quality has been an issue that is becoming increasingly pivotal in industrial electricity
consumers point of view in recent times. Modern industries employ Sensitive power electronic equipments,
control devices and non-linear loads as part of automated processes to increase energy efficiency and
productivity. Voltage disturbances are the most common power quality problem due to this the use of a large
numbers of sophisticated and sensitive electronic equipment in industrial systems is increased. This paper
discusses the design and simulation of dynamic voltage restorer for improvement of power quality and
reduce the harmonics distortion of sensitive loads. Power quality problem is occurring at non-standard
voltage, current and frequency. Electronic devices are very sensitive loads. In power system voltage sag,
swell, flicker and harmonics are some of the problem to the sensitive load. The compensation capability
of a DVR depends primarily on the maximum voltage injection ability and the amount of stored
energy available within the restorer. This device is connected in series with the distribution feeder at
medium voltage. A fuzzy logic control is used to produce the gate pulses for control circuit of DVR and the
circuit is simulated by using MATLAB/SIMULINK software.
Power Quality is a combination of Voltage profile, Frequency profile, Harmonics contain and reliability of power supply.
The Power Quality is defined as the degree to which the power supply approaches the ideal case of stable, uninterrupted, zero distortion and disturbance free supply.
Injection of the wind power into an electric grid affects the power quality. The performance of the wind turbine and thereby power quality are determined on the basis of measurements and the norms followed according to the guideline specified in International Electro-technical Commission standard, IEC-61400. The influence of the wind turbine in the grid system concerning the power quality measurements are-the active power, reactive power, variation of voltage, flicker, harmonics, and electrical behavior of switching operation and these are measured according to national/international guidelines. The paper study demonstrates the power quality problem due to installation of wind turbine with the grid. In this proposed scheme STATic COMpensator (STATCOM) is connected at a point of common coupling with a battery energy storage system (BESS) to mitigate the power quality issues. The battery energy storage is integrated to sustain the real power source under fluctuating wind power. The STATCOM control scheme for the grid connected wind energy generation system for power quality improvement is simulated using MATLAB/SIMULINK in power system block set. The effectiveness of the proposed scheme relives the main supply source from the reactive power demand of the load and the induction generator. The development of the grid co-ordination rule and the scheme for improvement in power quality norms as per IEC-standard on the grid has been presented.
Harmonics create pollution in our power system just like carbon dioxide and other gases create air pollution. It has adverse effects directly or indirectly on equipment like motors, transformers, induction heaters, etc. It leads to energy loss due to poor power factor.
Following content has been covered:
- The definition of harmonics is briefly interpreted.
- Factors which are responsible for harmonics current generation is discussed.
- Often the failure of equipment like motors, transformer, etc. has been put on harmonics current. But this is not always the case. This ambiguity is being tried to clear by putting content "What harmonics are not"? so that readers who are associated with operation and maintenance can efficiently do analysis and find the root cause of failure of equipment.
- IEEE Std. 519-1992, 2014 has been interpreted.
International Journal of Computational Engineering Research(IJCER)ijceronline
International Journal of Computational Engineering Research(IJCER) is an intentional online Journal in English monthly publishing journal. This Journal publish original research work that contributes significantly to further the scientific knowledge in engineering and Technology.
The global electric power infrastructure is undergoing a dramatic change from a load-following architecture to one that requires improved control and monitoring of the energy usage. Integration of inherently intermittent renewable resources requires improved ability to offset demand in order to leverage this intermittency. Demand Response (DR) initiative as well as other load shedding efforts are being implemented throughout the country to allow some control of the aggregate electric loads to reduce peak demand. Enhanced monitoring of the transmission and distribution grid, as well as the electricity consumption at load level, is desired to allow further control and deferral of non-essential loads during a DR event as well as to facilitate energy conservation.
In my talk, two distinct, but related projects will be presented. The first project is about a stick-on wireless submetering system that is designed to measure and report electricity usage from circuit breaker panels in residential and commercial settings. The second project is related to the development of an energy harvesting enabled, wireless sensor node for the condition monitoring of the Smart Grid.
Harmonic study and analysis Harmonic study and analysisHarmonic study and analysisHarmonic study and analysisHarmonic study and analysisHarmonic study and analysisHarmonic study and analysisHarmonic study and analysisHarmonic study and analysisHarmonic study and analysisHarmonic study and analysisHarmonic study and analysisHarmonic study and analysisHarmonic study and analysisHarmonic study and analysisHarmonic study and analysisHarmonic study and analysisHarmonic study and analysisHarmonic study and analysisHarmonic study and analysisHarmonic study and analysisHarmonic study and analysisHarmonic study and analysisHarmonic study and analysisHarmonic study and analysisHarmonic study and analysisHarmonic study and analysisHarmonic study and analysisHarmonic study and analysisHarmonic study and analysisHarmonic study and analysisHarmonic study and analysisHarmonic study and analysisHarmonic study and analysisHarmonic study and analysisHarmonic study and analysisHarmonic study and analysisHarmonic study and analysisHarmonic study and analysisHarmonic study and analysisHarmonic study and analysisHarmonic study and analysisHarmonic study and analysisHarmonic study and analysisHarmonic study and analysisHarmonic study and analysisHarmonic study and analysisHarmonic study and analysisHarmonic study and analysisHarmonic study and analysisHarmonic study and analysisHarmonic study and analysisHarmonic study and analysis
GraphRAG is All You need? LLM & Knowledge GraphGuy Korland
Guy Korland, CEO and Co-founder of FalkorDB, will review two articles on the integration of language models with knowledge graphs.
1. Unifying Large Language Models and Knowledge Graphs: A Roadmap.
https://arxiv.org/abs/2306.08302
2. Microsoft Research's GraphRAG paper and a review paper on various uses of knowledge graphs:
https://www.microsoft.com/en-us/research/blog/graphrag-unlocking-llm-discovery-on-narrative-private-data/
Alt. GDG Cloud Southlake #33: Boule & Rebala: Effective AppSec in SDLC using ...James Anderson
Effective Application Security in Software Delivery lifecycle using Deployment Firewall and DBOM
The modern software delivery process (or the CI/CD process) includes many tools, distributed teams, open-source code, and cloud platforms. Constant focus on speed to release software to market, along with the traditional slow and manual security checks has caused gaps in continuous security as an important piece in the software supply chain. Today organizations feel more susceptible to external and internal cyber threats due to the vast attack surface in their applications supply chain and the lack of end-to-end governance and risk management.
The software team must secure its software delivery process to avoid vulnerability and security breaches. This needs to be achieved with existing tool chains and without extensive rework of the delivery processes. This talk will present strategies and techniques for providing visibility into the true risk of the existing vulnerabilities, preventing the introduction of security issues in the software, resolving vulnerabilities in production environments quickly, and capturing the deployment bill of materials (DBOM).
Speakers:
Bob Boule
Robert Boule is a technology enthusiast with PASSION for technology and making things work along with a knack for helping others understand how things work. He comes with around 20 years of solution engineering experience in application security, software continuous delivery, and SaaS platforms. He is known for his dynamic presentations in CI/CD and application security integrated in software delivery lifecycle.
Gopinath Rebala
Gopinath Rebala is the CTO of OpsMx, where he has overall responsibility for the machine learning and data processing architectures for Secure Software Delivery. Gopi also has a strong connection with our customers, leading design and architecture for strategic implementations. Gopi is a frequent speaker and well-known leader in continuous delivery and integrating security into software delivery.
Why You Should Replace Windows 11 with Nitrux Linux 3.5.0 for enhanced perfor...SOFTTECHHUB
The choice of an operating system plays a pivotal role in shaping our computing experience. For decades, Microsoft's Windows has dominated the market, offering a familiar and widely adopted platform for personal and professional use. However, as technological advancements continue to push the boundaries of innovation, alternative operating systems have emerged, challenging the status quo and offering users a fresh perspective on computing.
One such alternative that has garnered significant attention and acclaim is Nitrux Linux 3.5.0, a sleek, powerful, and user-friendly Linux distribution that promises to redefine the way we interact with our devices. With its focus on performance, security, and customization, Nitrux Linux presents a compelling case for those seeking to break free from the constraints of proprietary software and embrace the freedom and flexibility of open-source computing.
How to Get CNIC Information System with Paksim Ga.pptxdanishmna97
Pakdata Cf is a groundbreaking system designed to streamline and facilitate access to CNIC information. This innovative platform leverages advanced technology to provide users with efficient and secure access to their CNIC details.
Removing Uninteresting Bytes in Software FuzzingAftab Hussain
Imagine a world where software fuzzing, the process of mutating bytes in test seeds to uncover hidden and erroneous program behaviors, becomes faster and more effective. A lot depends on the initial seeds, which can significantly dictate the trajectory of a fuzzing campaign, particularly in terms of how long it takes to uncover interesting behaviour in your code. We introduce DIAR, a technique designed to speedup fuzzing campaigns by pinpointing and eliminating those uninteresting bytes in the seeds. Picture this: instead of wasting valuable resources on meaningless mutations in large, bloated seeds, DIAR removes the unnecessary bytes, streamlining the entire process.
In this work, we equipped AFL, a popular fuzzer, with DIAR and examined two critical Linux libraries -- Libxml's xmllint, a tool for parsing xml documents, and Binutil's readelf, an essential debugging and security analysis command-line tool used to display detailed information about ELF (Executable and Linkable Format). Our preliminary results show that AFL+DIAR does not only discover new paths more quickly but also achieves higher coverage overall. This work thus showcases how starting with lean and optimized seeds can lead to faster, more comprehensive fuzzing campaigns -- and DIAR helps you find such seeds.
- These are slides of the talk given at IEEE International Conference on Software Testing Verification and Validation Workshop, ICSTW 2022.
Threats to mobile devices are more prevalent and increasing in scope and complexity. Users of mobile devices desire to take full advantage of the features
available on those devices, but many of the features provide convenience and capability but sacrifice security. This best practices guide outlines steps the users can take to better protect personal devices and information.
Pushing the limits of ePRTC: 100ns holdover for 100 daysAdtran
At WSTS 2024, Alon Stern explored the topic of parametric holdover and explained how recent research findings can be implemented in real-world PNT networks to achieve 100 nanoseconds of accuracy for up to 100 days.
Dr. Sean Tan, Head of Data Science, Changi Airport Group
Discover how Changi Airport Group (CAG) leverages graph technologies and generative AI to revolutionize their search capabilities. This session delves into the unique search needs of CAG’s diverse passengers and customers, showcasing how graph data structures enhance the accuracy and relevance of AI-generated search results, mitigating the risk of “hallucinations” and improving the overall customer journey.
The Art of the Pitch: WordPress Relationships and SalesLaura Byrne
Clients don’t know what they don’t know. What web solutions are right for them? How does WordPress come into the picture? How do you make sure you understand scope and timeline? What do you do if sometime changes?
All these questions and more will be explored as we talk about matching clients’ needs with what your agency offers without pulling teeth or pulling your hair out. Practical tips, and strategies for successful relationship building that leads to closing the deal.
UiPath Test Automation using UiPath Test Suite series, part 6DianaGray10
Welcome to UiPath Test Automation using UiPath Test Suite series part 6. In this session, we will cover Test Automation with generative AI and Open AI.
UiPath Test Automation with generative AI and Open AI webinar offers an in-depth exploration of leveraging cutting-edge technologies for test automation within the UiPath platform. Attendees will delve into the integration of generative AI, a test automation solution, with Open AI advanced natural language processing capabilities.
Throughout the session, participants will discover how this synergy empowers testers to automate repetitive tasks, enhance testing accuracy, and expedite the software testing life cycle. Topics covered include the seamless integration process, practical use cases, and the benefits of harnessing AI-driven automation for UiPath testing initiatives. By attending this webinar, testers, and automation professionals can gain valuable insights into harnessing the power of AI to optimize their test automation workflows within the UiPath ecosystem, ultimately driving efficiency and quality in software development processes.
What will you get from this session?
1. Insights into integrating generative AI.
2. Understanding how this integration enhances test automation within the UiPath platform
3. Practical demonstrations
4. Exploration of real-world use cases illustrating the benefits of AI-driven test automation for UiPath
Topics covered:
What is generative AI
Test Automation with generative AI and Open AI.
UiPath integration with generative AI
Speaker:
Deepak Rai, Automation Practice Lead, Boundaryless Group and UiPath MVP
Encryption in Microsoft 365 - ExpertsLive Netherlands 2024Albert Hoitingh
In this session I delve into the encryption technology used in Microsoft 365 and Microsoft Purview. Including the concepts of Customer Key and Double Key Encryption.
Climate Impact of Software Testing at Nordic Testing DaysKari Kakkonen
My slides at Nordic Testing Days 6.6.2024
Climate impact / sustainability of software testing discussed on the talk. ICT and testing must carry their part of global responsibility to help with the climat warming. We can minimize the carbon footprint but we can also have a carbon handprint, a positive impact on the climate. Quality characteristics can be added with sustainability, and then measured continuously. Test environments can be used less, and in smaller scale and on demand. Test techniques can be used in optimizing or minimizing number of tests. Test automation can be used to speed up testing.
2. Overview Brief overview on harmonics and periodicity Fourier’s Method and the DFT Interharmonic Defined Picket-Fence Effect & Spectral Leakage Genuine & Non-Genuine Interharmonics Interharmonic standards and allowed limits Sources of Interharmonics Interharmonic Problems Measuring Interharmonics IEC Grouping Standard and Understanding Spectra Measurements 2
3. Sinusoids Sinusoids are the basic building block of all periodic signals. Periodic waveforms are comprised of component sinusoids having distinct frequencies. This includes distorted periodic waveforms. 3
4. Fourier 1822, a French mathematician named Joseph Fourier, claimed that continuous periodic signals can be represented by the sum of properly chosen sinusoids. 4
6. Fourier Tool Kit 6 The Scientist and Engineer's Guide to Digital Signal ProcessingBy Steven W. Smith, Ph.D.
7. Assumptions in Applying DFTfor PQ Measurements The signal is strictly periodic and stationary. The sampling frequency is an integer multiple of the fundamental. The sample frequency is at least twice the highest frequency being measured. 7
8. Non-Stationary Signal 8 DFT Window Source: A Notebook Compiled While Reading Understanding Digital Signal Processing by Lyons 2Pi
9. Non-periodic Signal DFT Window Half a sinusoid In time domain Source: A Notebook Compiled While Reading Understanding Digital Signal Processing by Lyons Spectral Leakage in the frequency domain 9
10. What is Harmonic Spectra? Harmonic spectra includes sub-harmonics, harmonics and interharmonics. 10 f = n f1 where n is an integer > 0. Harmonic f = nf1 where n is an integer > 0. Interharmonic 0 < f < f1 Subharmonic f1= fundamental frequency Source: Power Quality Application Guide: European Copper Institute, AGH University of Science and Technology and Copper Development Association.
11. Harmonic Spectra Characteristic Harmonics “Those harmonics produced by semiconductor converter equipment in the course of normal operation. In a six-pulse converter, the characteristic harmonics are the non-triple odd harmonics, for example, the 5th, 7th, llth, 13th, etc.” 11 Source: IEEE 519
12. Harmonic Spectra (cont.) Non-Characteristic Harmonics “Harmonics that are not produced by semiconductor converter equipment in the course of normal operation. These may be a result of beat frequencies; a demodulation of characteristic harmonics and the fundamental; or an imbalance in the ac power system, asymmetrical delay angle, or cycloconverter operation.” 12 Source: IEEE 519
13. Interharmonics Interharmonics- “Between the harmonics of the power frequency voltage and current, further frequencies can be observed which are not an integer of the fundamental. They can appear as discrete frequencies or as a wide-band spectrum.” Source: IEC 61000-2-1 13
18. Expanded DFT Window In order to see interharmonics the DFT window must be larger than one cycle of the fundamental frequency. 18 Source: Interharmonics: basic concepts & techniques for their detection & measurement, Chun Li, et al.
19. The Fundamental with Harmonics 19 DFT Window 60 180 300 Time 60 Hz-Fundamental Frequency 180 Hz-Third Harmonic 16.67 ms 300 Hz-Fifth Harmonic 19
20. A Genuine Interharmonic DFT Window Genuine Interharmonic Magnitude 60 90 Frequency (Hz) Source: Interharmonics: Theory and Modeling, IEEE Task Force on Harmonics Modeling and Simulation 33.34 ms The 60 Hz component competes 2 cycles within the DFT window. 60 Hz 90Hz The 90 Hz component completes 3 cycles within the DFT window. 20
21. Non-Genuine Interharmonics 21 DFT Window Non-Genuine Interharmonics (Black) Magnitude Source: Interharmonics: Theory and Modeling, IEEE Task Force on Harmonics Modeling and Simulation 33.34 ms 60 90 120 150 180 Frequency (Hz) 60 Hz The 60 Hz component completes two cycles within the DFT window. 100 Hz The 100 Hz component completes 3.33 cycles within DFT window.
22. DFT Assumes Signal Repetitive Discontinuities Magnitude Time DFT Window Source: Oppenheim, et al. “Discrete-Time Signal Processing” Frequency Domain 22 Time Domain
23. Determining if Interharmonics Are Real The voltage and current spectral components should show correlation. If the magnitude of the signal appears modulated, it is highly likely that the signal contains interharmonics. Interharmonics usually coexist with harmonics. If the signal is substantially non-varying or stationary, a longer DFT window can improve the frequency resolution. 23 Source: Interharmonics: basic concepts & techniques for their detection & measurement, Chun Li, et al.
24. Interharmonics The main reason for lack of interharmonic concerns is that interharmonics are produced by relatively few types of loads, unlike harmonics. 24 Survey of Interharmonics in Indian Power System Network, B.E. Kushare, et al.
25. Spectra & Noise Magnitudes 25 5% Harmonics 10.0 Interharmonics 1.0 % of Nominal Voltage of Fundamental .2% .1 White Noise .02% .01 Sources: IEEE 519 & IEC 61000-2-2 & IEC 1000-2-1
26. Interharmonic Limits 26 Limits Standard IEEE 519-1992 Not covered IEC 1000-2-2 0.2% at ripple control frequencies IEC 1000-2-4 0.2% for classes 1 & 2, up to 2.5% for class 3 EN 50160 Under consideration All %’s are of nominal fundamental frequency Survey of Interharmonics in Indian Power System Network, B.E. Kushare, et al.
27. Proposed Interharmonic Limits Current Standards* use 0.2% Other Proposed Limits Less than 1%, 3% or 5% depending on the voltage level. Adopt limits correlated with Pst Develop appropriate limits for particular equipment and systems. 27 All %’s are of nominal fundamental frequency *IEC 61000-2-2 Source: Survey of Interharmonics in Indian Power System. Network, B.E. Kushare, et al.
28. Causes of Interharmonics Asynchronous switching (i.e., not synchronized with the power system frequency); and Rapid changes of the load current causing the generation of sideband components adjacent to the fundamental supply frequency and its harmonics; and A combination of the above can occur at the same time in many kinds of equipment. 28 Source: Power Quality Application Guide: European Copper Institute, AGH University of Science and Technology and Copper Development Association.
29. Sources of Interharmonics Includes at least: PWM power electronic systems (Asynchronous Switching) Arc Furnaces (Rapid Current Changes) Cycloconverters (Asynchronous Switching) 29 Source: Power Quality Application Guide: European Copper Institute, AGH University of Science and Technology and Copper Development Association.
32. Variable Speed Drives (cont.) 32 If the reactor and/or capacitor at the DC Link is infinite there will not be any DC ripple at the DC Link. Source: Interharmonics: basic concepts & techniques for their detection & measurement, Chun Li, et al.
34. Varying Loads 34 Source: Interharmonics: basic concepts & techniques for their detection & measurement, Chun Li, et al.
35. Modulated Power 35 Source: Interharmonics: basic concepts & techniques for their detection & measurement, Chun Li, et al.
36. RMS Deviation from Interharmonics 36 36 Source: Power Quality Application Guide: European Copper Institute, AGH University of Science and Technology and Copper Development Association. 0.2 0.15 % RMS Deviation Due to Interharmonics 0.1 0.05 0.0 0 50 100 150 200 Interharmonic Frequency
37. Problems Caused by Interharmonics Lamp Flicker; Heating; and Interharmonics vary with the operating conditions of the interharmonic producing load. This makes interharmonics more difficult to mitigate than harmonics. 37
38. Lamp Flicker 38 58 Hz 42 Hz Source : EPRI Source: Interharmonics: basic concepts & techniques for their detection & measurement, Chun Li, et al. Human eye is sensitive to frequencies between about 8 Hz and 12 Hz
39. Minimum Interharmonic Amplitude Causing Perceptible Flicker 39 Flickermeter Source: Detection of Flicker Caused by Interharmonics Taekhyun Kim, Student Member, IEEE, Edward J. Powers, Fellow, IEEE, W. Mack Grady, Fellow, IEEE, and Ari Arapostathis, Fellow, IEEE
40. Rolling Mill Case 40 Bus Source: Leonardo Energy by Michele De Witte 40
41. Harmonic Impedance at Resonance 41 Source: Harmonic Impedance Study for Southwest Connecticut Phase II Alternatives by KEMA, Inc.
42. Rolling Mill Case (cont.) 42 180 485 330 notch notch notch Source: Leonardo Energy by Michele De Witte
43. Interharmonic Conclusions Interharmonics have always been around, they are just becoming more important and visible. Power electronic advances are resulting in increasing levels of interharmonic distortion. Traditional filter designs can result in resonances that make interharmonic problems worse. Light flicker is the most common impact. Measurement is difficult, but standards make them possible and the results comparable. 43
44. IEC Groupings Number of cycles to sample chosen to provide 5 Hz frequency bins 10 Cycles for 50 Hz Systems 12 Cycles for 60 Hz Systems Grouping concept Harmonic factors calculated as the square root of the sum of the squares of the harmonic bin and two adjacent bins. Interharmonic factors calculated as the square root of the sum of the squares of the bins in between the harmonic bins (not including the bins directly adjacent to the harmonic bin). 44 Source: Power Quality Application Guide: European Copper Institute, AGH University of Science and Technology and Copper Development Association.
45. IEC 61000-4-7 (Groupings) 45 Harmonic subgroup Harmonic group Harmonic subgroup The RMS value of the two harmonic components immediately adjacent to the fundamental . The RMS value of the fundamental and adjacent Harmonic components n n+1 n+2 The time-window is 12 cycles at 60 Hz and has 5 Hz resolution. Source: Power Quality Application Guide: European Copper Institute, AGH University of Science and Technology and Copper Development Association.
46. IEC 61000-4-7 (Groupings) 46 The RMS value of all interharmonics components in the interval between two consecutive harmonics. The RMS value of all interharmonic components in the interval between two consecutive harmonic frequencies, excluding components adjacent to the harmonic frequencies Interharmonic subgroup Interharmonic group n n+1 n+2 Source: Power Quality Application Guide: European Copper Institute, AGH University of Science and Technology and Copper Development Association.
Here’s an overview of this discussion.A good grasp of harmonics is a prerequisite to understanding interharmonic and provides a good background for today’s discussion.Since most of you all have been exposed to harmonics, I will briefly cover harmonics and quickly transition into the concept of the DFT.This will lay the ground work for our discussion of interharmonics.Next, follow slide
1. A sinusoid is the lowest common denominator of all periodic signals.2. Also, in engineering sinusoids are a preferred tool because of Sinusoidal Fidelity. If you apply a sinusoid to a linear system the output is always a sinusoid no other waveform has that characteristic. 3. The atom is depicted as the basic unit in chemistry. For this discussion, the sinusoid is analogous and the basic unit for periodic waveforms.4. Utilities such as SRP are know as voltage providers. It should be noted that the voltage at least from the generator is near perfect.
Fourier came up with his claim from his attempt to solve a heat transfer problem of a metal plate.This claim did not go without a challenge. Joseph LaGrange another famous French mathematician of the day vehemently objected. He said such an approach cannot be used to represent signals with corners such as square waves.The mathematical question of determining when a Fourier series converges has been fundamental for centuries.It turns out that using Fourier’s method for discrete signals (predominately used today) is exact.
1. The top figure depicts the construction in the time domain of a square wave from a plurality of sinusoids.2. The resultant square wave in the time domain of the bottom figure shows the ringing (Gibbs Phenomenum) caused by applying the Fourier method to make a square-wave function at a discontinuity. Even if the number of harmonics approaches infinity. The fact is the Fourier expansion fails to converge uniformly at discontinuities.4. In the next few slides, we will discuss related issues with the Fourier method as it relates to interharmonics.5. The point of this slide is that the Fourier method is not perfect. For example, the unit-step function and undamped sinusoids do not have Fourier transforms.
1. Fourier methods allow the user to look at time domain signal in the frequency domain. The frequency domain that is provided via the transform is a discrete spectra, not continuous.2. Talk to the four methods.3.The DFT can be substantially slow. Hence, methods such as the Fast Fourier Transform (1965) and Damn Fast Fourier Transform can be used in lieu of the Discrete Fourier Transform. This is due to the time constraints associated with the DFT.4. For today’s discussion I will refer to the DFT in a broad context to include the other methods.
When these conditions are satisfied the measurements are accurate.
The vertical axis is normalized voltage or current.The horizontal axis is time.The scope is depicting the whole DFT window.Only the 2 Pi portion of the DFT is stationary.DFT does a poor job of resolving the frequencies for non-stationary signals.
The vertical axis is normalized voltage or current.The horizontal axis is time.
Harmonics must be a multiple of the fundamental frequency.Interharmonic are not a multiple of the fundamental frequency.Subharmonics are a special type of interharmonics and not discussed in this presentation.
Each piece of equipment has its own harmonic signature.
Cycloconverter or a cycloinverter converts an AC waveform, such as the mains supply, to another AC waveform of a lower frequency, synthesizing the output waveform from segments of the AC supply without an intermediate direct-current link.This definition of non-characteristic harmonics in IEEE 519infringes upon the definition of interharmonics, because of the words “beat frequencies”, “demodulation” and “cycloconverter”. Hence, non-characteristic harmonics can include interharmonics based on the IEEE 519 definition. The next update of IEEE 519 is expected to include a more comprehensive definition of interharmonics.
This definition puts words to the table on a previous slide.Signals across the electromagnetic spectrum is an example of wide band spectrum.One of the things SRP does for its customers is answer complaints concerning RF interference caused by arcing within the distribution system.
The vertical axis is normalized voltage and the horizontal axis is time.Discrete calculation are made across the DFT windowAs illustrated a DFT is taken of a 60 Hz fundamental power frequency over one cycle or about 16.67 ms.We probably cannot do justice to this subject without going through the math. However, we will instead plug through this subject using graphics in the charts to follow.
The vertical axis is normalized voltage and the horizontal axis is time.As depicted, a DFT samples at 16 points over a DFT window of one cycle or DFT Window A. The sampling at discrete points is not shown in the remaining DFT window or slides.The angular frequency resolution can be used to determine the frequency buckets for collecting spectra of the DFT. The 0 to A, B and C are the boundaries of the DFT windows of 1 cycle, 2 cycles and 5 cycles, respectively.For example, a DFT window A of one cycle only collects spectra or in this case harmonics at multiples of 60 Hz (i.e., 120, 180, 240 and the like.Further, DFT window B up over two cycles collects spectra every 30 Hz including interharmonics of 30 Hz (90Hz, 150Hz…)Further yet, DFT window C over three cycles collects spectra every 12 Hz including interharmonics or subharmonics of (12Hz, 24Hz…)
The DFT is analogous to looking at the world through a picket fence.The frequencies determined by the DFT have nothing to do with the signal being analyzed.Sometimes signals of interest can be interharmonics outside the DFT window.As an example, the signal at the frequency as circled in red is not seen by the DFT.As the frequency resolution increases, the picket fence can be said more like looking through a screen porch.
As we will see by opening up the DFT window measurements can be deceiving.
The vertical axis is normalized voltage and the horizontal axis is time.In the real world we typically do not see the harmonics broken up with the fundamental as depicted above. Instead, we see a distorted waveform. But for this discussion various harmonics are shown with the 60 Hz fundamental (red).The figures on the left and right illustrate the fundamental and harmonic in the time-domain and frequency-domain, respectively.Fundamental frequency (in red) is depicted with some of its harmonics.Note that all the harmonics close out as a complete period for their respective frequency within the DFT window.For example, count the number of cycles of the third harmonic (black) within the DFT window.The fundamental and all the harmonics can be measured within one 16.67 ms DFT window.Further, the frequency domain from the DFT of the fundamental and harmonics are shown on the right.The main takeaway here is that if one period of the fundamental is selected for the DFT only the fundamental and integral multiples of the fundamental frequency (harmonics) can be seen in the DFT.
The vertical axis is normalized voltage and the horizontal axis is time for the plot on the left.The important point to note is that both sinusoids close on complete cycles at the end of the DFT. For the 60 Hz waveform, the two cycles are completed at the end of the DFT.For the 90 Hz waveform, three cycles are completed at the end of the DFT.The frequency domain plot on the right (i.e., the result of the two cycle DFT) depicts the frequency buckets with the appropriate frequencies.
The vertical axis is normalized voltage and the horizontal axis is time for the plot on the left.The figures on the left and right illustrate the 60 Hz and 100 Hz waveforms in the time and frequency domains, respectively.As depicted on the left, the 100 Hz waveform (black) does not complete the DFT. Instead, the 100 Hz waveform completes 3.33 cycles within the DFT window.On the right, the frequency components are in buckets of 60, 90, 120 and 150 Hz. The 60 Hz component is correctly bucketized. In contrast, the 100 Hz signal is distributed into the 90, 120 and 150 Hz buckets. It can be said the components of the 100 Hz waveform are smeared, thereby generating false components.This phenomenon is referred to as spectral leakage. Hence, we can conclude that not all interharmonic measured are necessarily real. Instead, they can be a manifestation of the DFT.
Harmonics between 3 and 6 percent of Nominal Fundamental per IEC 61000-2-2 & Table 11.1 of IEEE 519-1992Interharmonics per IEC 61000-2-2White Noise per 1000-2-1The power system voltage contains a background Gaussian noise with a continuous spectrum. Typicallevels of this disturbance are in the range (IEC 1000-2-1).The takeaway here is the relative differences in the limits of interharmonics compared to harmonics (i.e., harmonic limits are 25 time greater).And, the interharmonic limit is about 10 times (or 20 db) the noise occurring on the power system.
I understand the next generation of IEEE 519 will include interharmonics limits.
The low limit will guarantee compliance of interharmonic distortion with light systems. However, due to measurement difficulties other limits are being evaluated.Difficulties in measurement are due to at least:Low values or magnitudesVariability of their frequency and magnitudesVariability of their waveform periodicityHigh sensitivity to spectral leakage*Interharmonics per IEC 61000-2-2
Interharmonics caused by asynchronous switching tend to be at discrete frequencies.In contrast, rapid changes can be generated by loads operating in a transient state, either continuously or temporarily. This can cause amplitude modulation of currents and voltages and are largely random in nature. The interharmonics are typically random in nature and highly a function of the changes in load current.Interharmonics caused by rapid changes in load current tend to be wide band.In referring to harmonics and interharmonics, it is important to distinguish between voltage and current.The sources of interharmonics are due to a change in current. These current changes can be either a rapid irregular/random current changes quasi-regular current changes caused by asynchronous switching (i.e., switching not synchronized with the power frequency.
Devices using PWM and cycloconverters can result in asynchronous switching. In contrast, arc furnaces can cause rapid changes in the load current.
A typical application of a cycloconverter is for use in controlling the speed of an AC traction motor and starting of synchronous motor. Most of these cycloconverters have a high power output –on the order a few megawatts – and silicon-controlled rectifiers (SCRs) are used in these circuits. Common applicationssuch as for rolling mills in ore processing, cement kilns, and also for azimuth thrusters in large ships.The cycloconverter is the ideal source of interharmonics.The cycloconverter directly connects the input and output frequencies, because there is no DC node.The formula shown can be used to calculate the interharmonic generated from the cycloconverter.
Though not as a reliable source of interharmonic as the cycloconverter, variable speed drives and also generate interharmonics.
The characteristic harmonics of an ideal six-pulse rectifier is F ,which is the calculated per the depicted formula.
A little background on the electric arc furnace.The use of EAFs allows steel to be made from a 100% scrap metal feedstock. The primary benefit of this is the large reduction in specific energy (energy per unit weight) required to produce the steel. Another benefit is flexibility: while blast furnaces cannot vary their production by much and are never stopped, EAFs can be rapidly started and stopped, allowing the steel mill to vary production according to demand.
Another source of varying loads includes an arc furnace. The frequency of the load ωm determines the interharmonic generated. As the load varies the interharmonics vary. Typically, an the load of an arc furnace varies as the state of the molten metal changesThe solution I(t) is a series of sum and difference frequencies. Effectively, there is intermodulation between the power frequency and the operating frequency of the load.
60 Hz waveform is modulated by interharmonic sidebands.
The variation of the RMS value is a function of the magnitude and frequency of the interharmonics.Here, the magnitude is held constant at 0.2 and the frequency is allowed to vary.Interharmonics cause a variation in the RMS value.The closer the interharmonic is to the fundamental frequency the greater the fluctuation or deviation of the RMS value.At interharmonic frequencies higher than twice the power frequency (here 50 Hz), RMS deviationis small compared to the RMS deviation below the second harmonic.Interharmonics in Power Systems byErich W. Gunther
The graph shown plots Pst on the vertical axis and frequency on the horizontal axis.Pst - Short term flicker “perceptibility”. The average person borders on irritation for a level of 1.0Since the eye is sensitive to frequencies around 8 Hz. The interharmonics that cause the biggest lamp flicker issues are near the fundamental or harmonic frequencies. Interharmonics further away for the fundamental or harmonic frequencies are less of a lamp flicker problem.When the absolute value of the difference between the fundamental or harmonic frequency and the interharmonic frequency is about 8 Hz, the Pst approaches a maximum, as depicted above.
The minimum interharmonic amplitude (%) generating perceptible flicker.Since these plots are the minimum interharmonic amplitude to cause perceptible flicker, these plot are the inverse of the plot shown on the previous slide.On moving toward the power frequency or harmonic frequency, the interharmonic amplitude needed to generate perceptible flicker diminishes.Flicker can be detected with an IEC flicker meter for interharmonics less than 102 Hz for 60 Hz systems.Above 102 Hz the IEC flicker meter cannot detect flicker.3. Incandescent, LED and Fluorescent lamps are all exhibit a flicker response to frequencies less than 120 Hz.4. Only the LED and Fluorescent lamps have a flicker response above 120 Hz (due to electronics).The deficiency of the IEC flicker meter is due to the squaring and filtering processes in Blocks 2 and 3, respectively.
Lights in the office area of a steel manufacturing plant were flickering.A rolling milling using a cycloconverter is a source of interharmonics and is connected to a 30 KV bus.Two power factor correction capacitor banks of 4800 KVA are connected to the bus. Further, single-tuned notch type passive filter capacitors for the 5th, 7th and 11th harmonics are also connected to the bus.
A quick review of the response or harmonic impedance parallel (left) and series (right) configurations. At resonance, the current is minimum and maximum in the parallel and series resonant configurations, respectively.
A simulation of the 30 KV bus was done to examine the harmonic impedance.The chart plots the per unit impedance on the vertical axis and frequency in Hz on the horizontal axis.As depicted, the harmonic impedance (blue response curve) includes substantial peaks and valleys.As is typical for notch filter, there are parallel resonant frequencies just below each notch at 180 Hz, 330 Hz and 485 Hz.If any of the interharmonics produced by the rolling mill should coincide, or almost coincide, with one or more of these peak of harmonic impedance, this can generate substantial voltage components, thereby causing interharmonic flicker.The Q of the filter can be reduced by adding damping resistors. This will reduce the peaks and tend to flatten out the frequency response.Unfortunately, this is expensive and results in real power losses.Another difficulty with interharmonic filter design is that the interharmonics tend to move around as the load varies.In some cases, this can lead to multi-stage filters adding to the cost. Dynamic filters using electronic controls can be used to real-time monitor and control the harmonic and interharmonic levels.advanced power electronic techniques to continuously control harmonic and interharmonic levels in real-time.
IEC 61000-4-7 applies a DFT of 12 cycles to provide a frequency resolution of 5 Hz. The sampling is synchronized with the power frequency using a phase-locked loop.Depicted here are Harmonic Groups and Harmonic Subgroups.The RMS values of bands of frequencies are calculated. Go over the rules per above.
Depicted here are Interharmonic Groups and Interharmonic Subgroups.Go over rules above.
Here only the harmonics are used.
Here all components at 5 Hz increments are depicted.