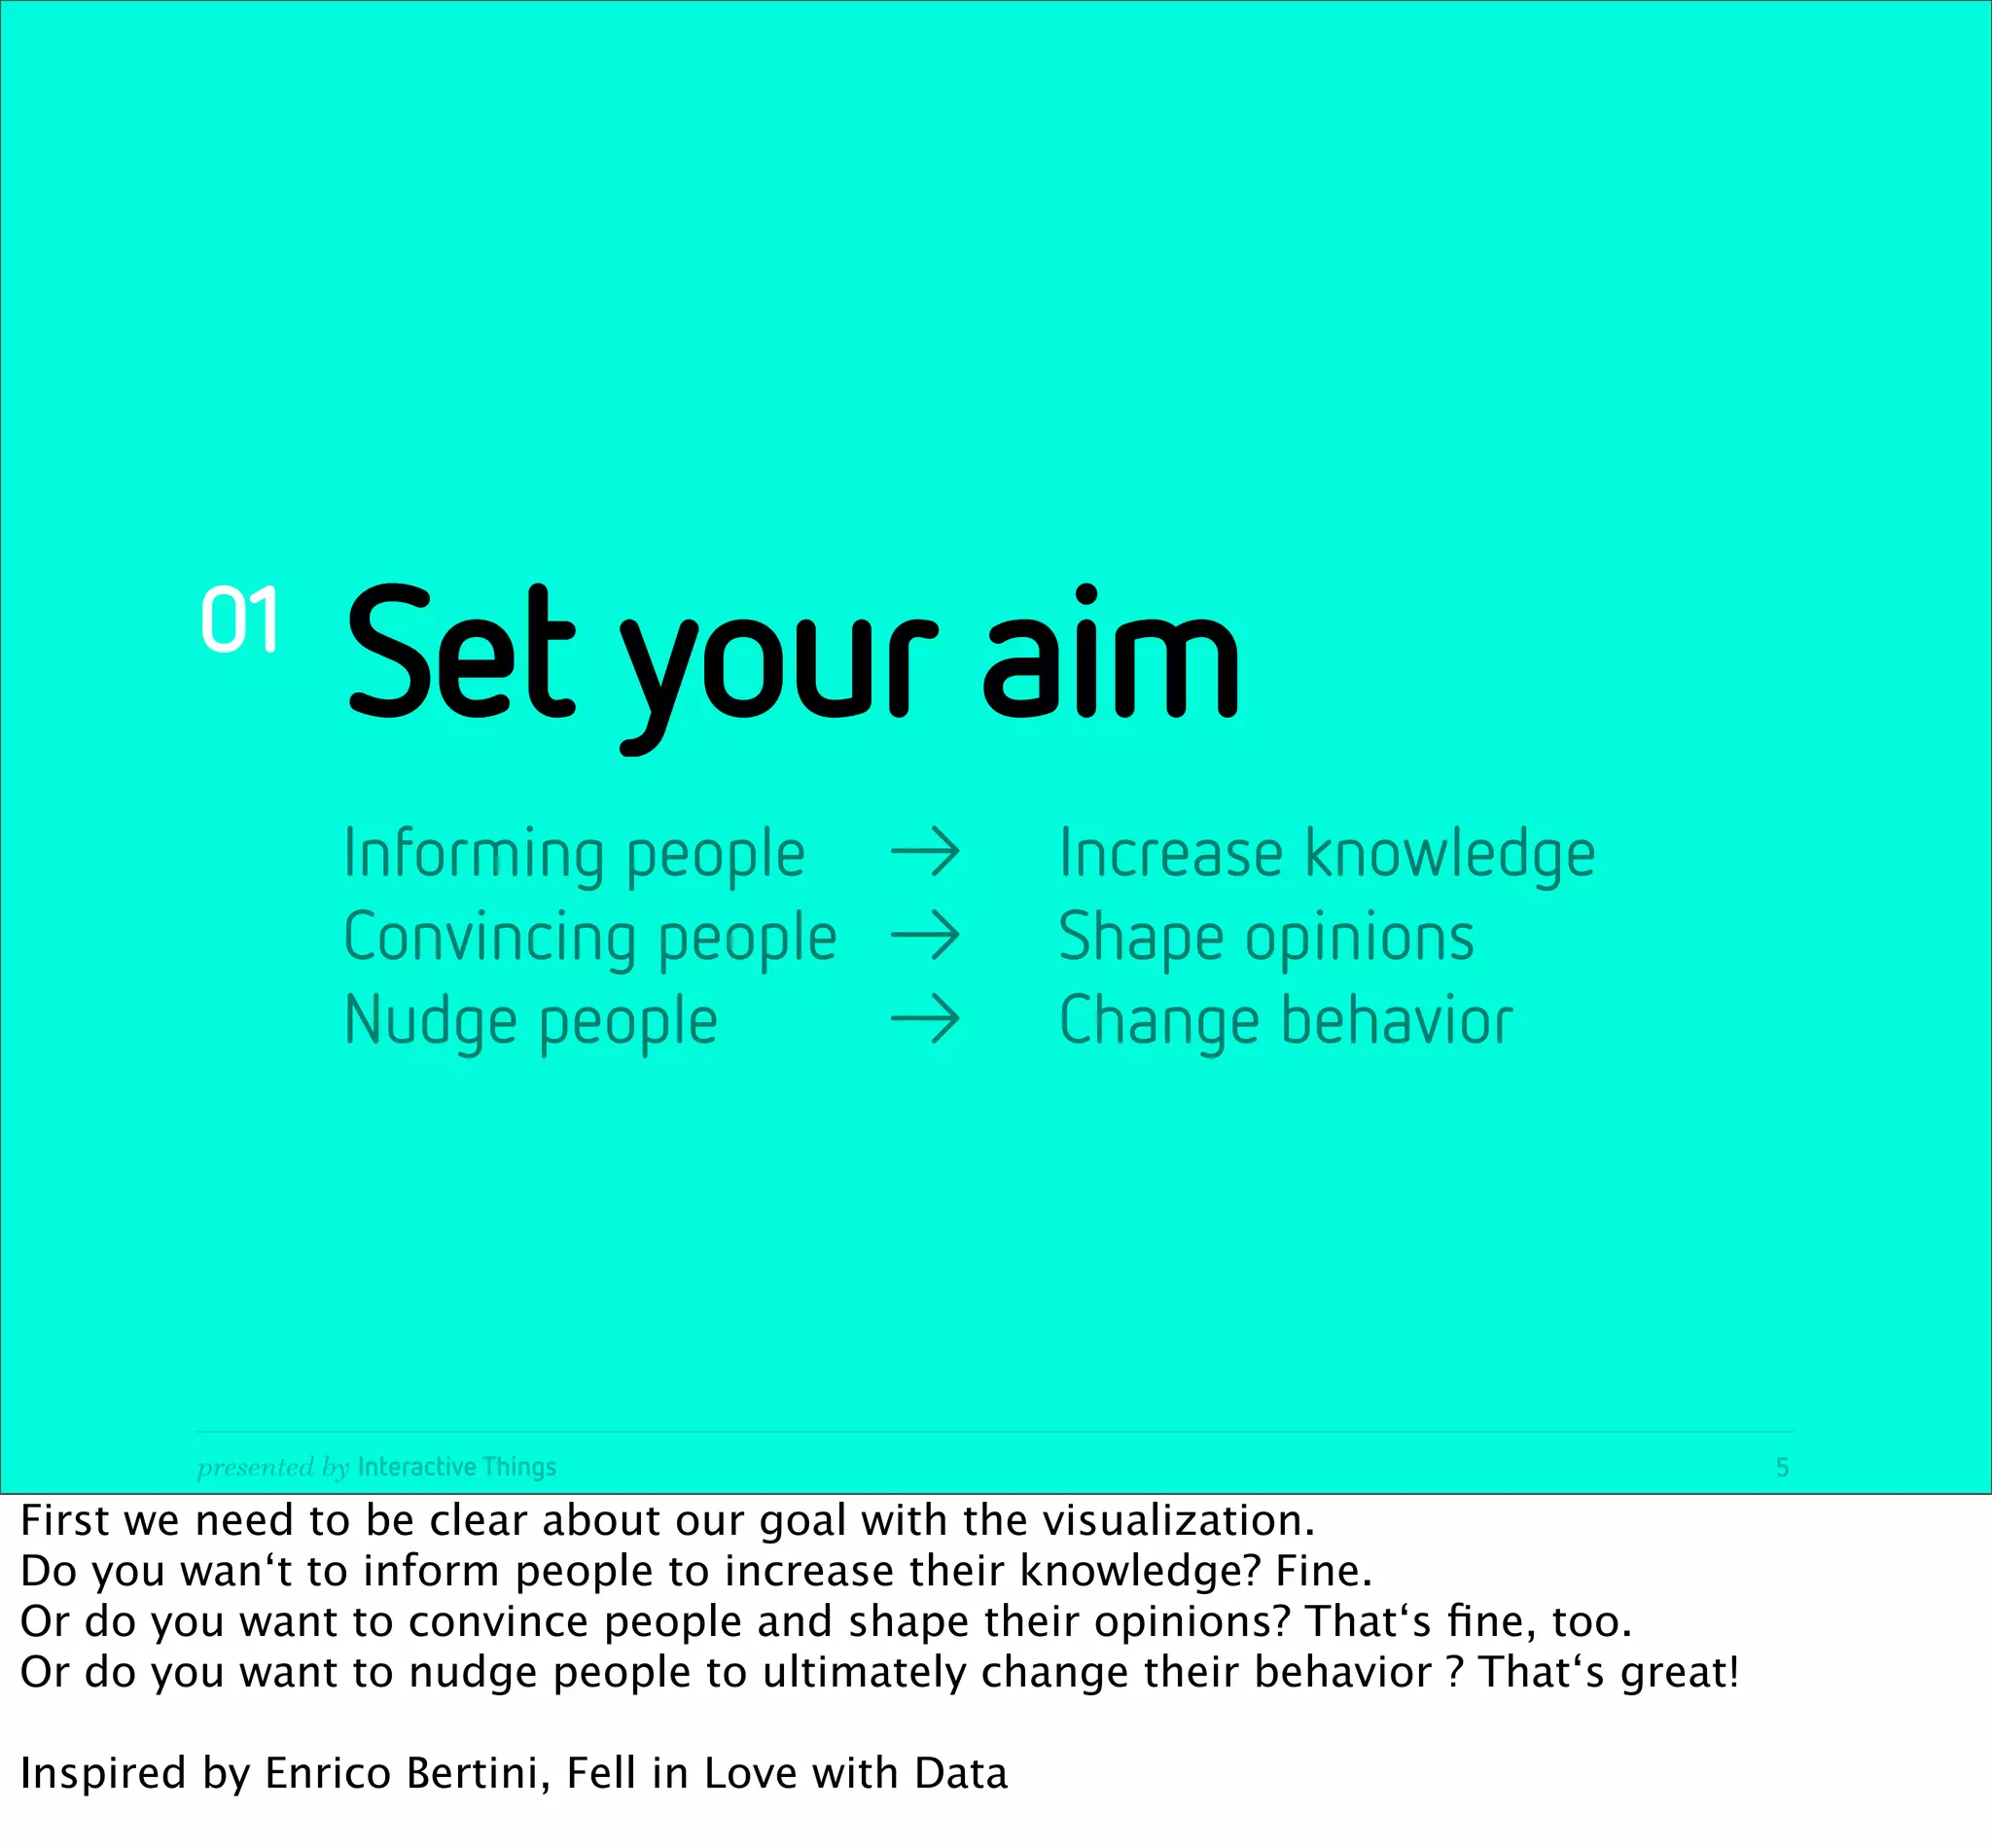
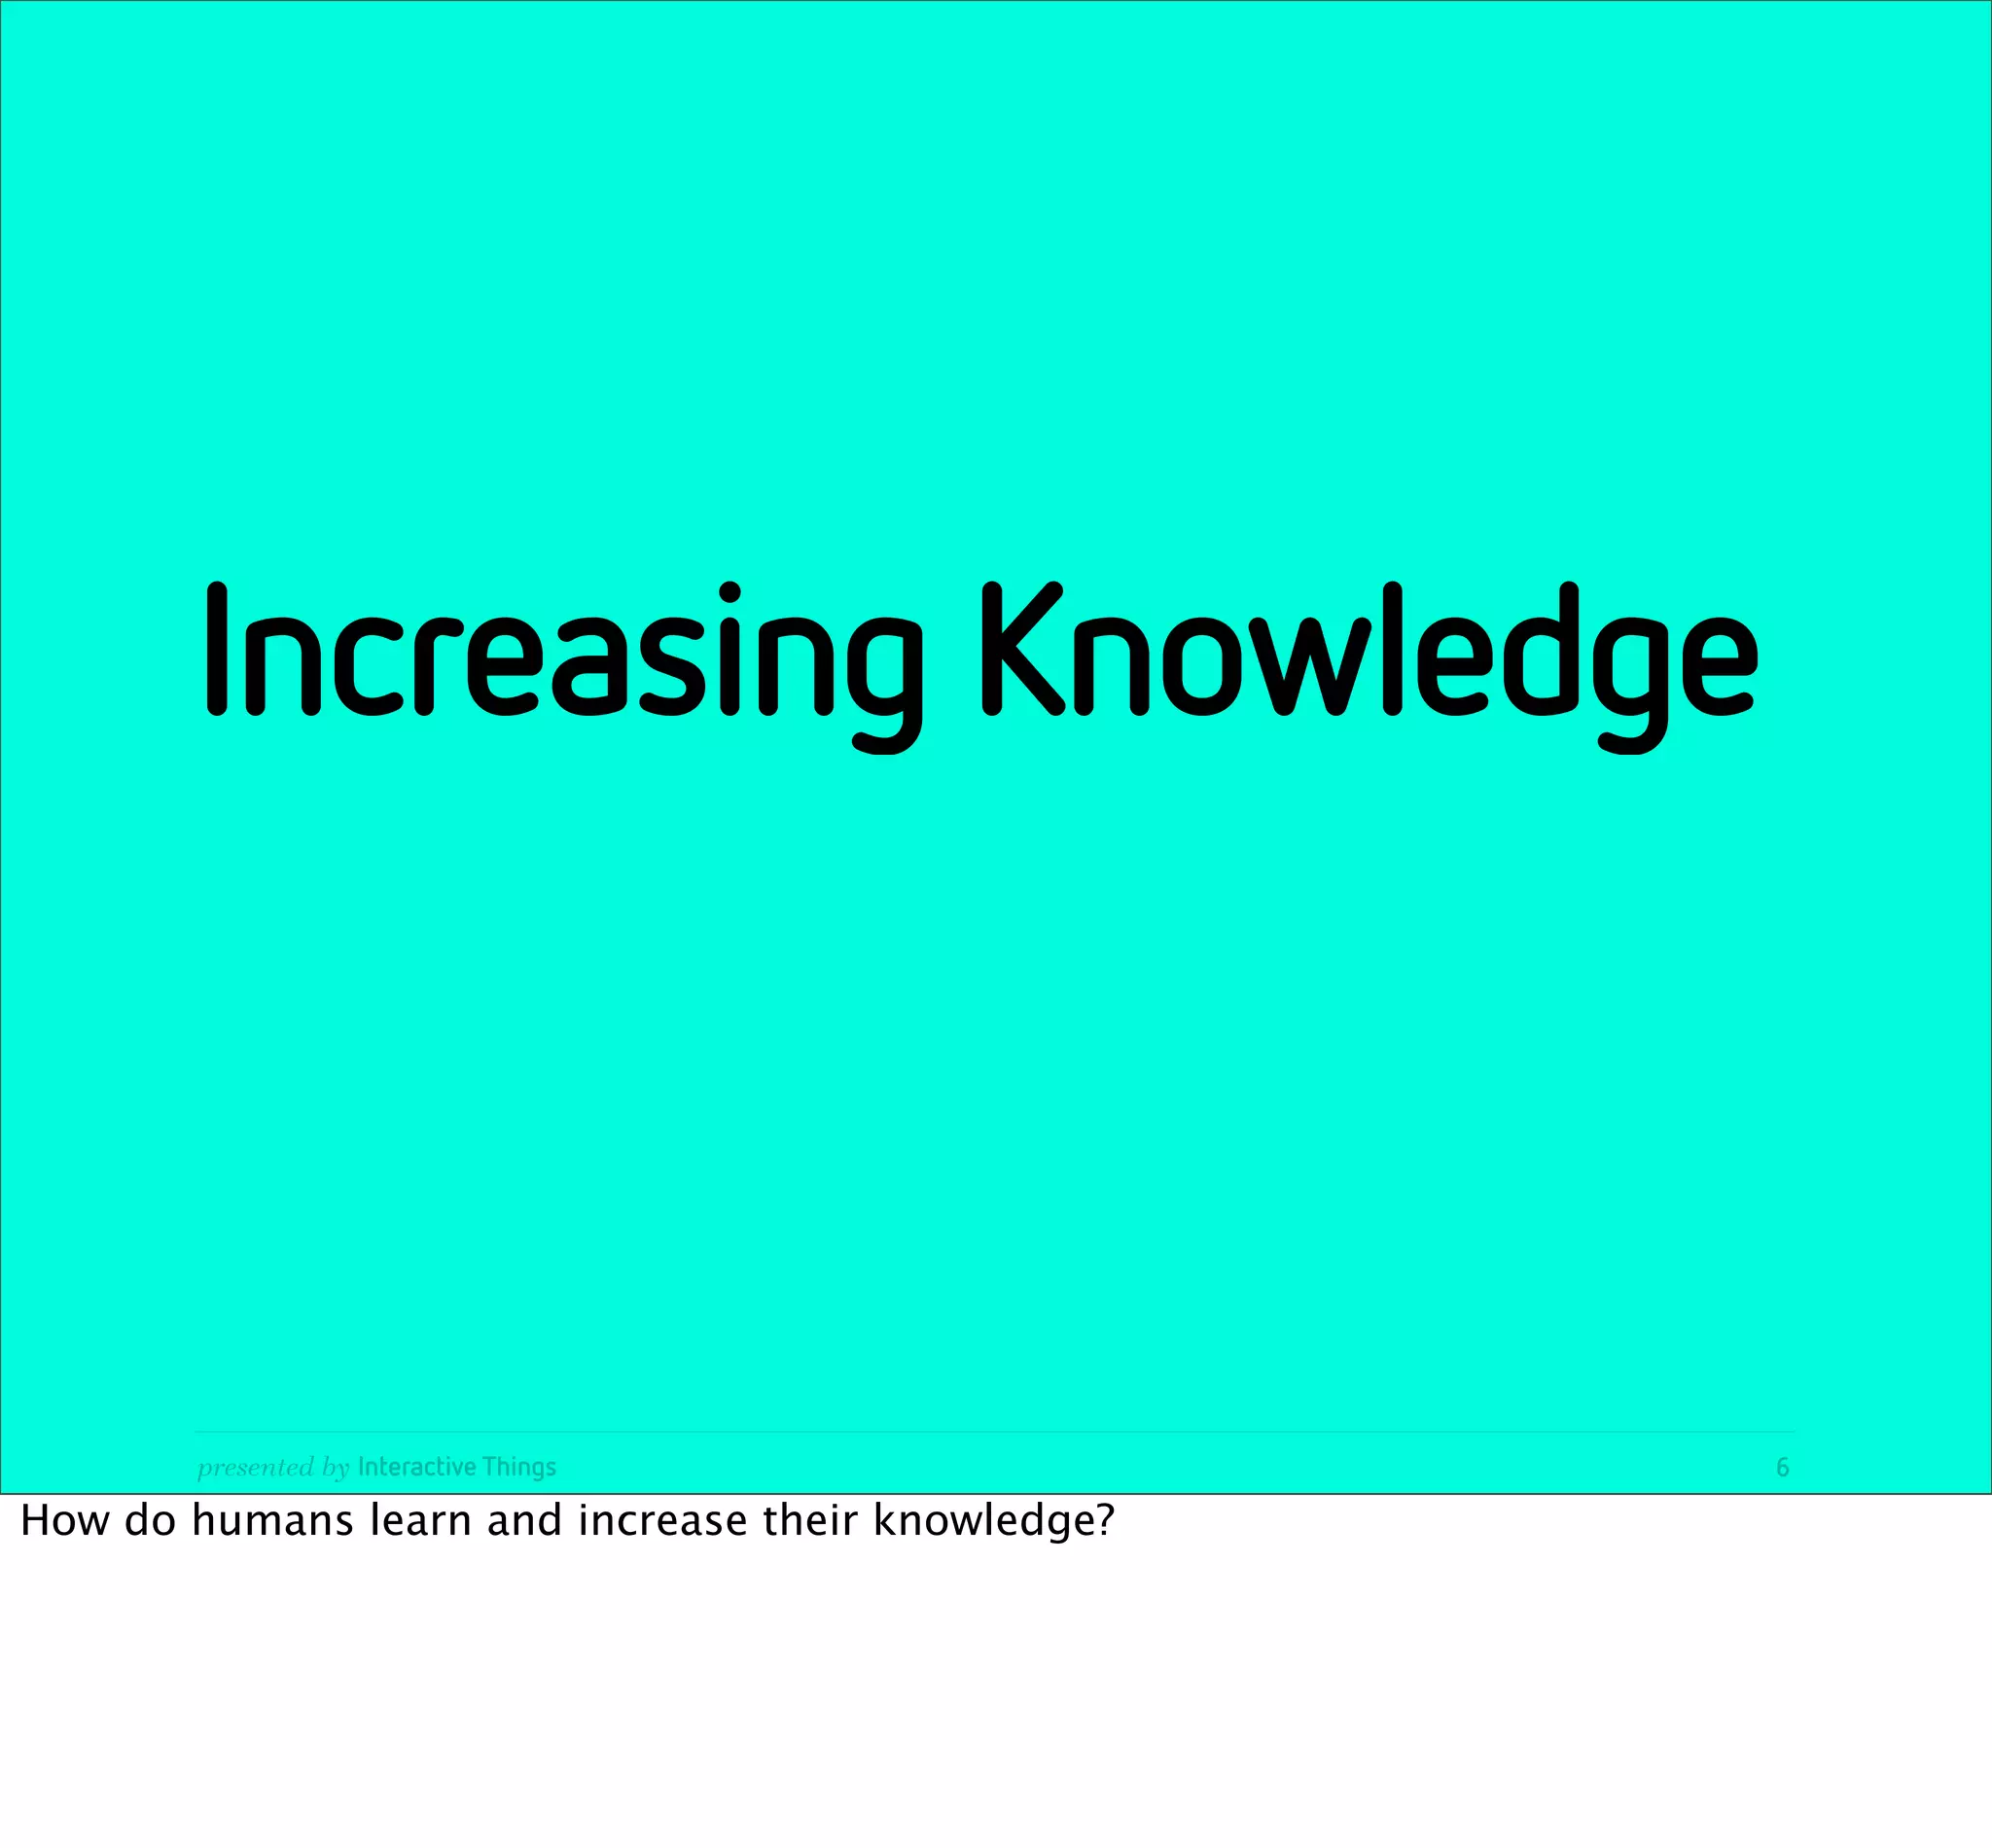
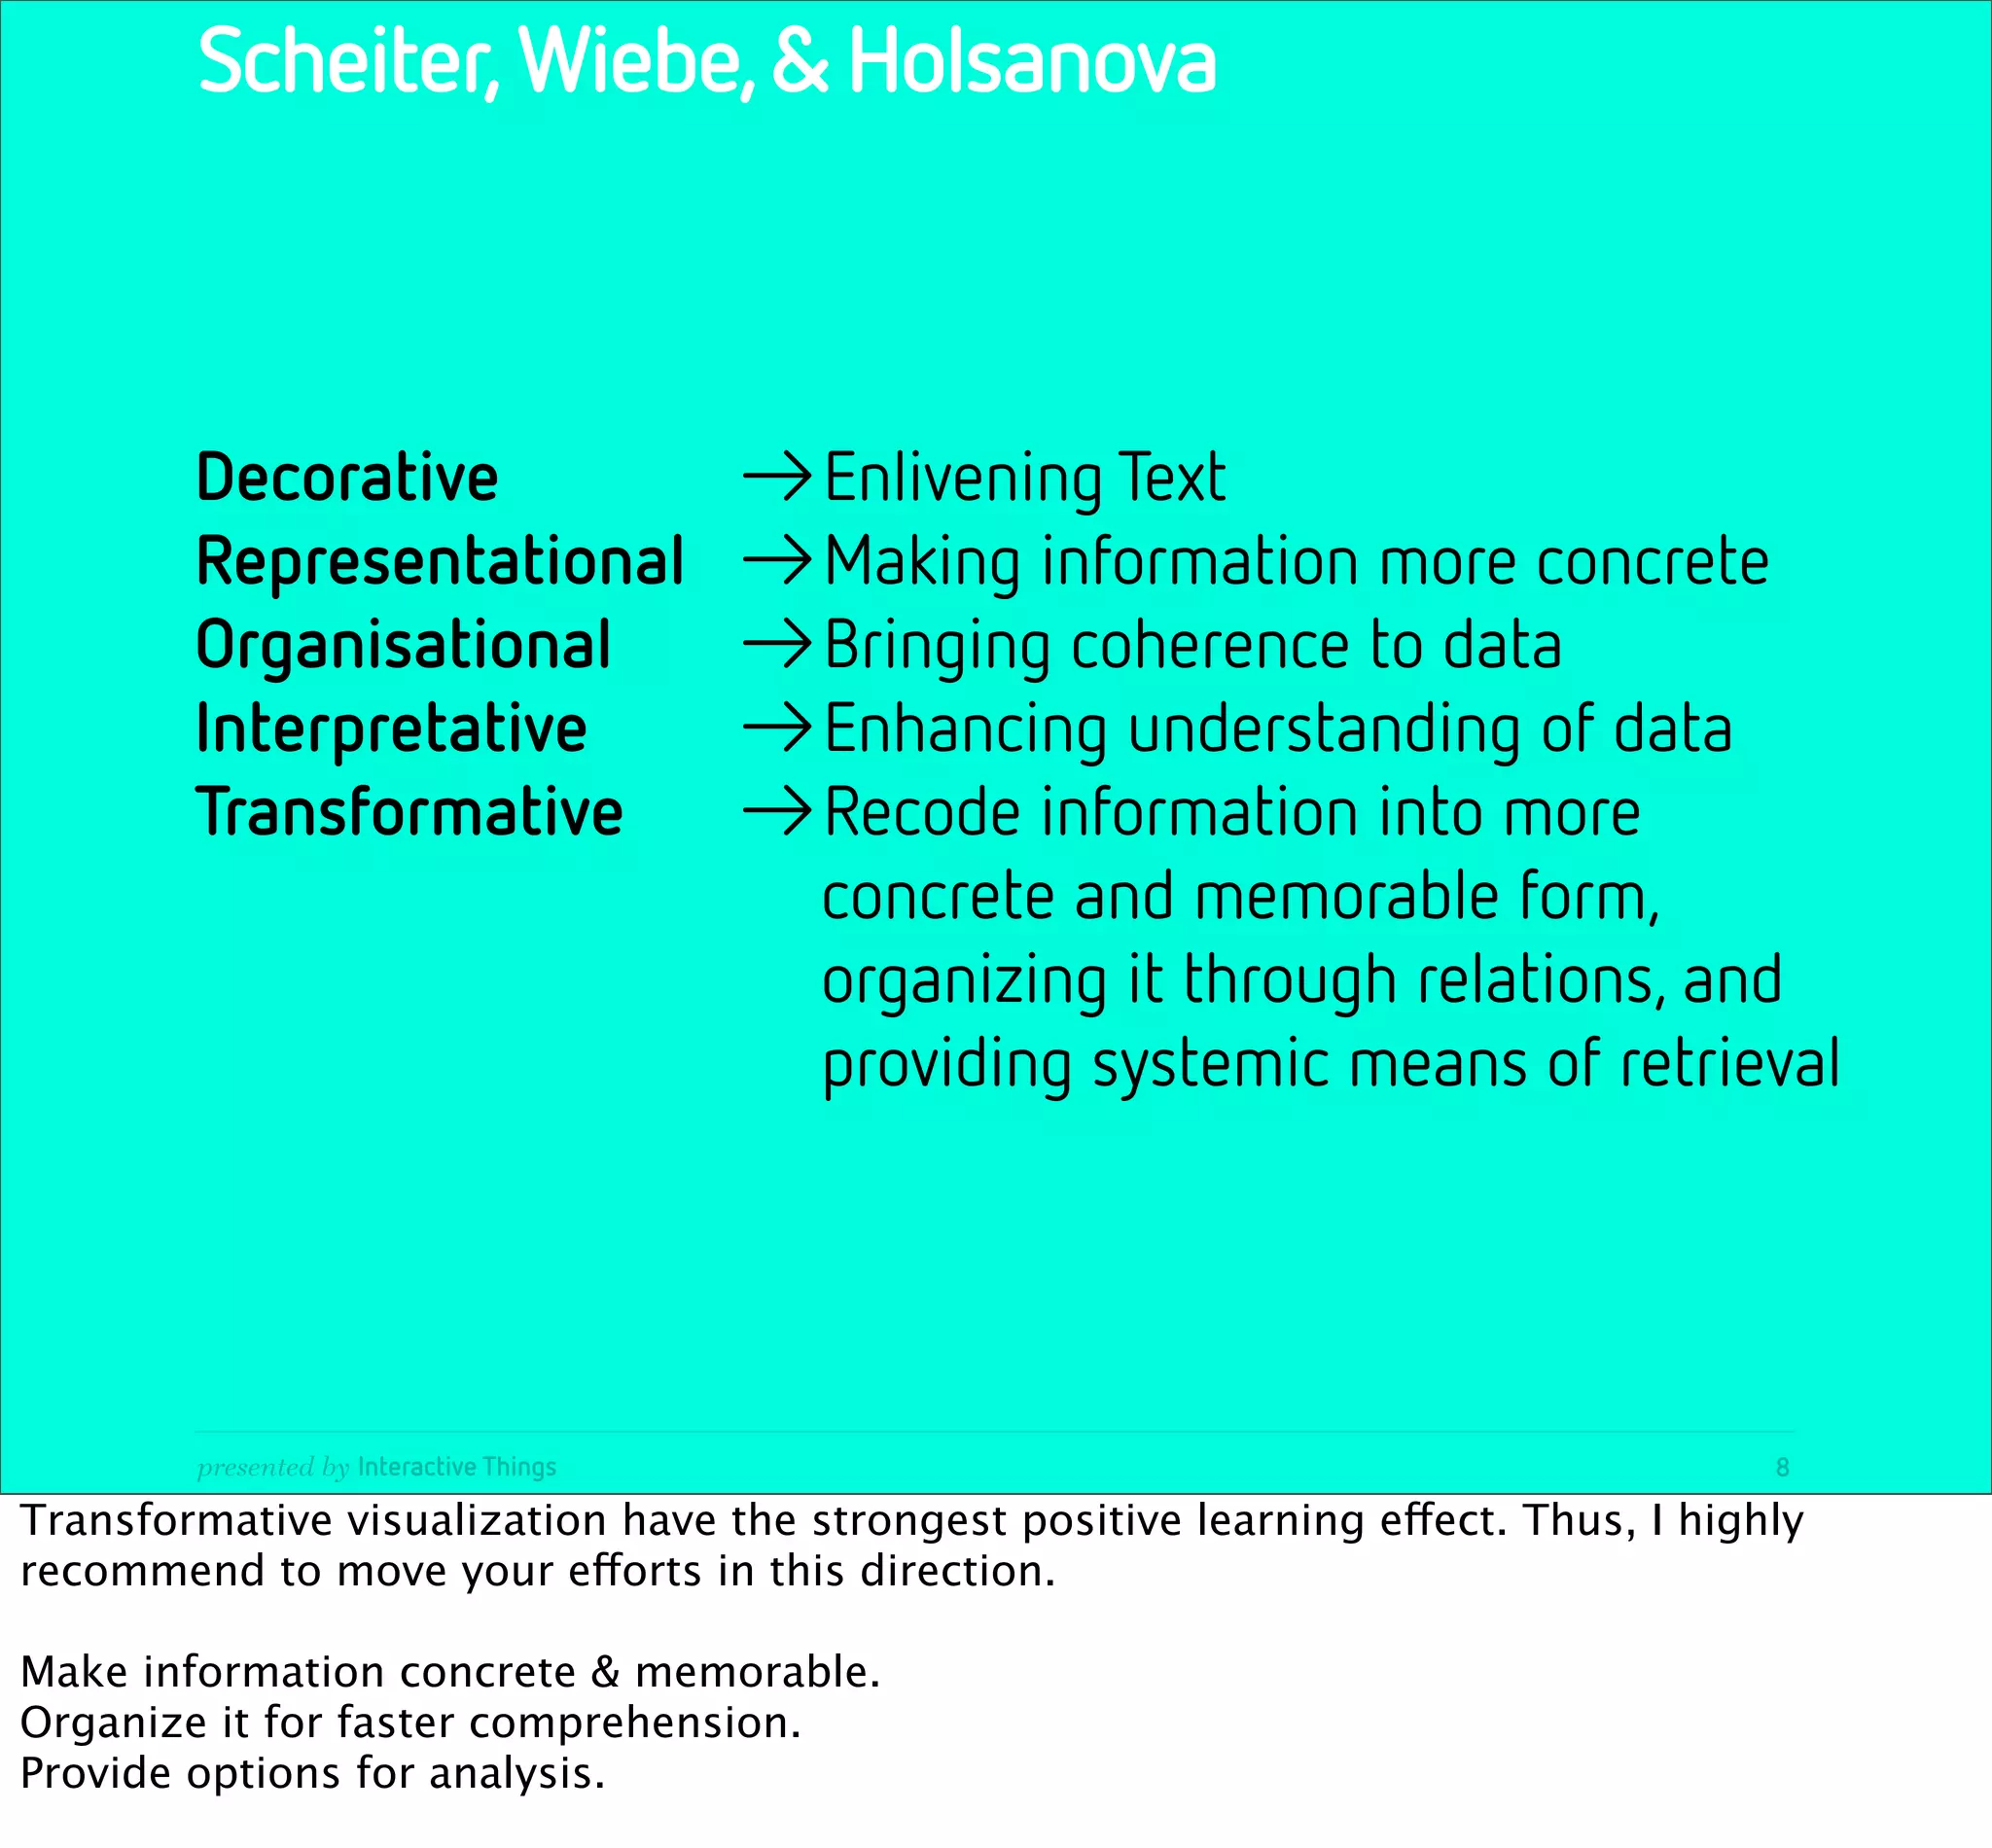
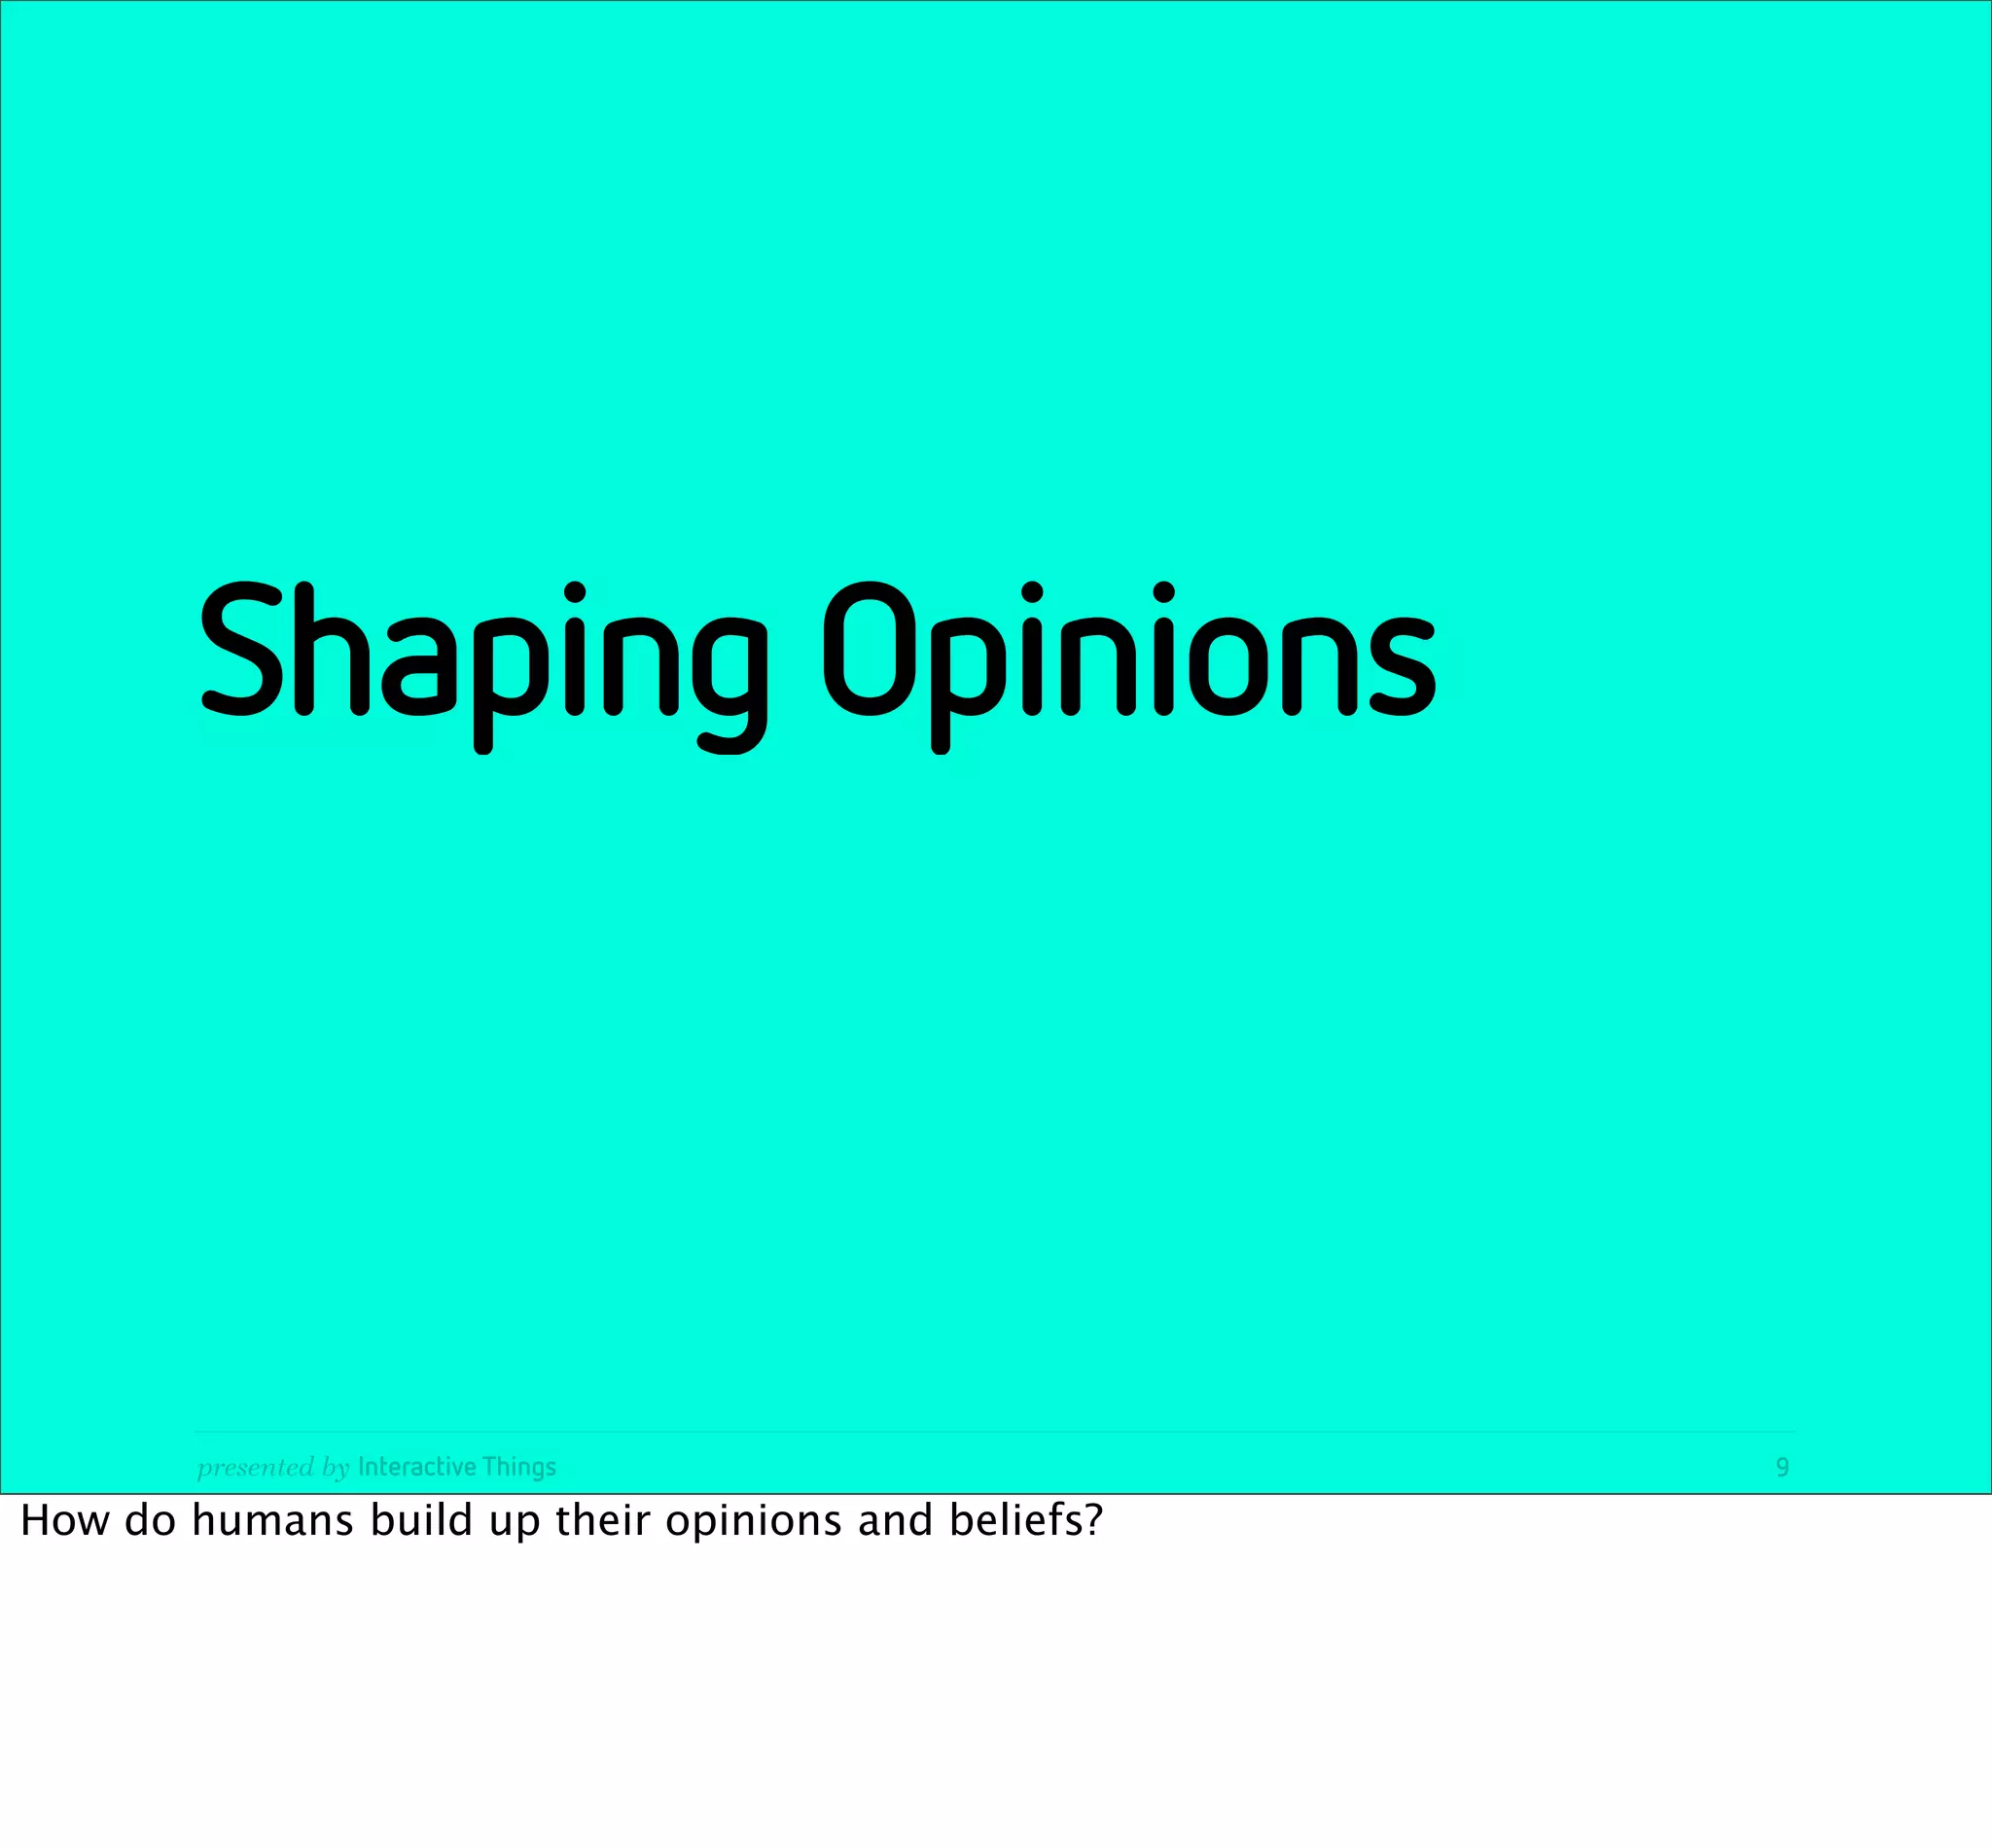
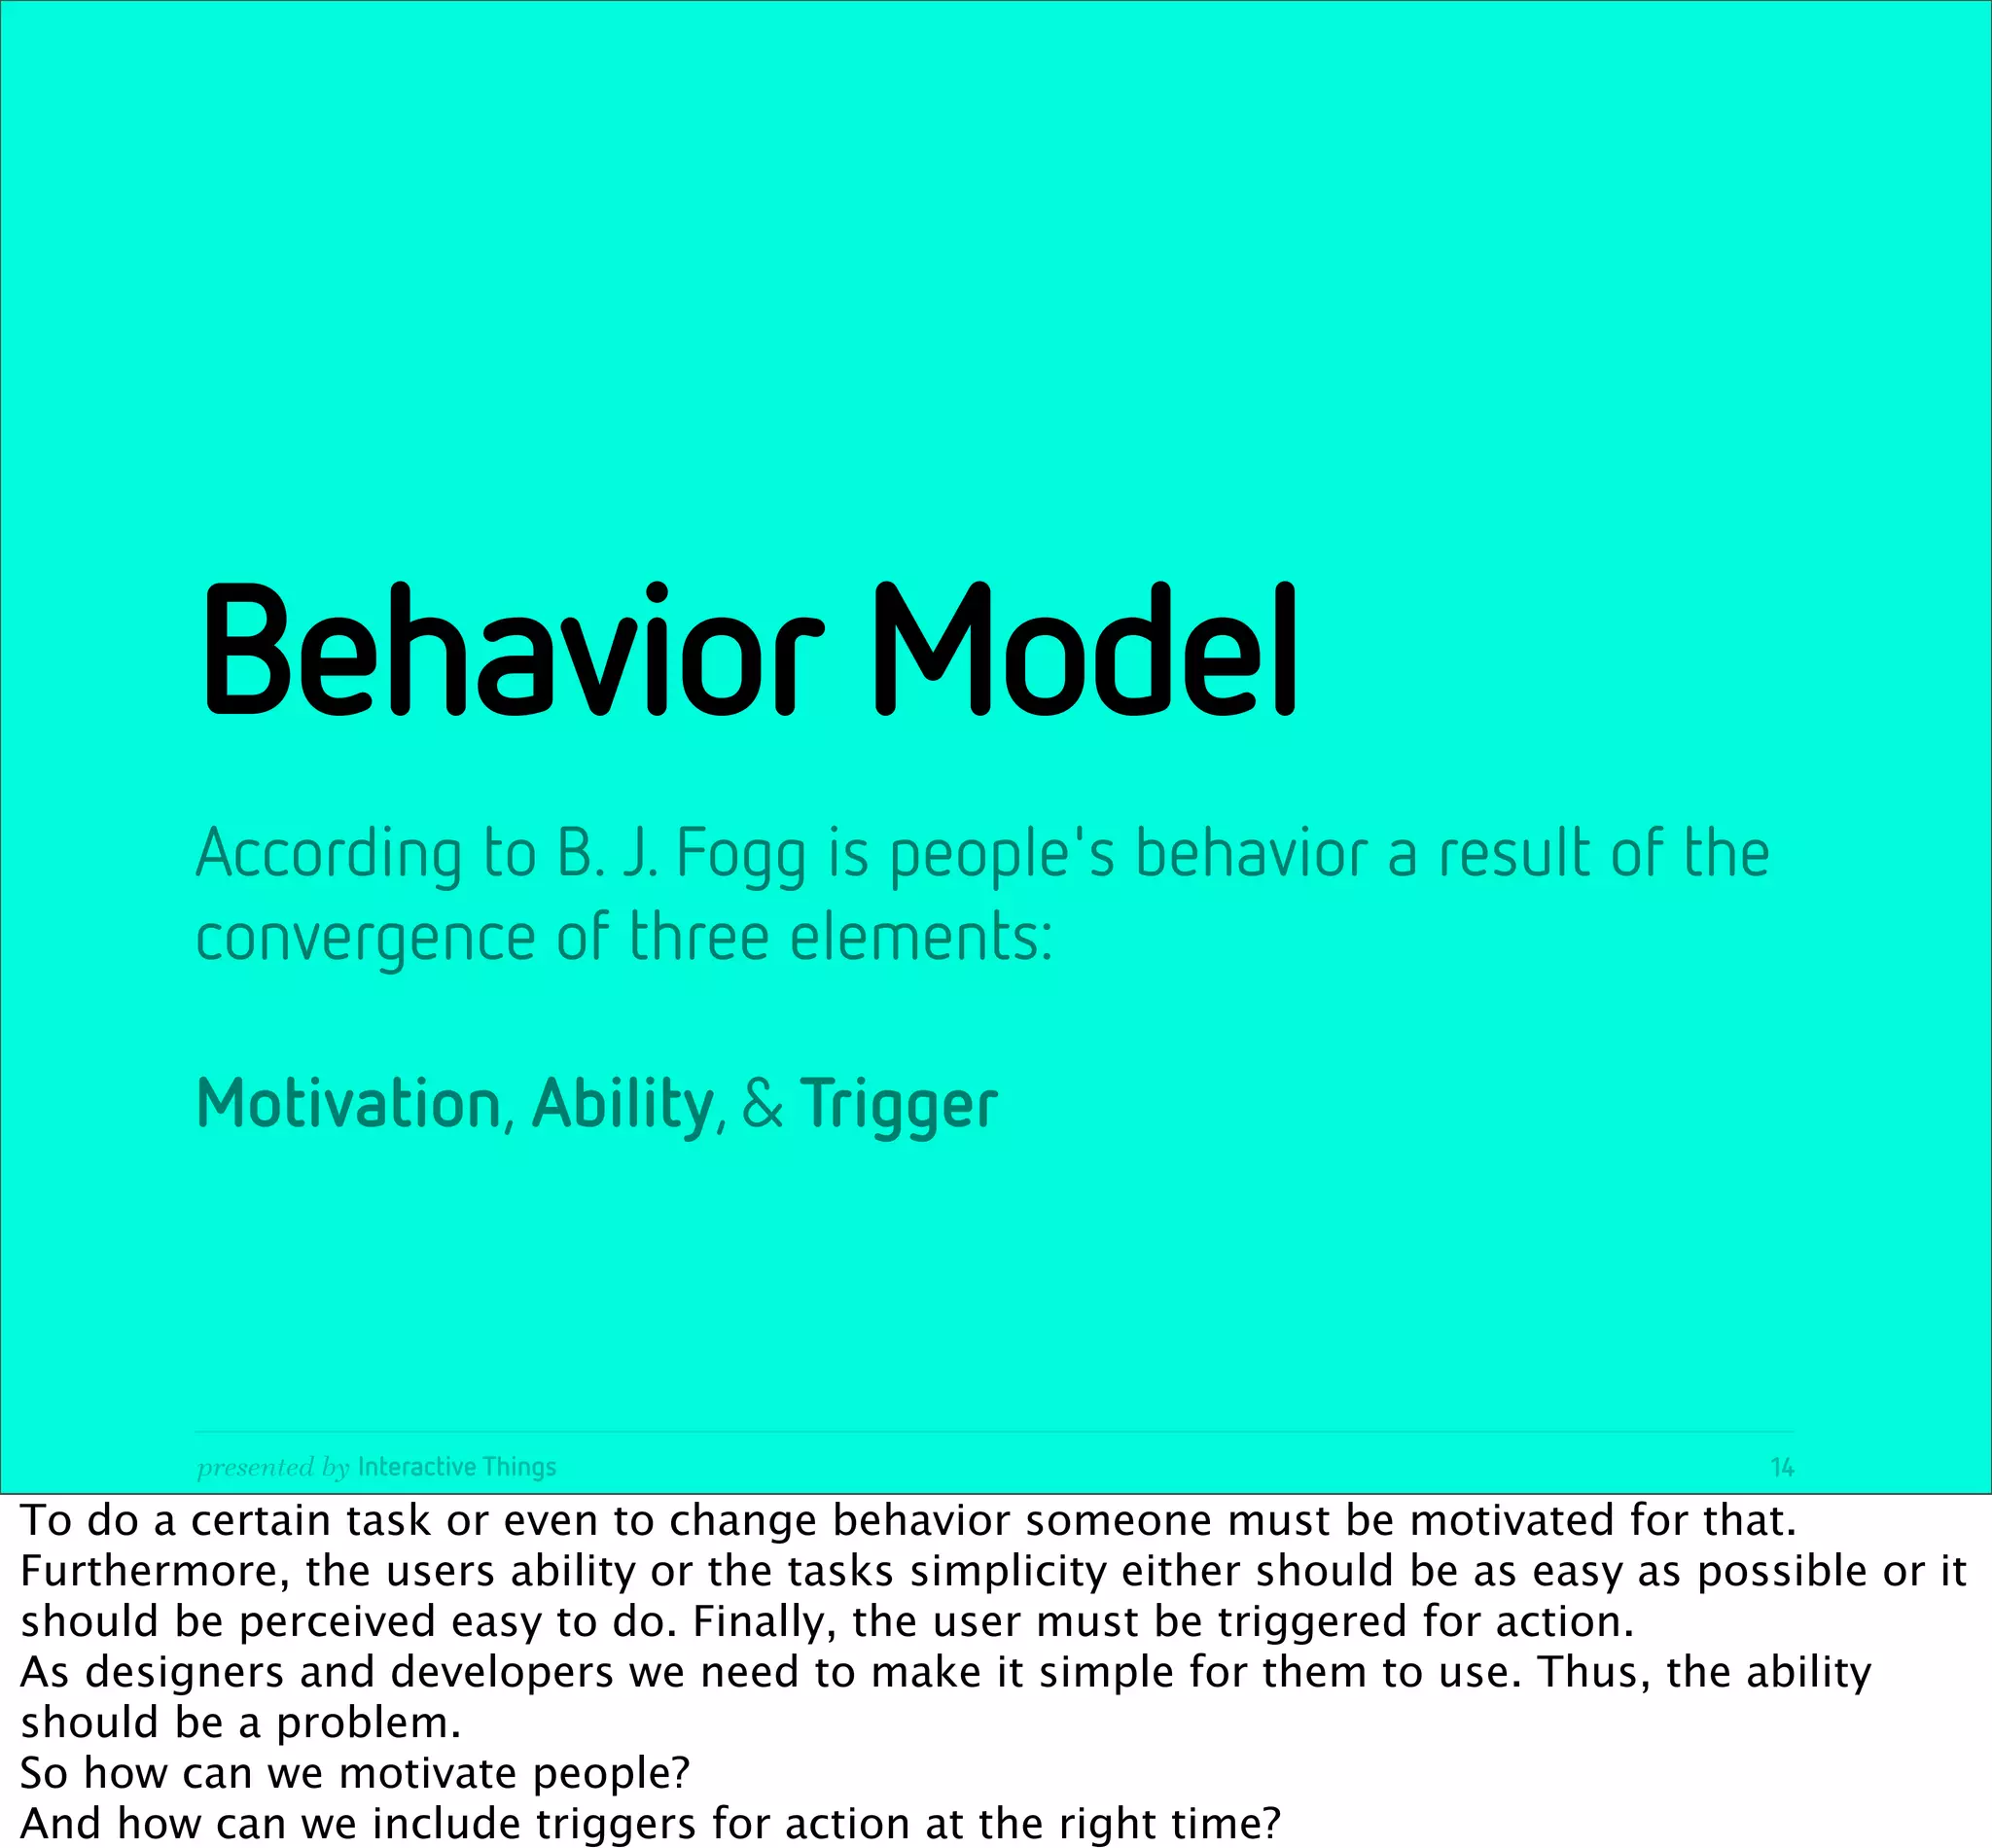
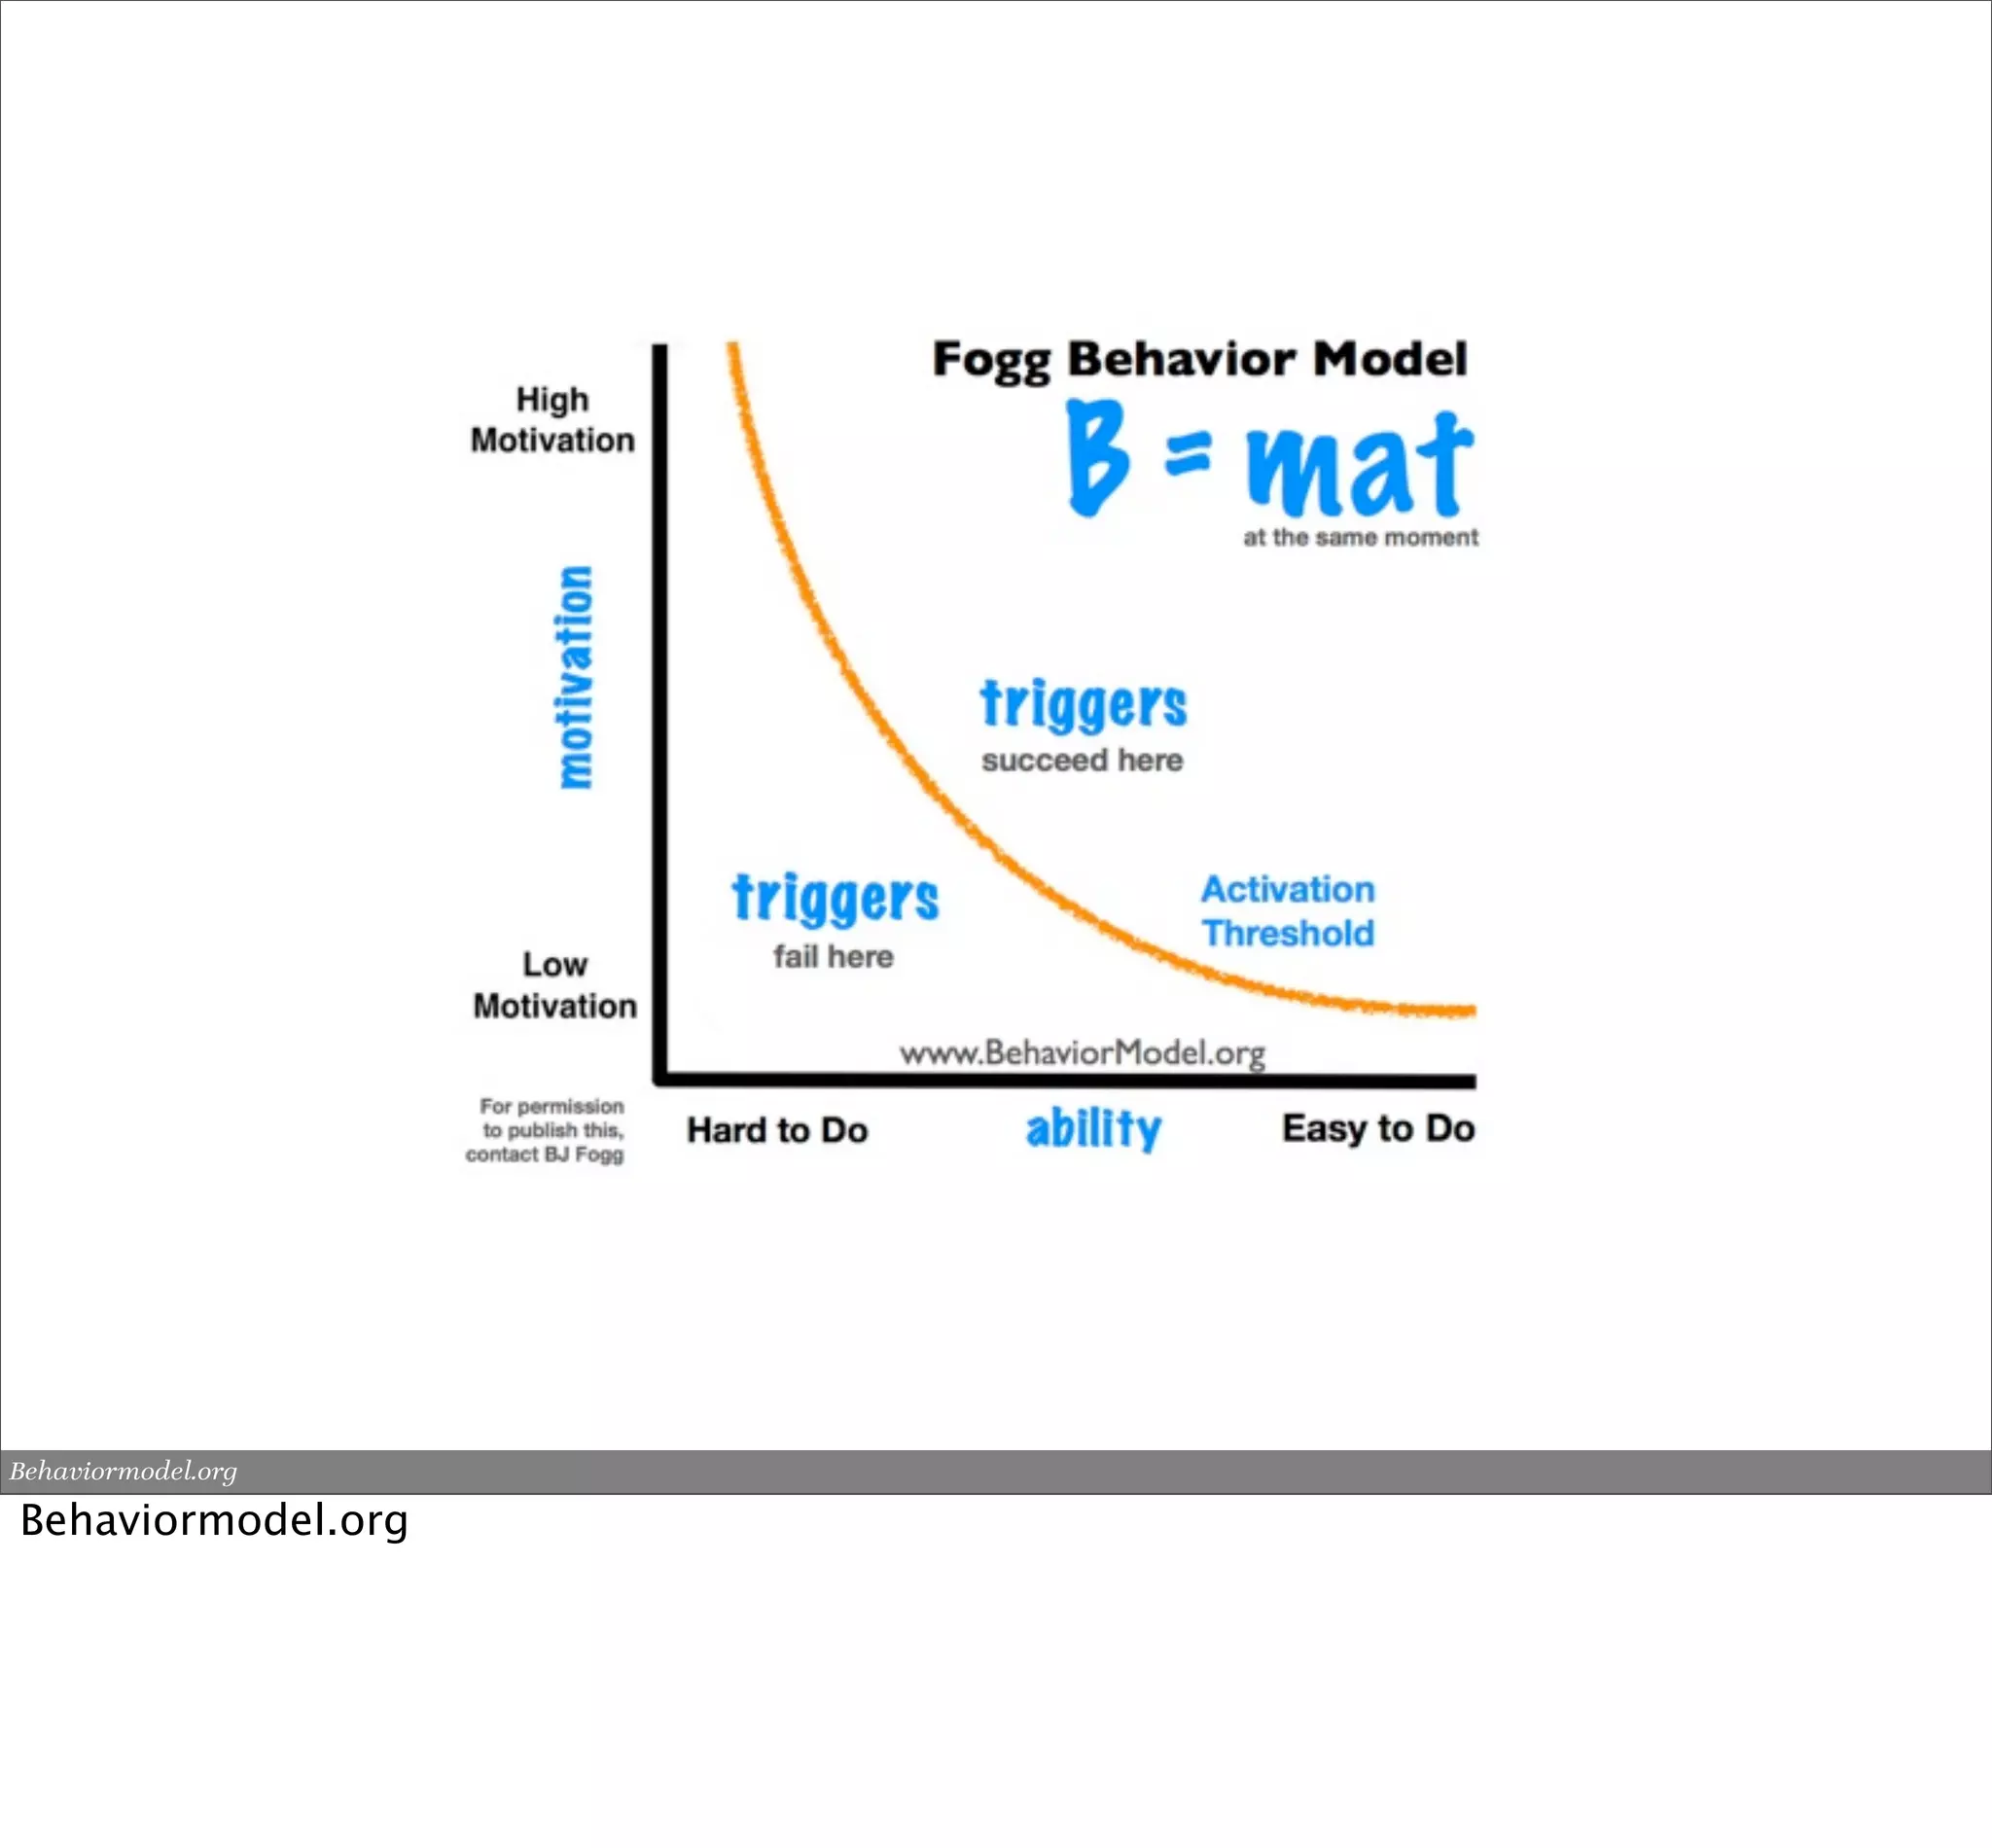
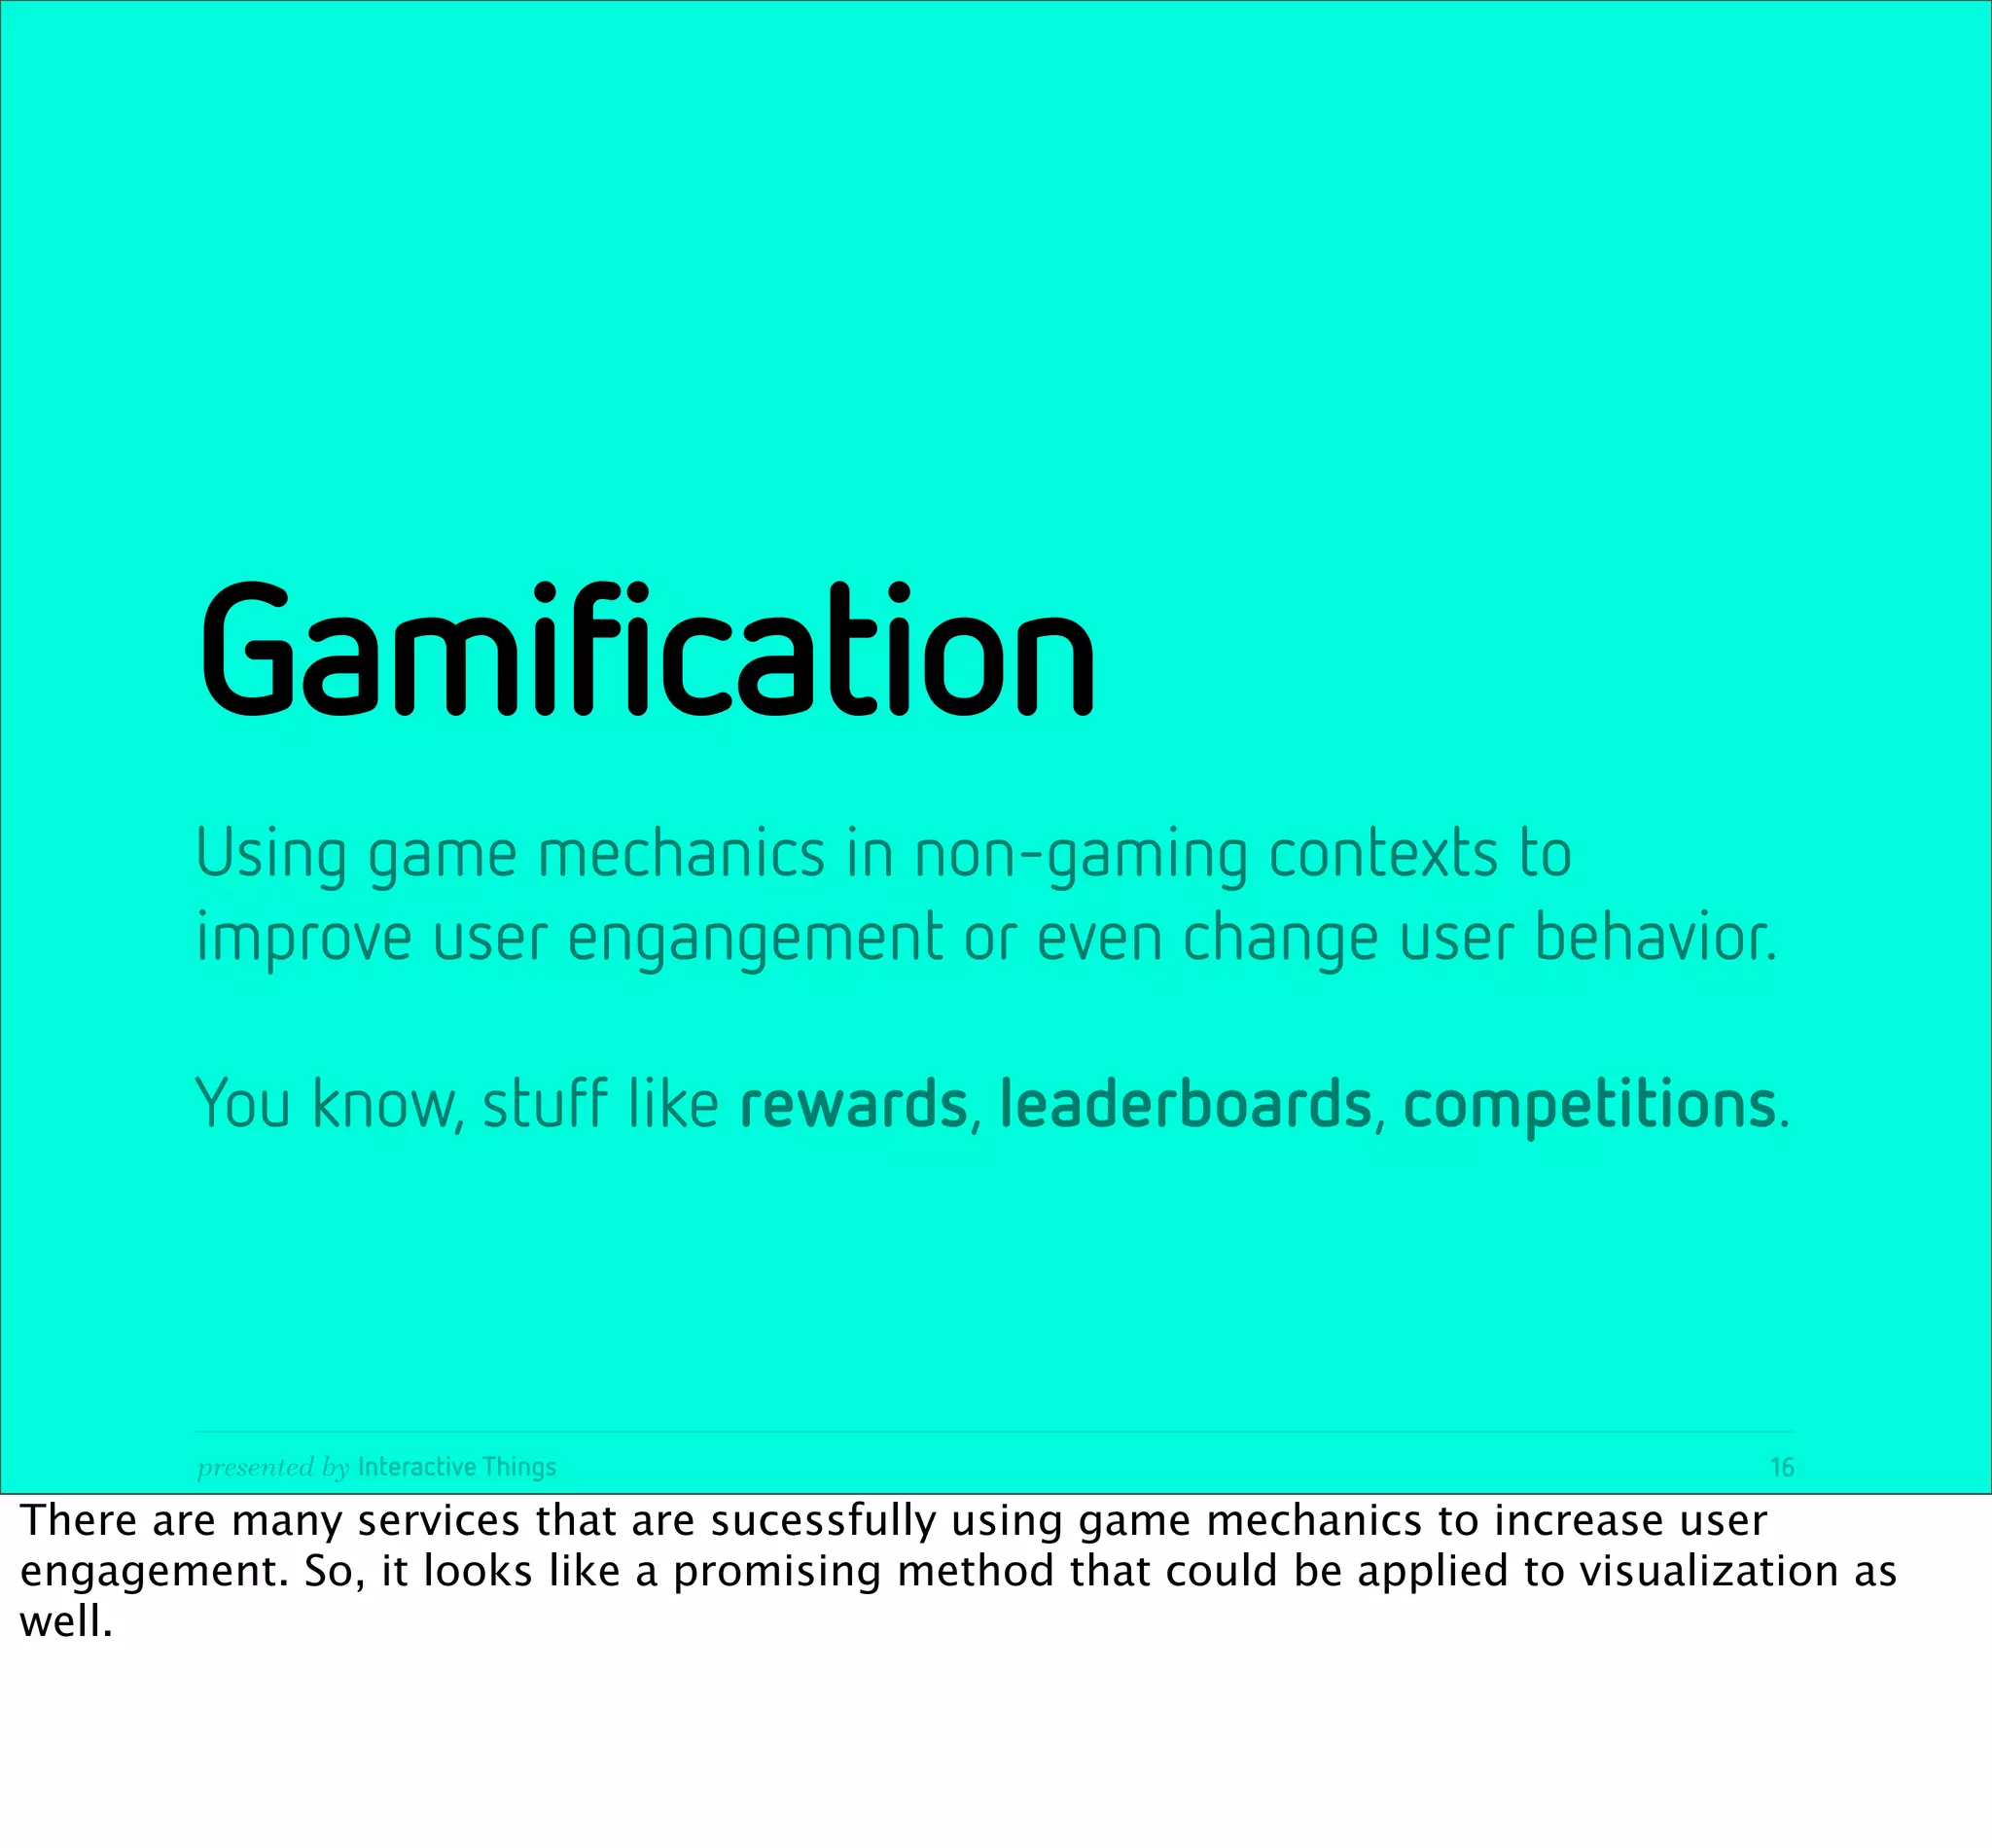
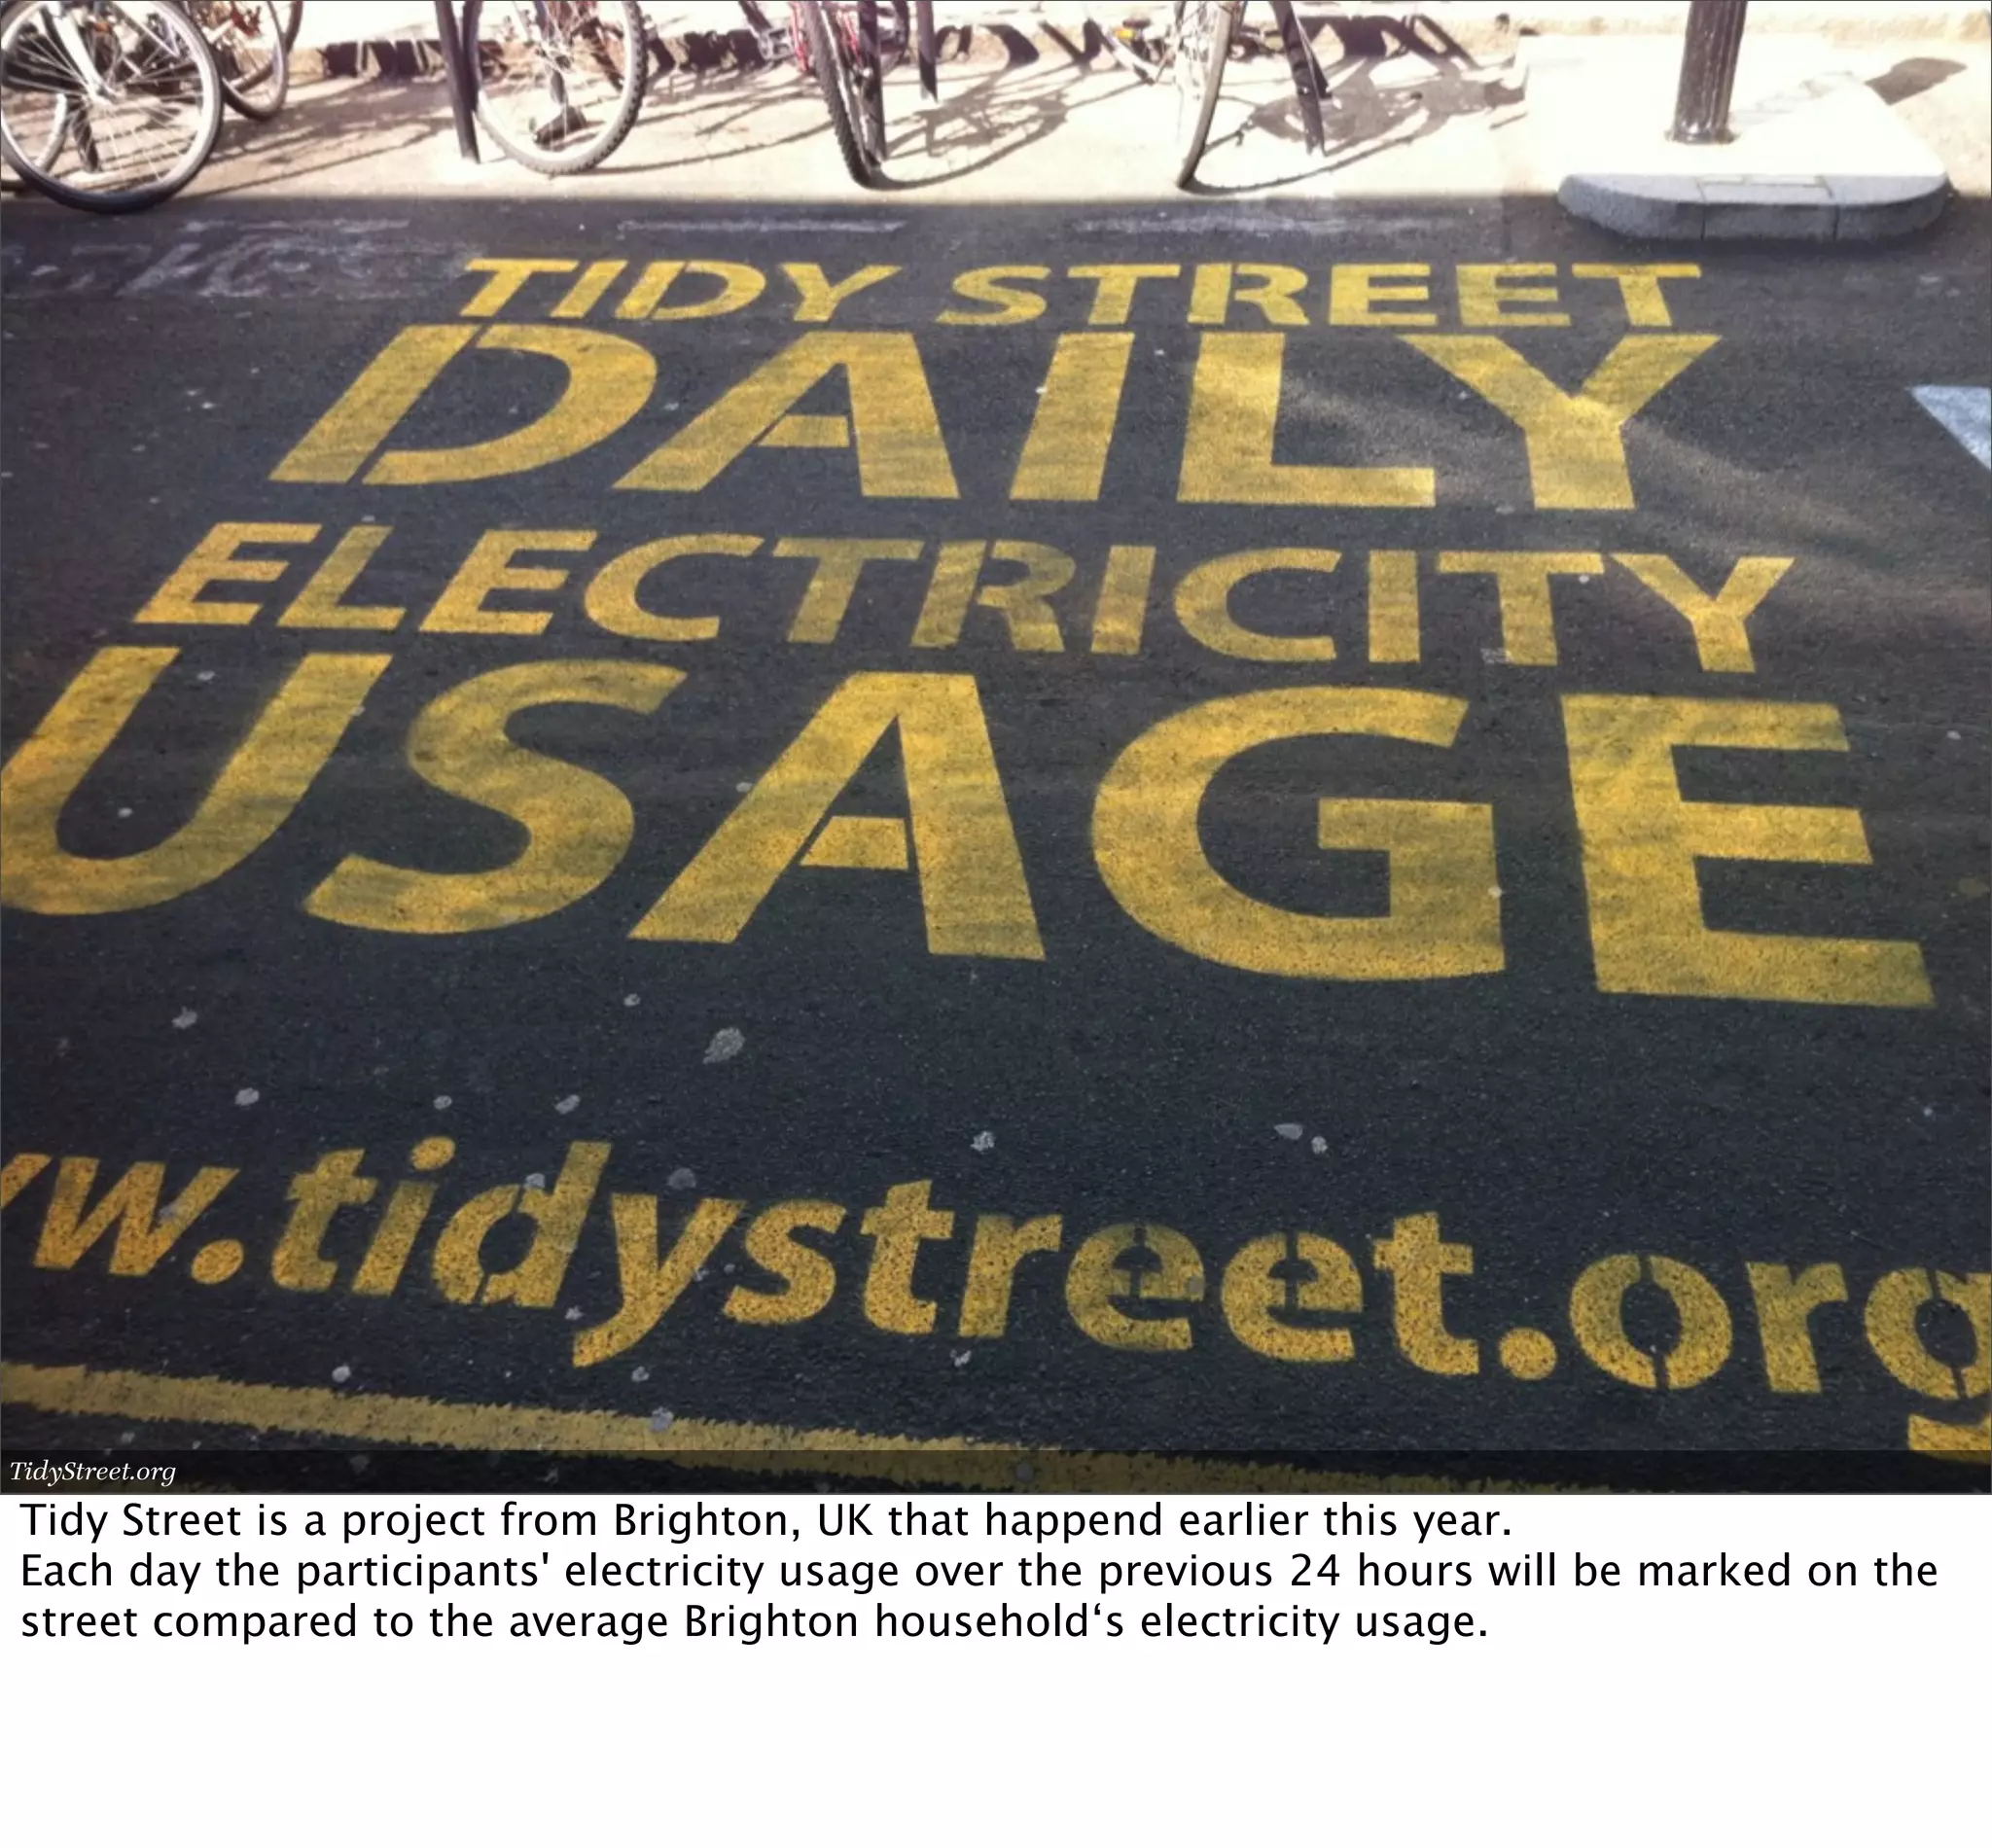
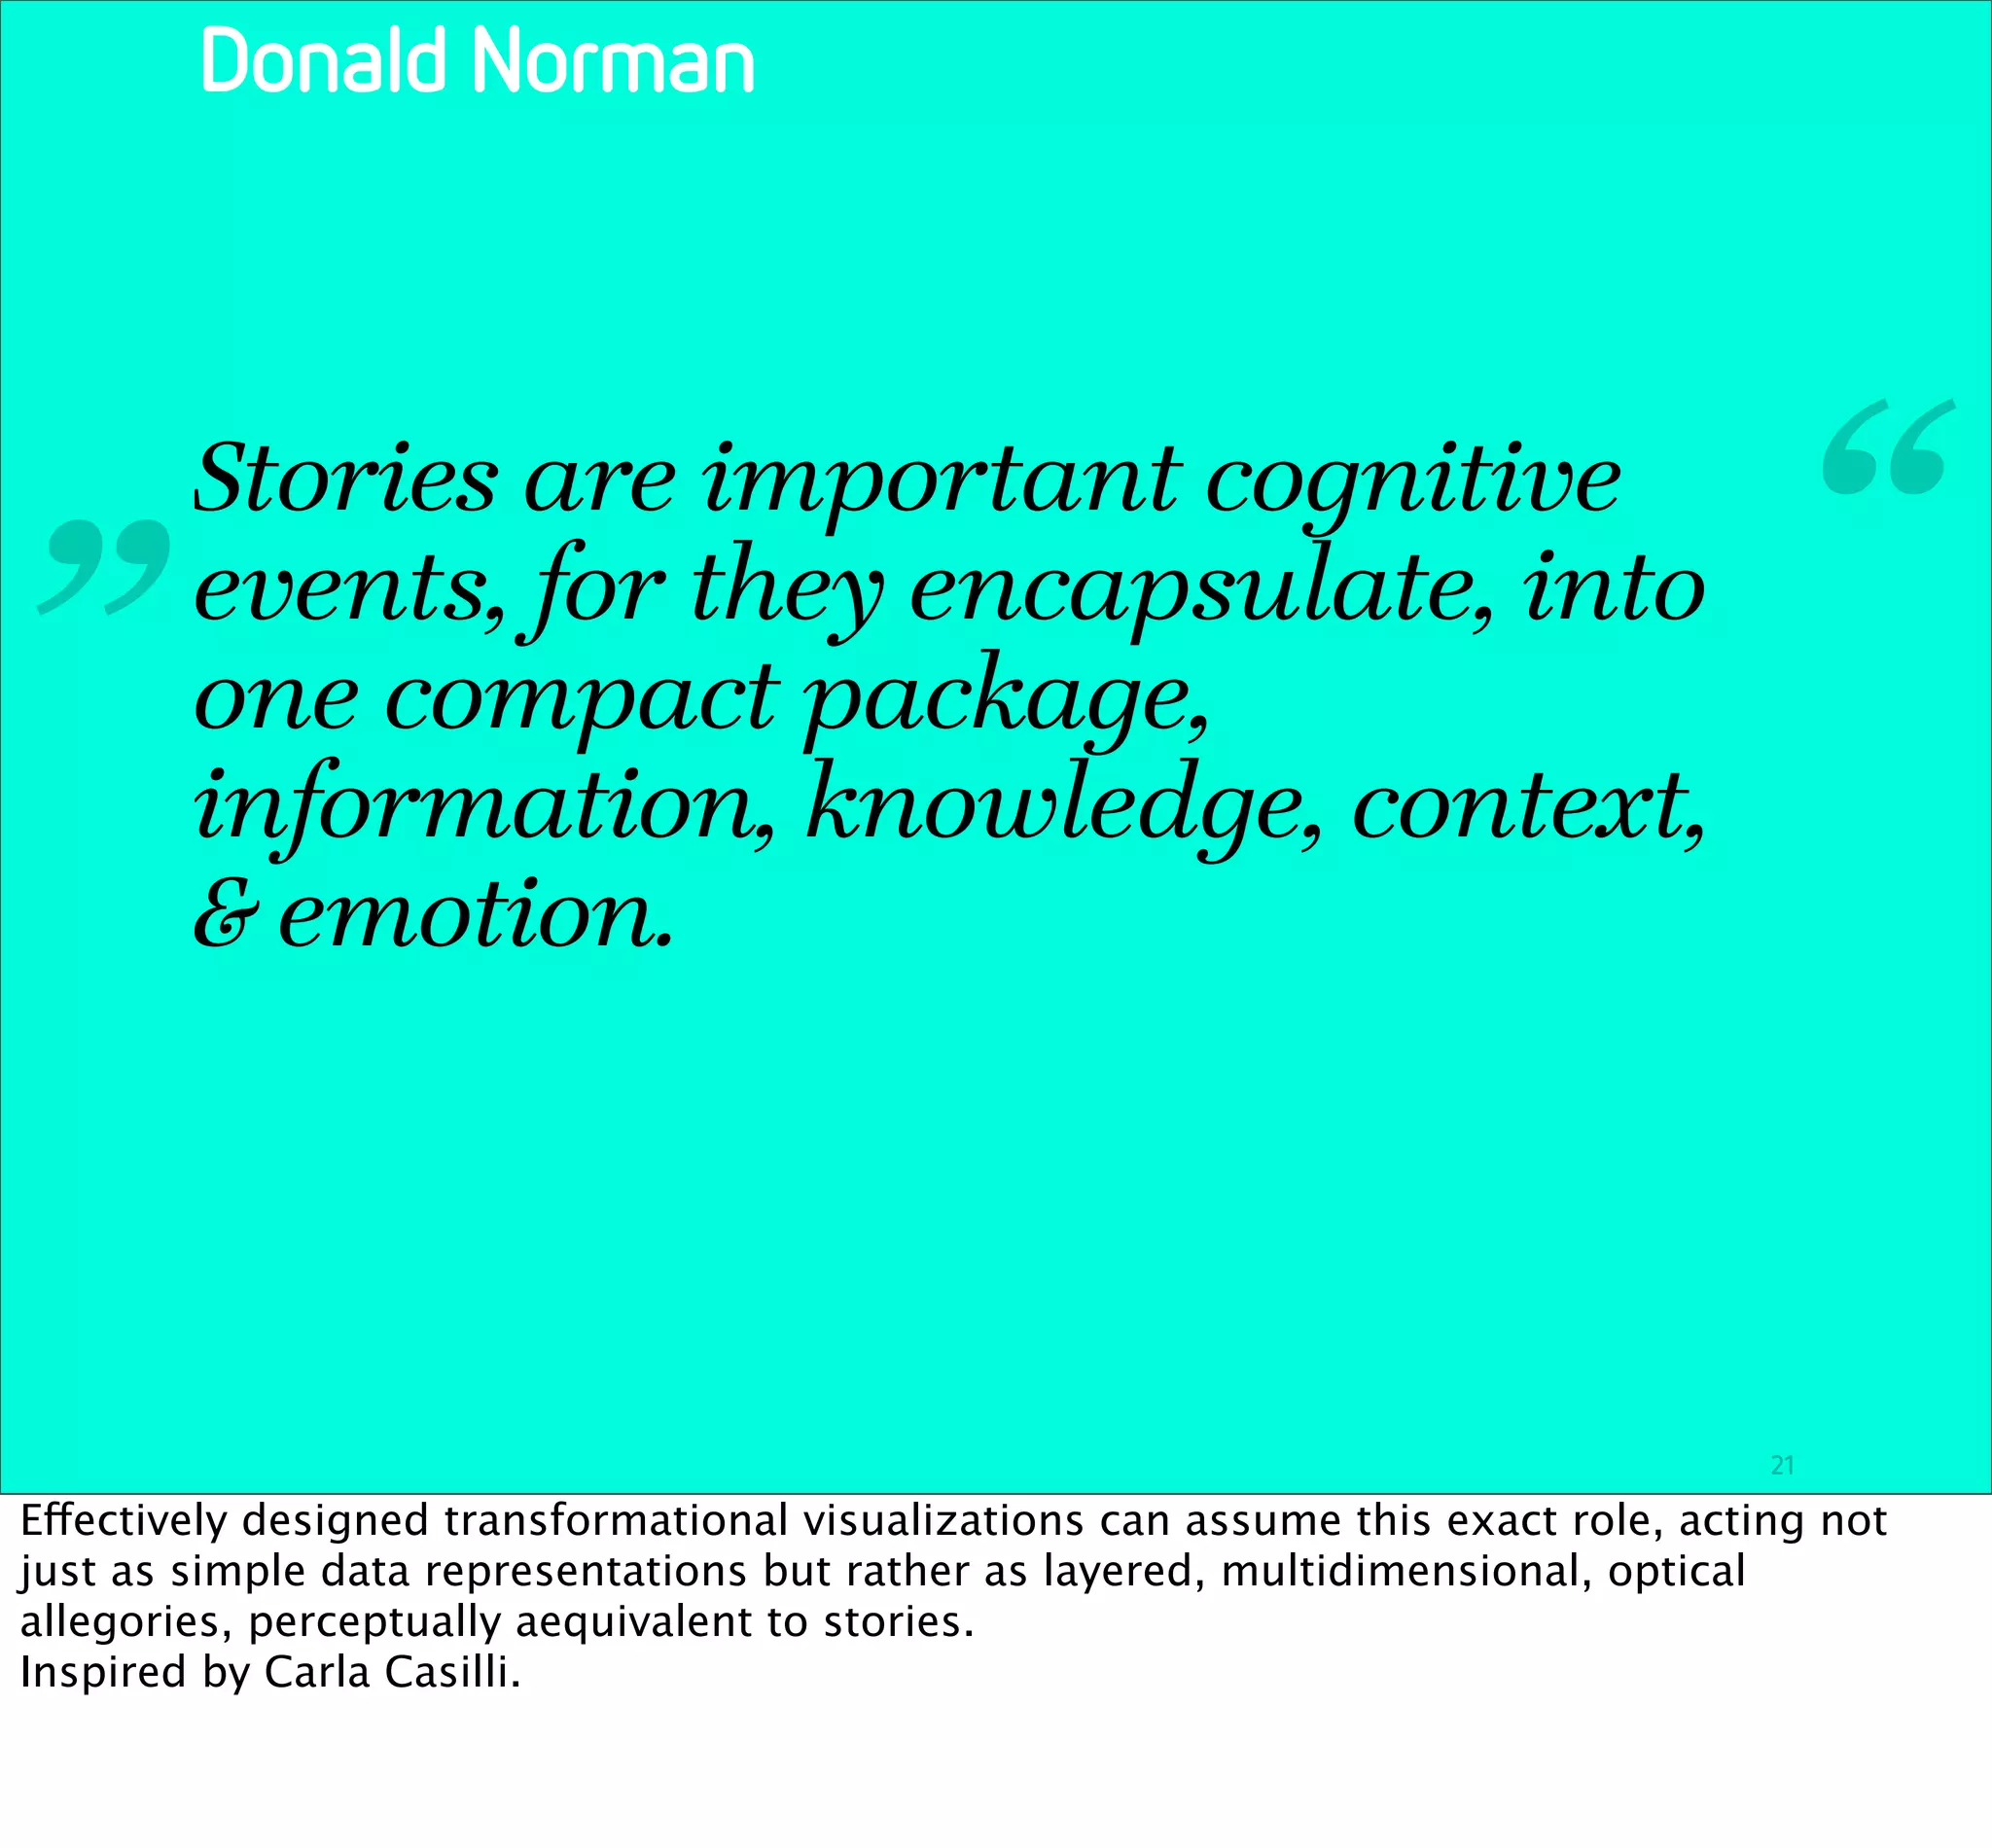
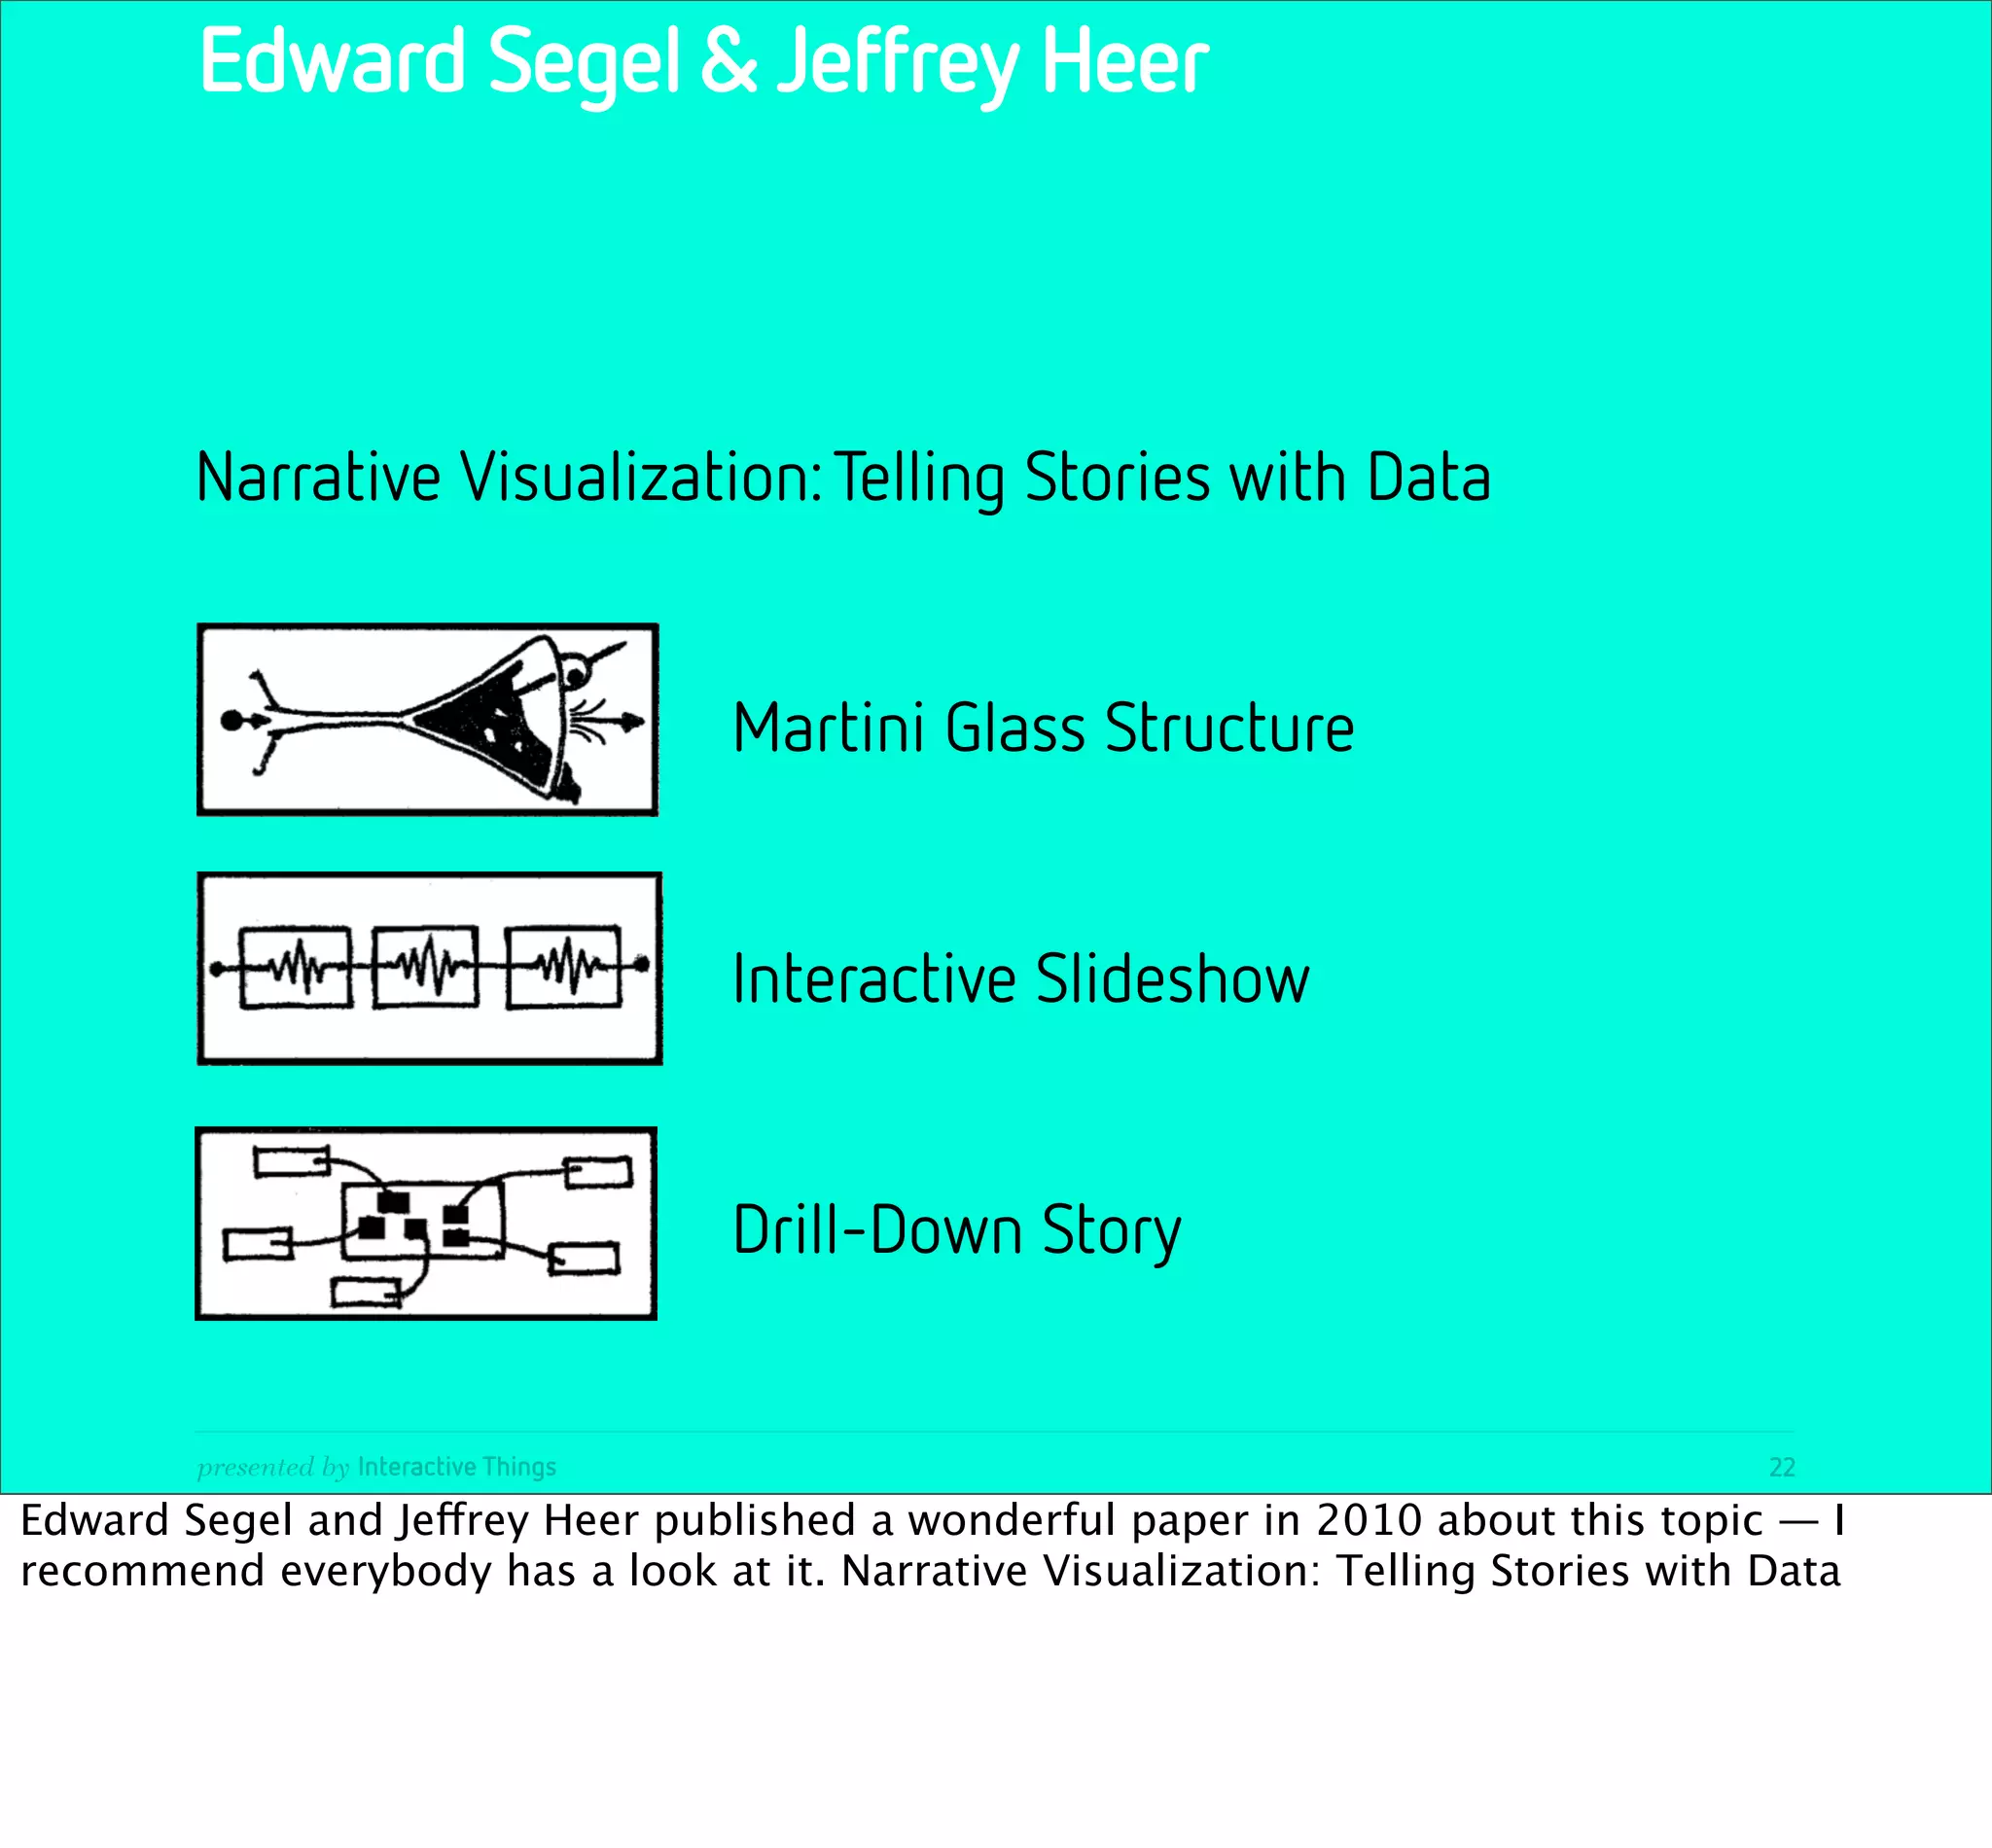
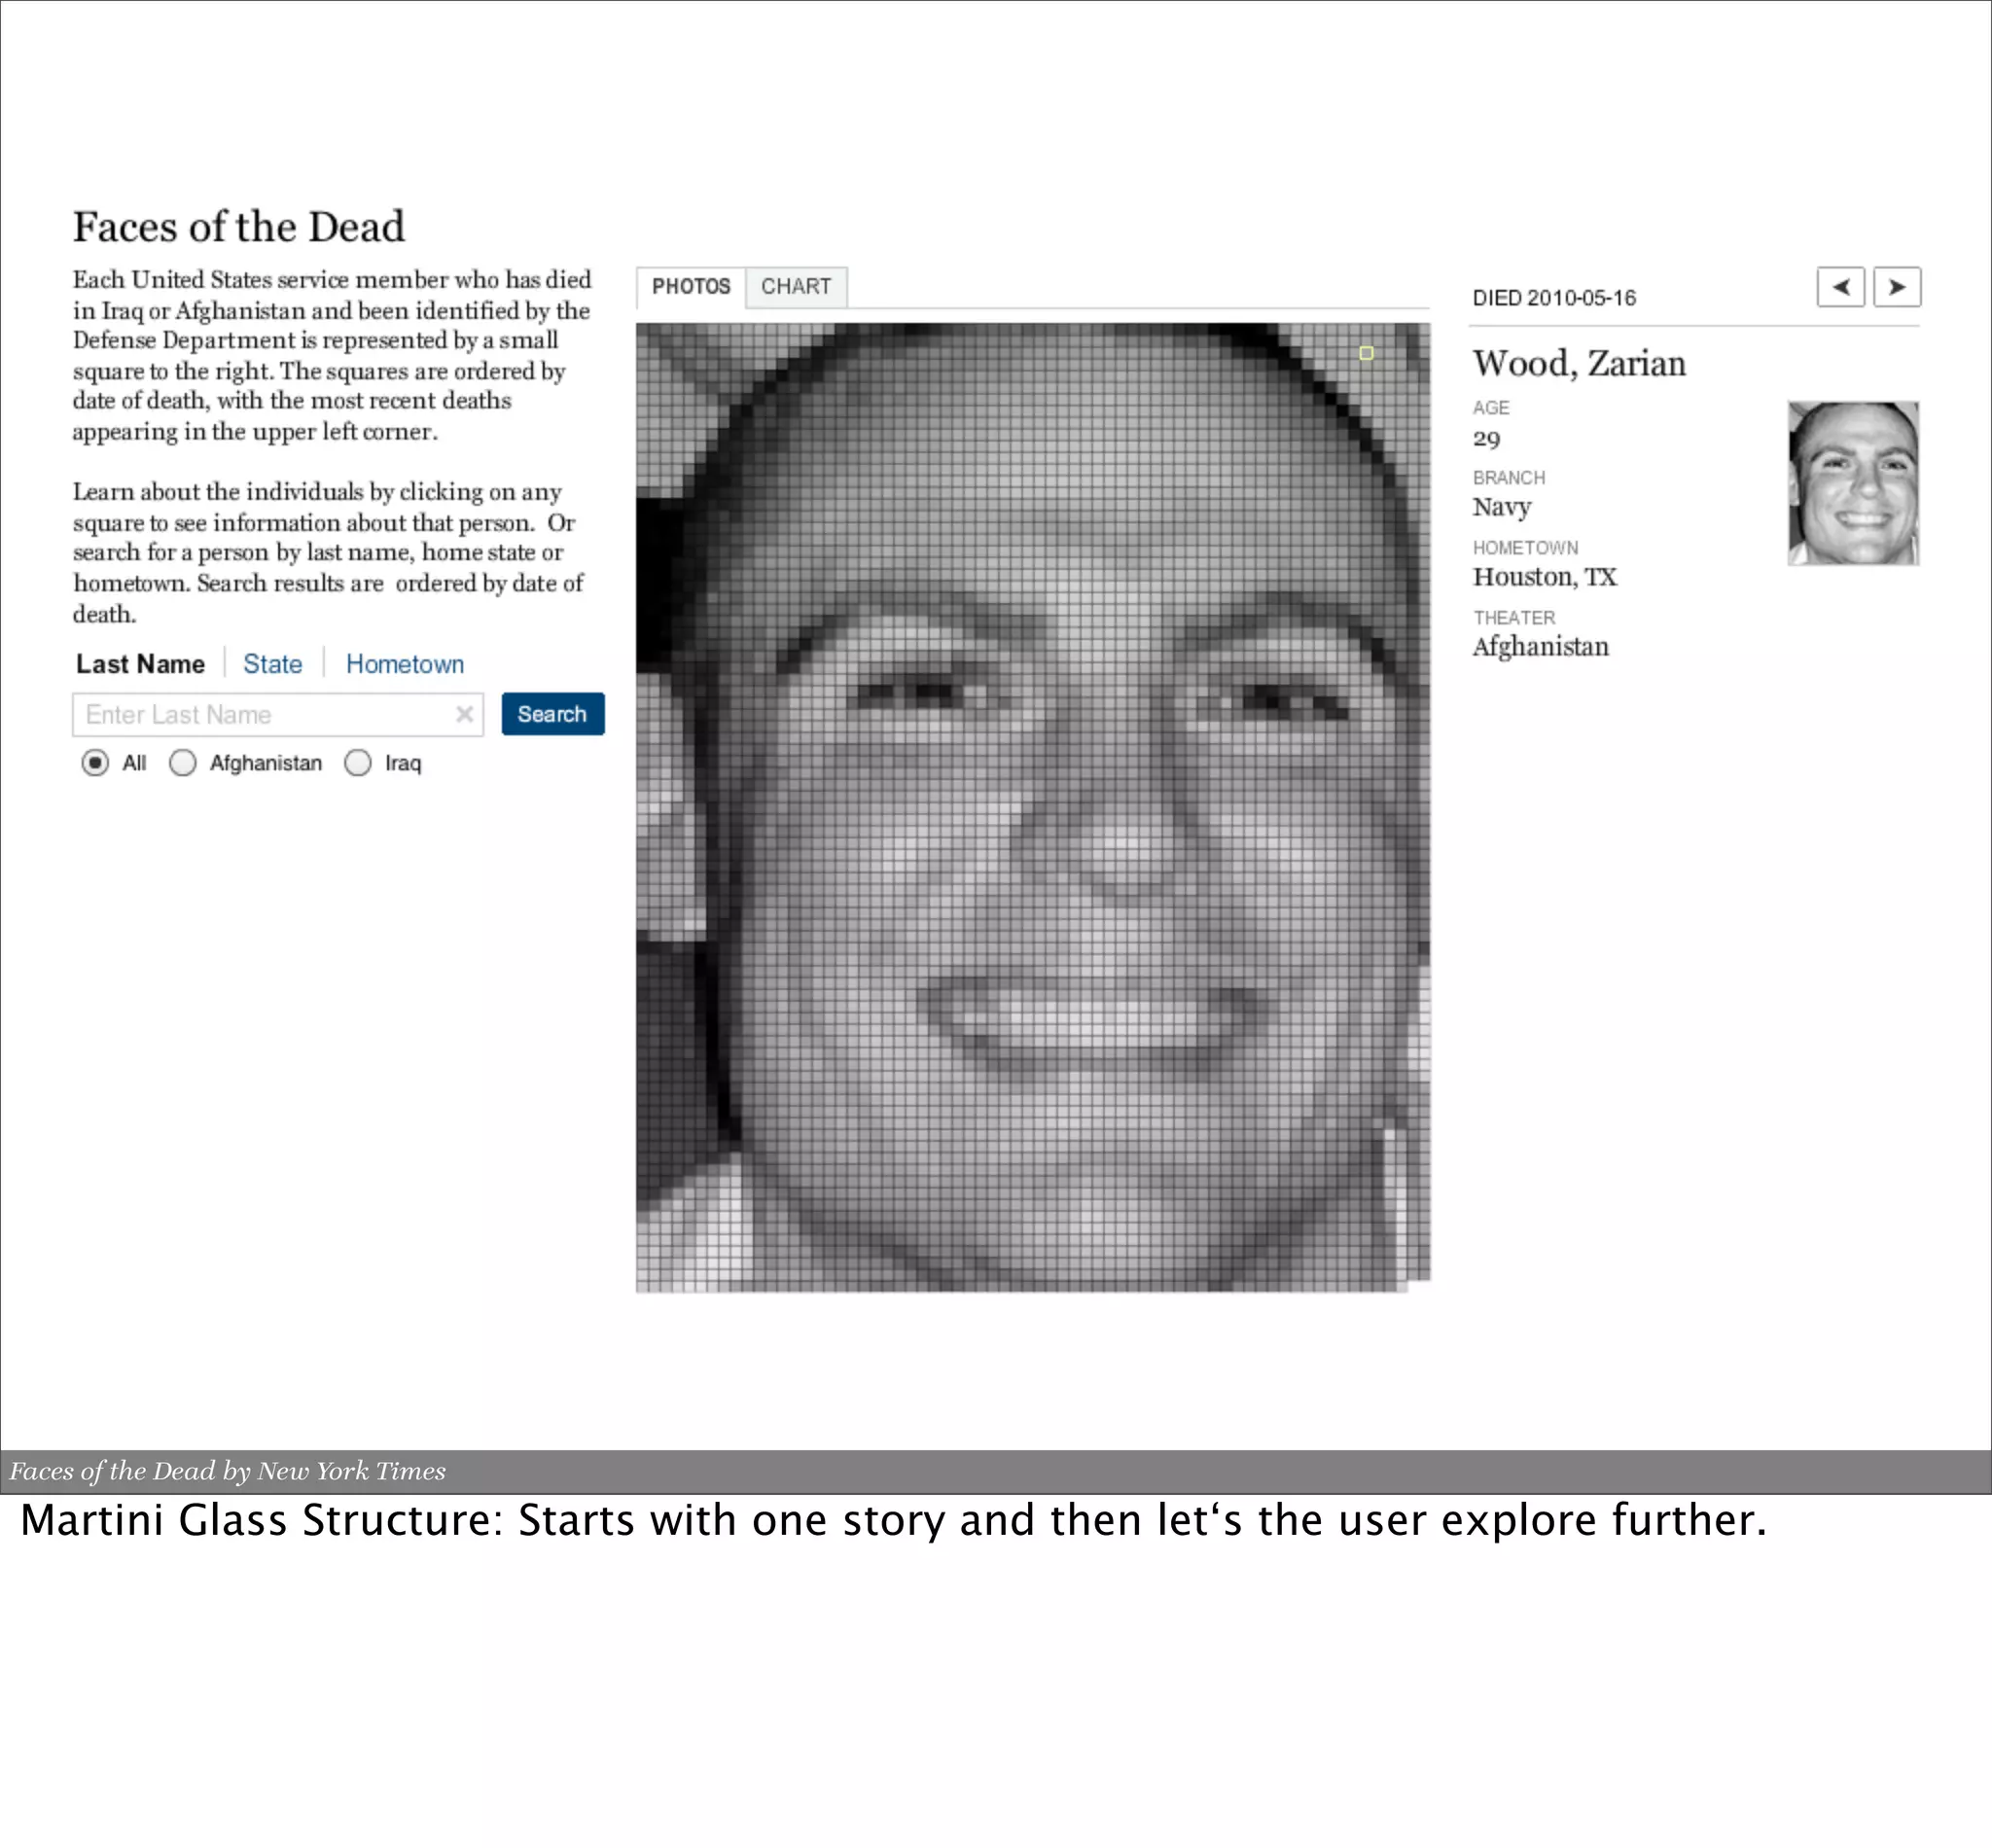
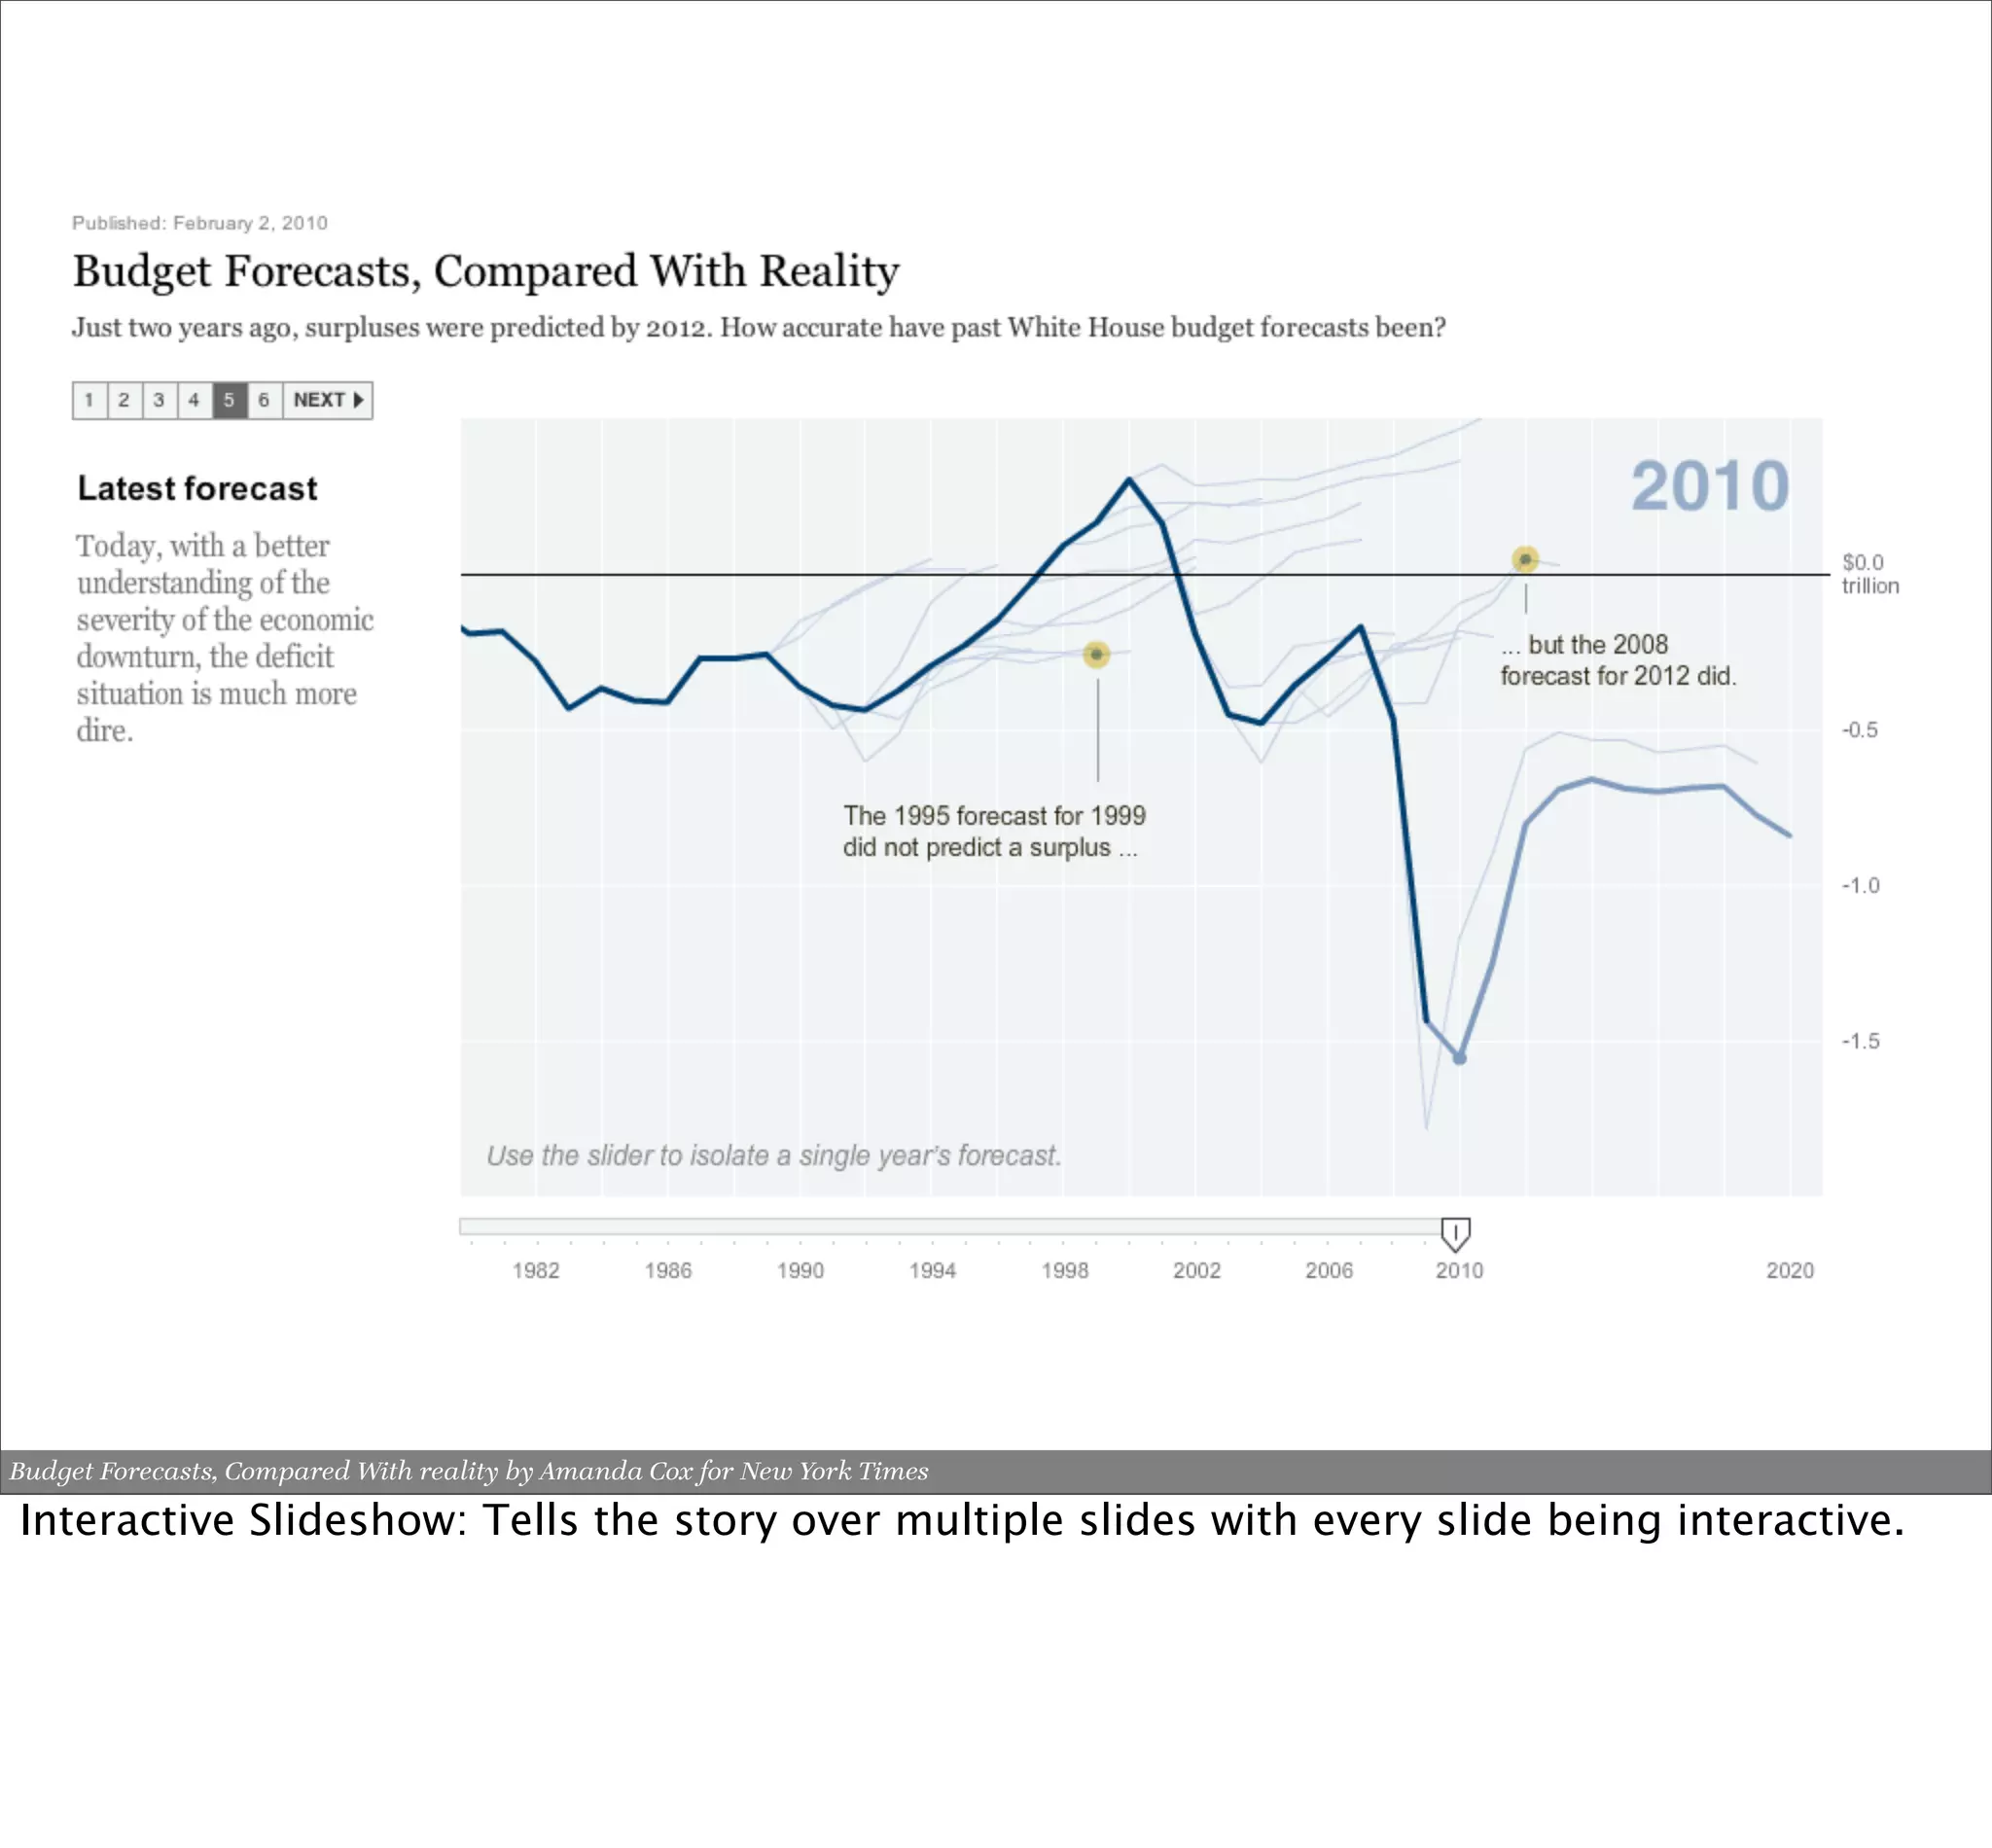
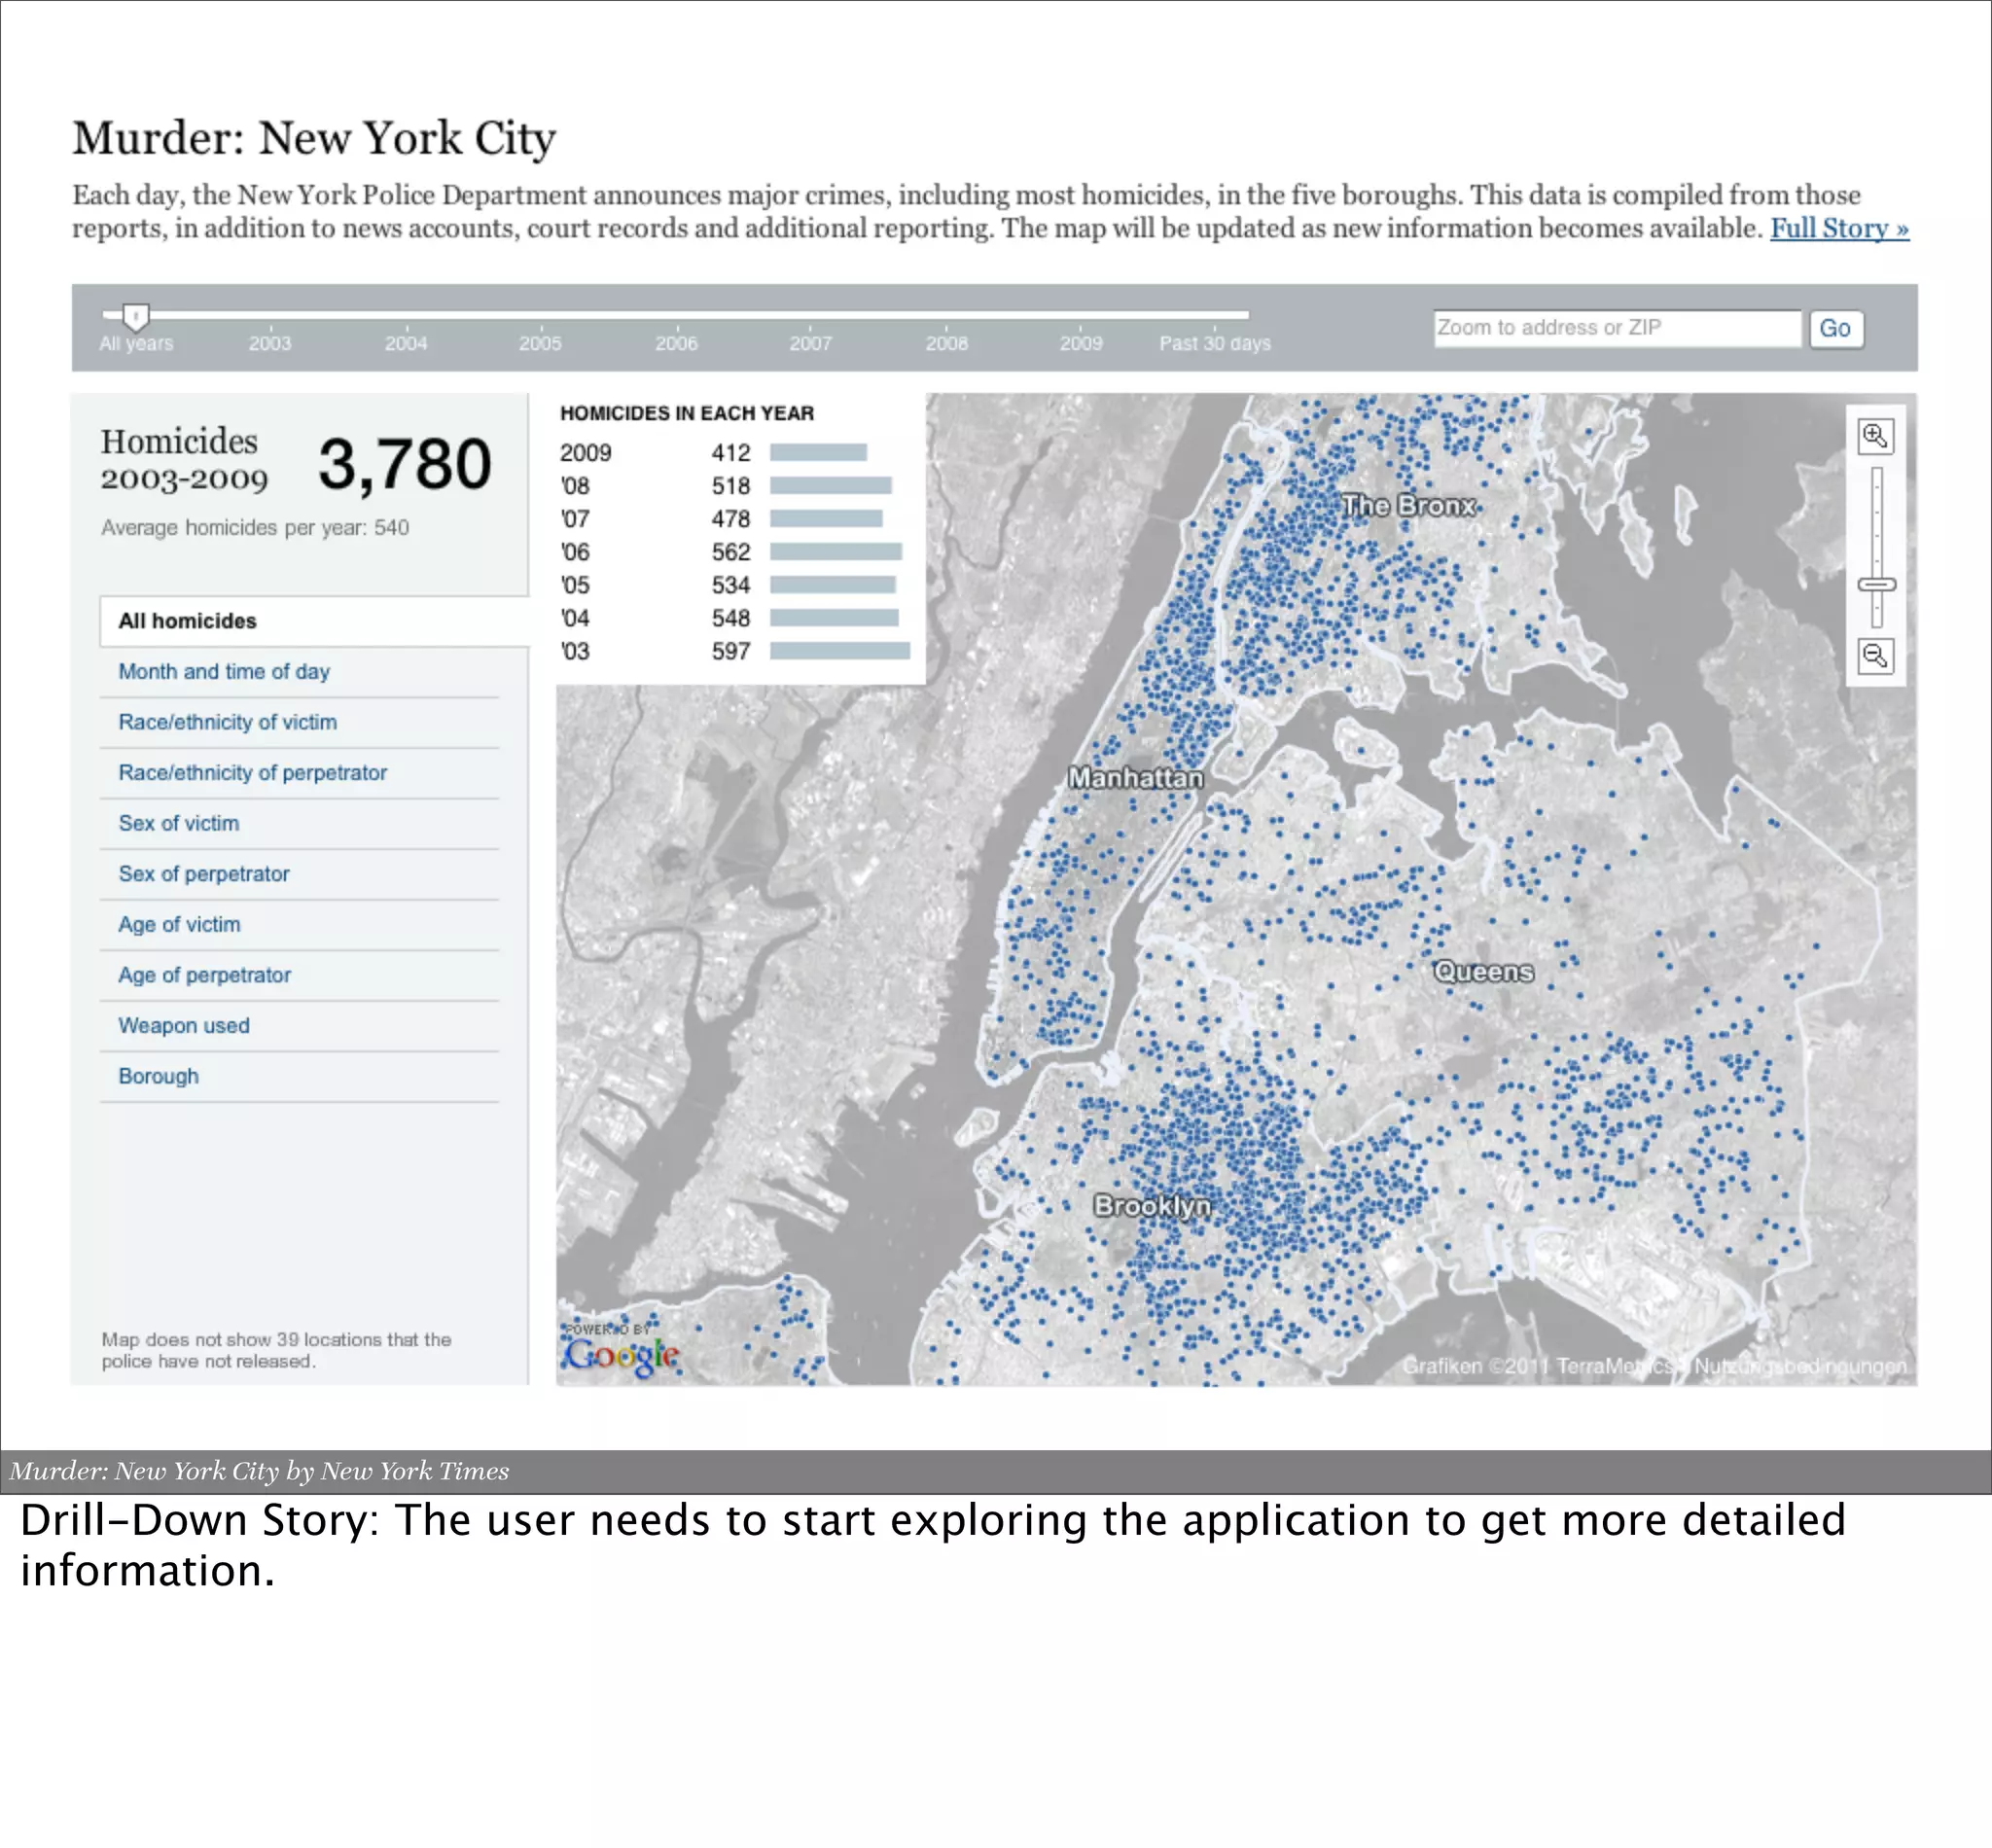
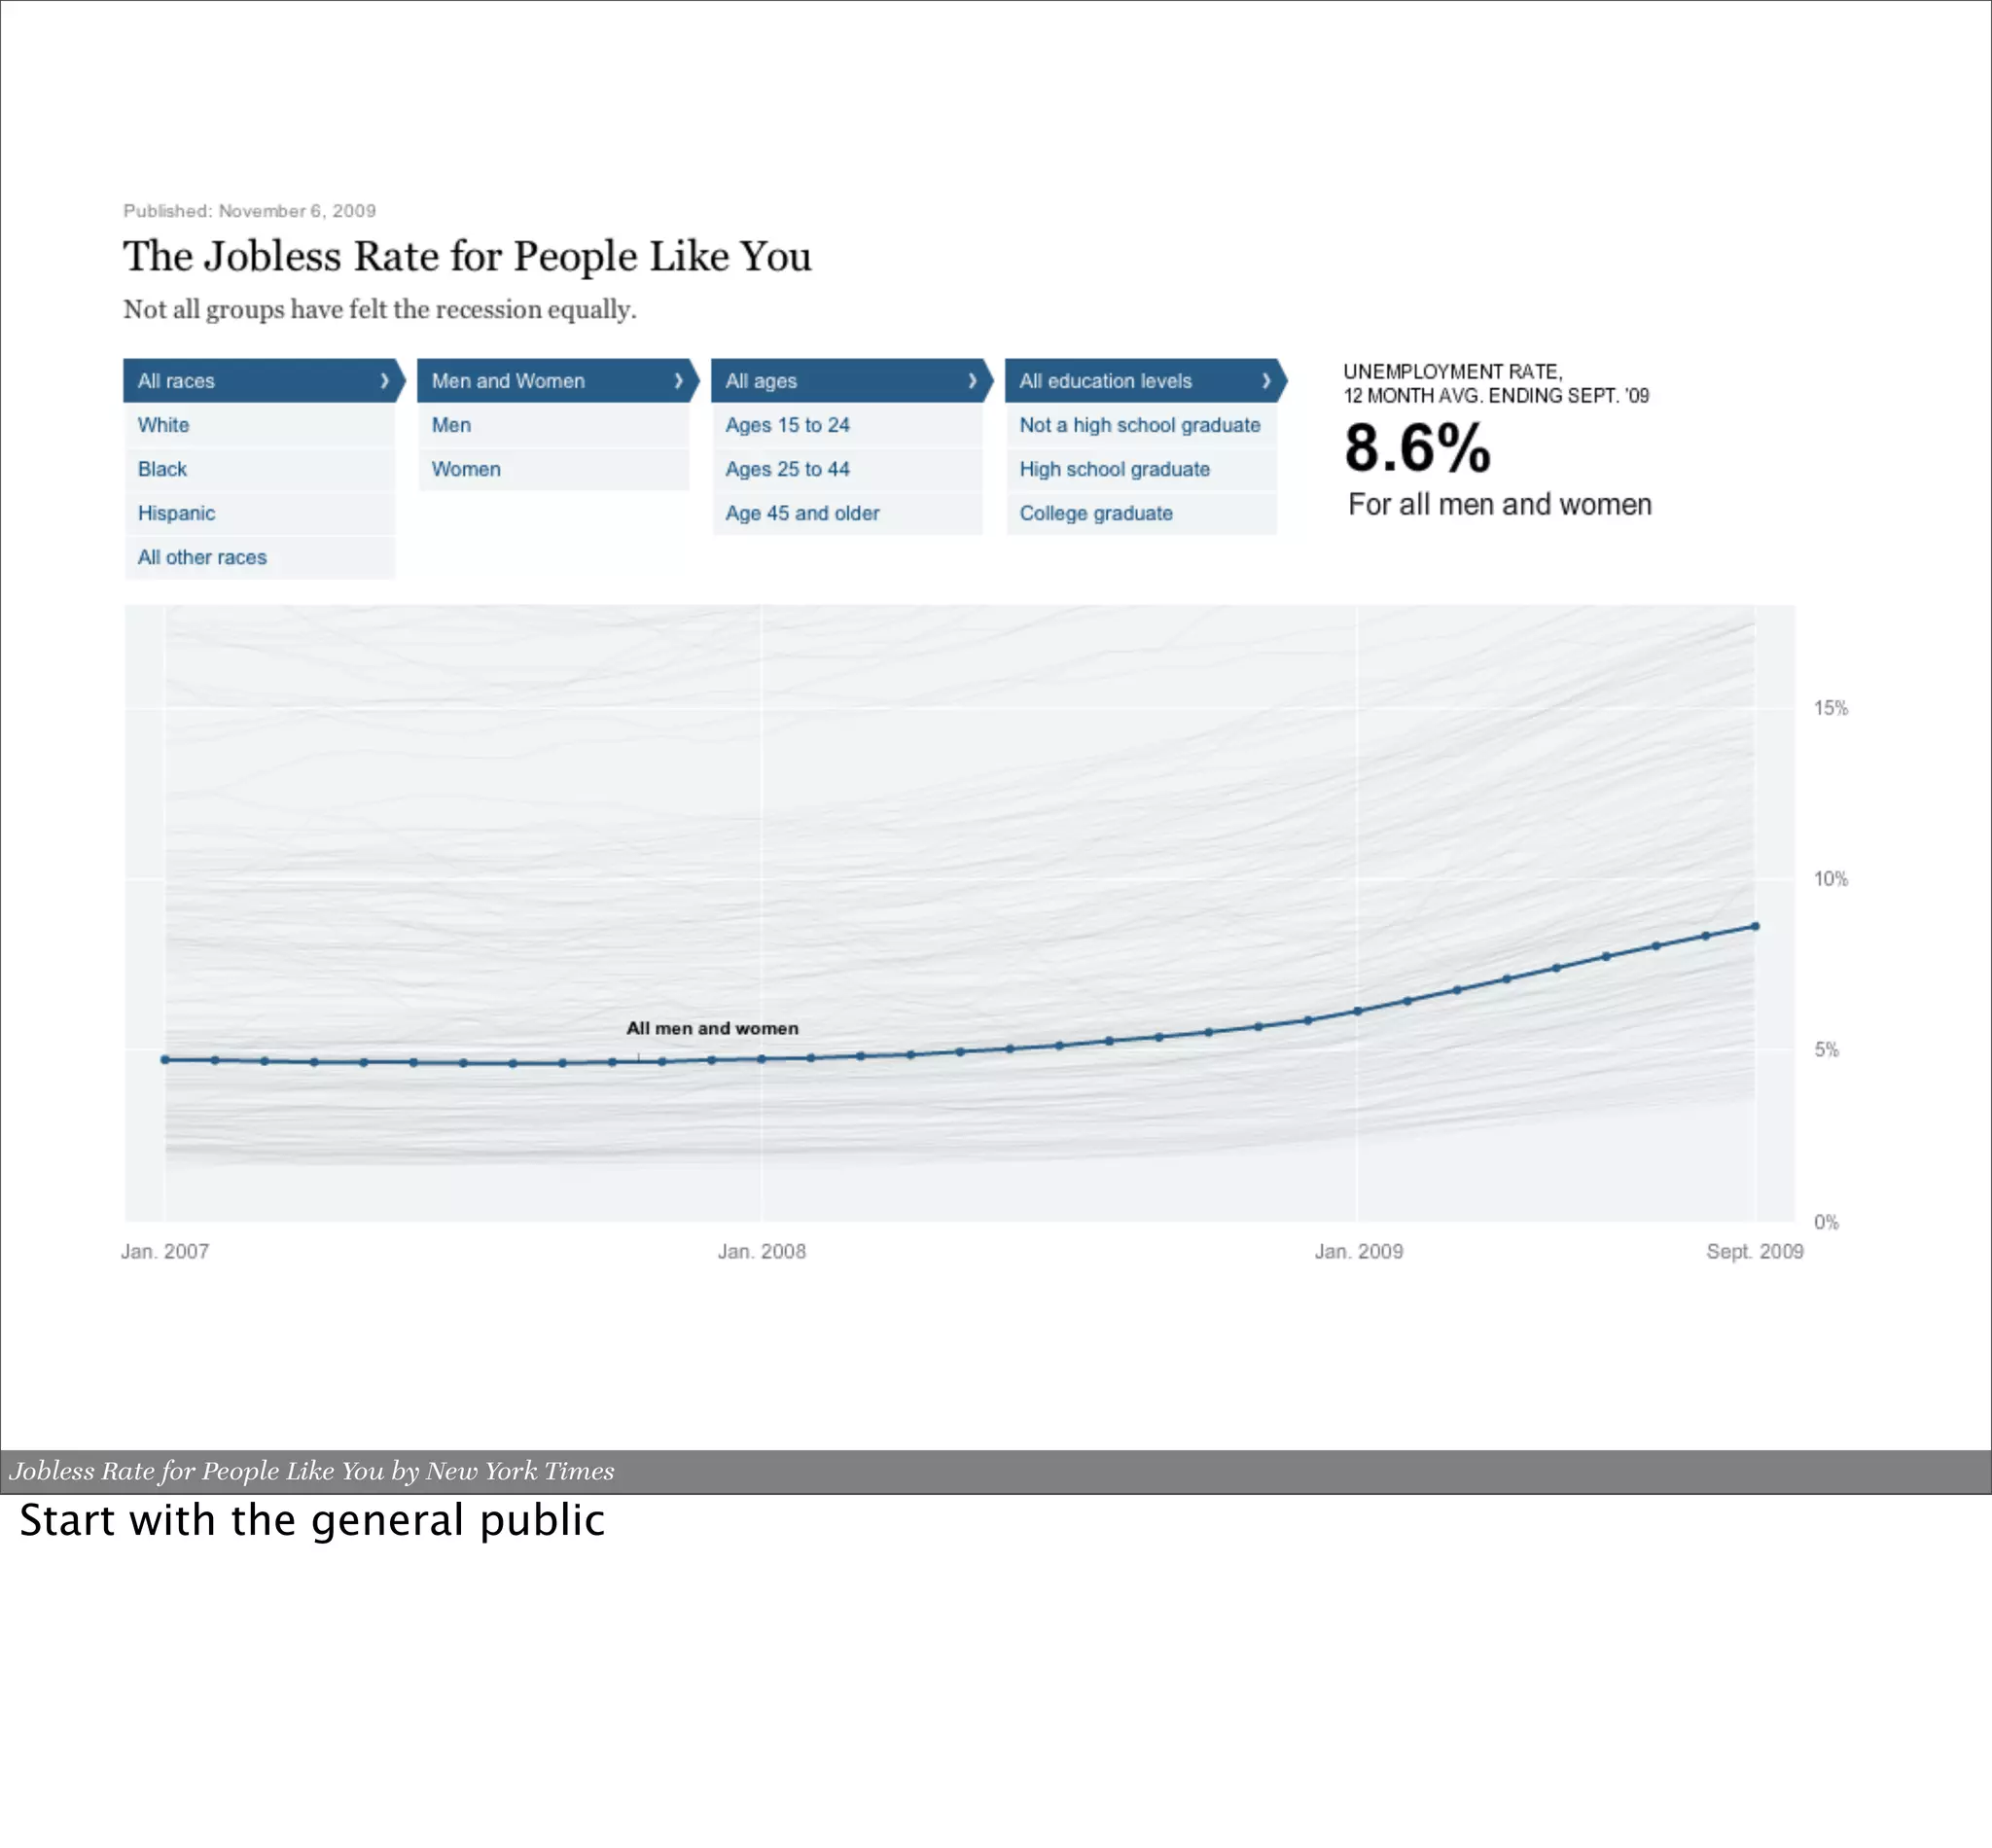
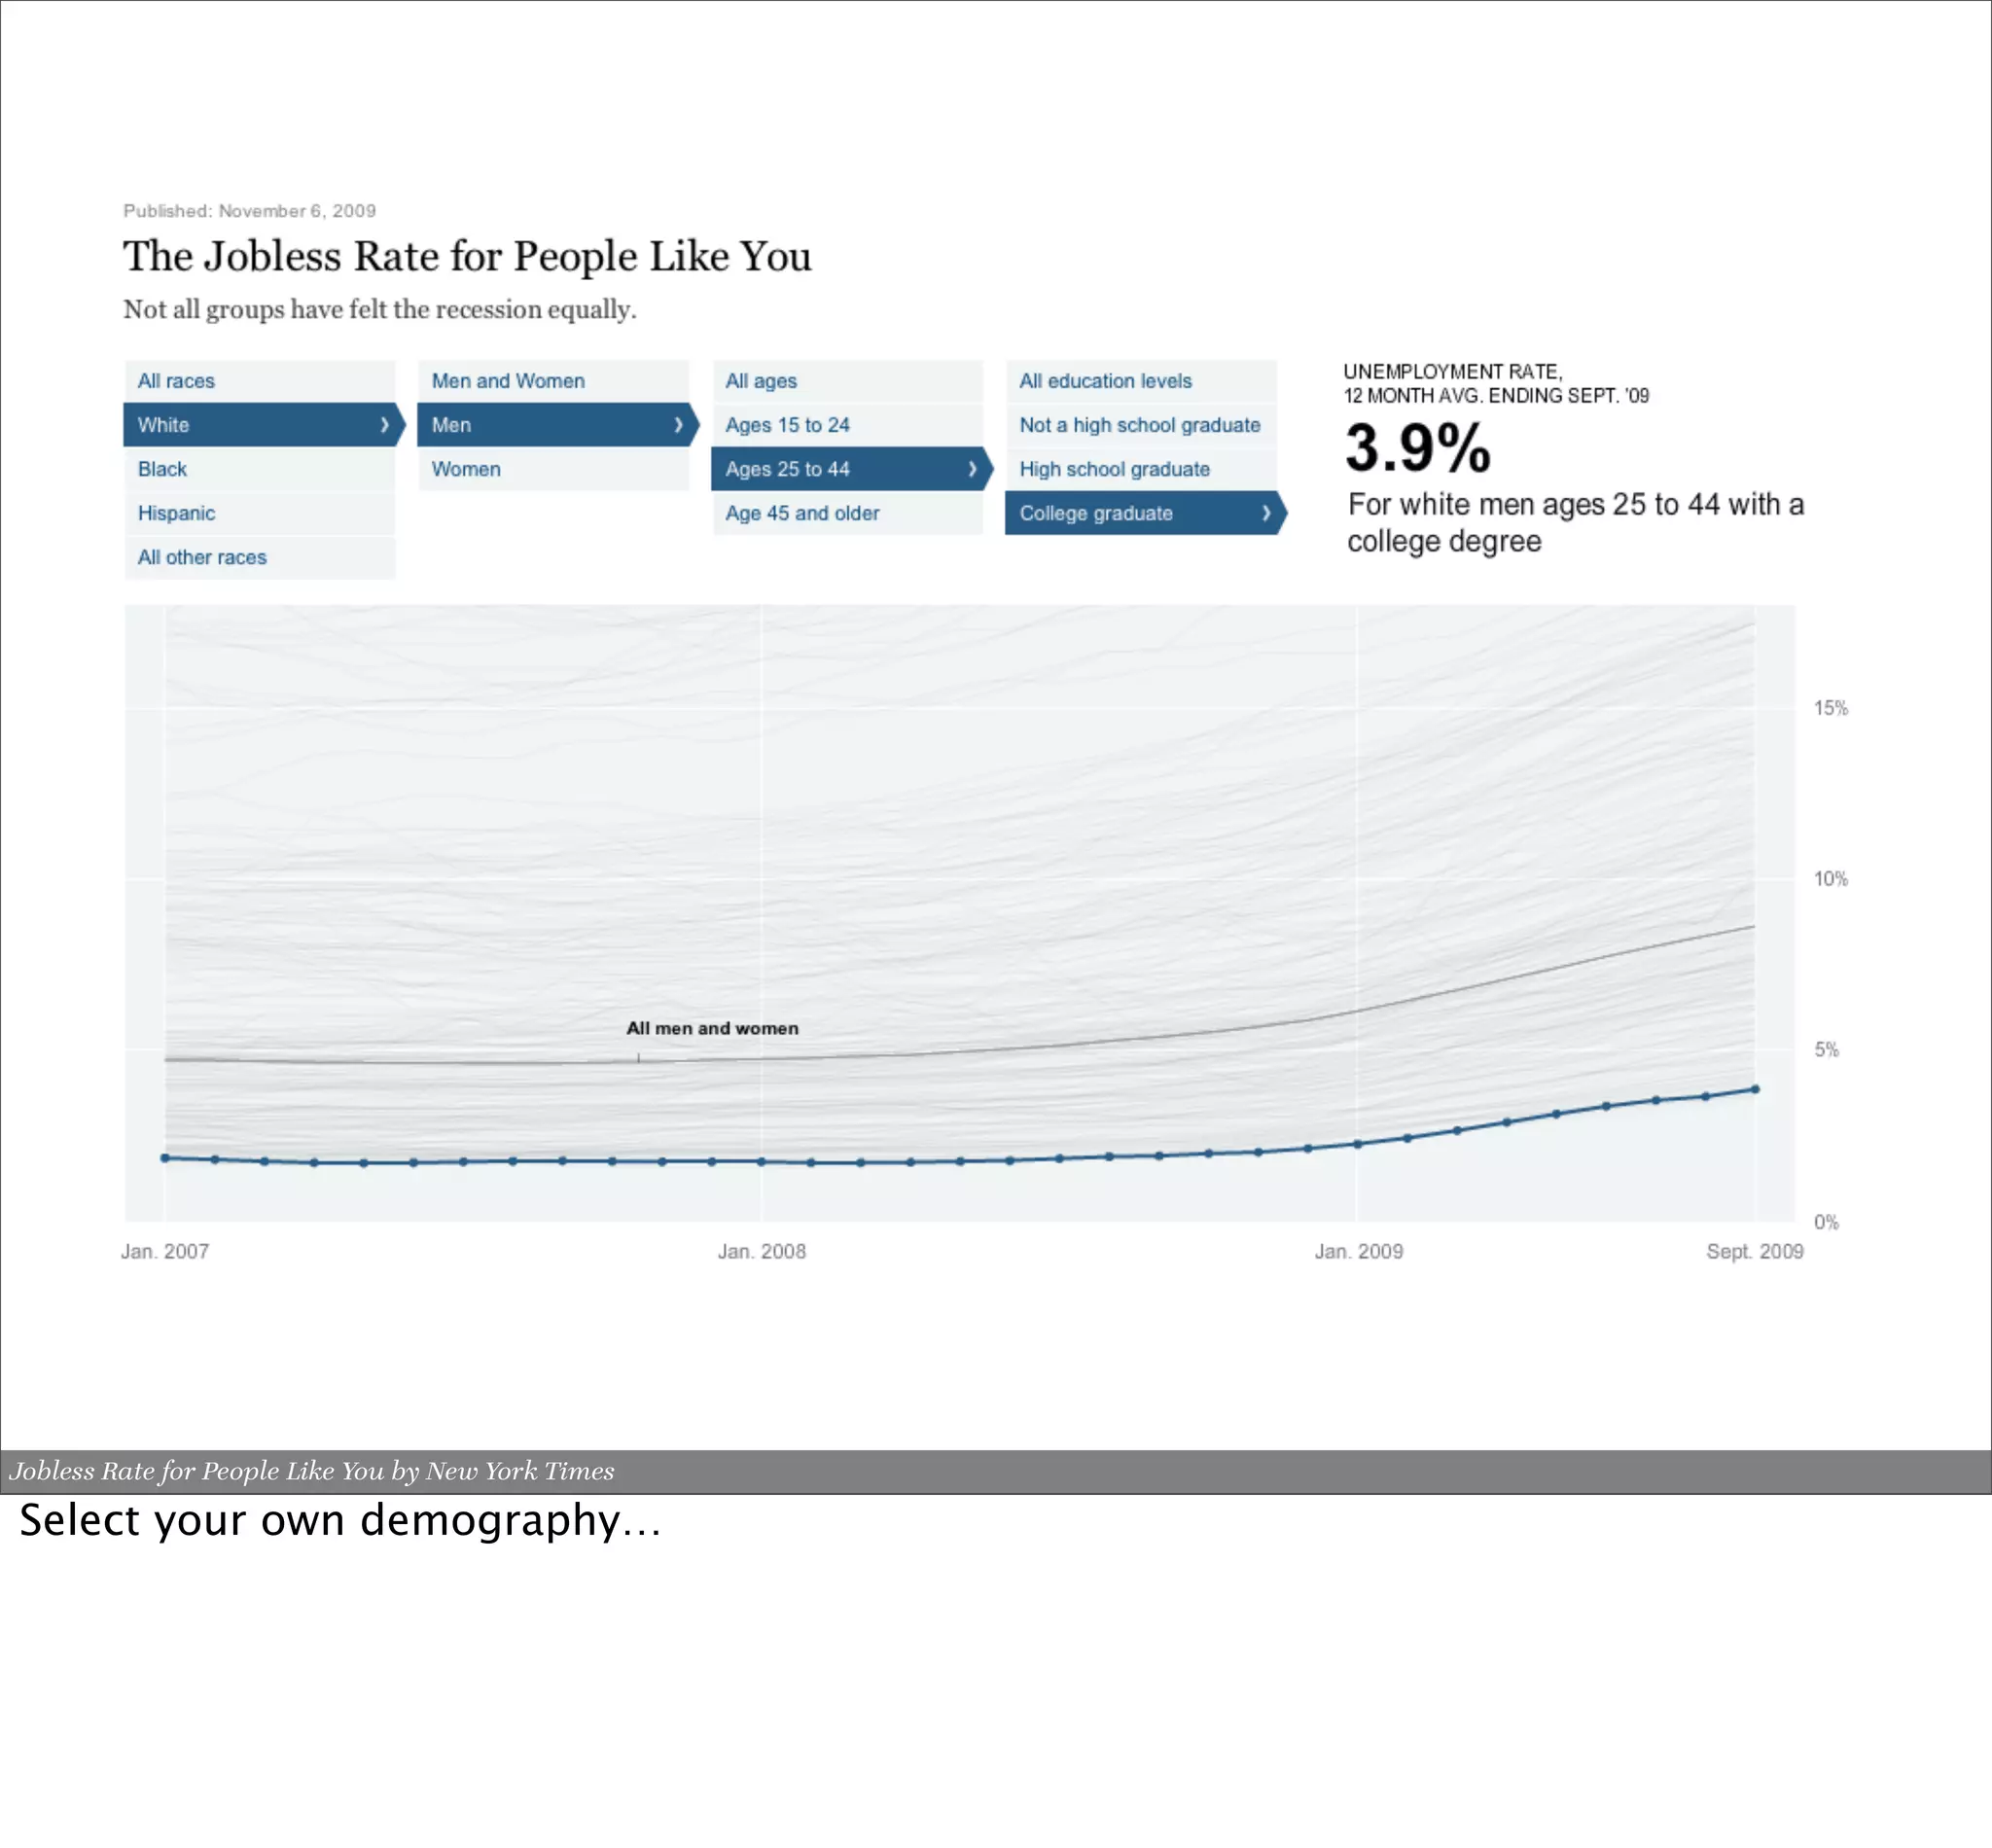
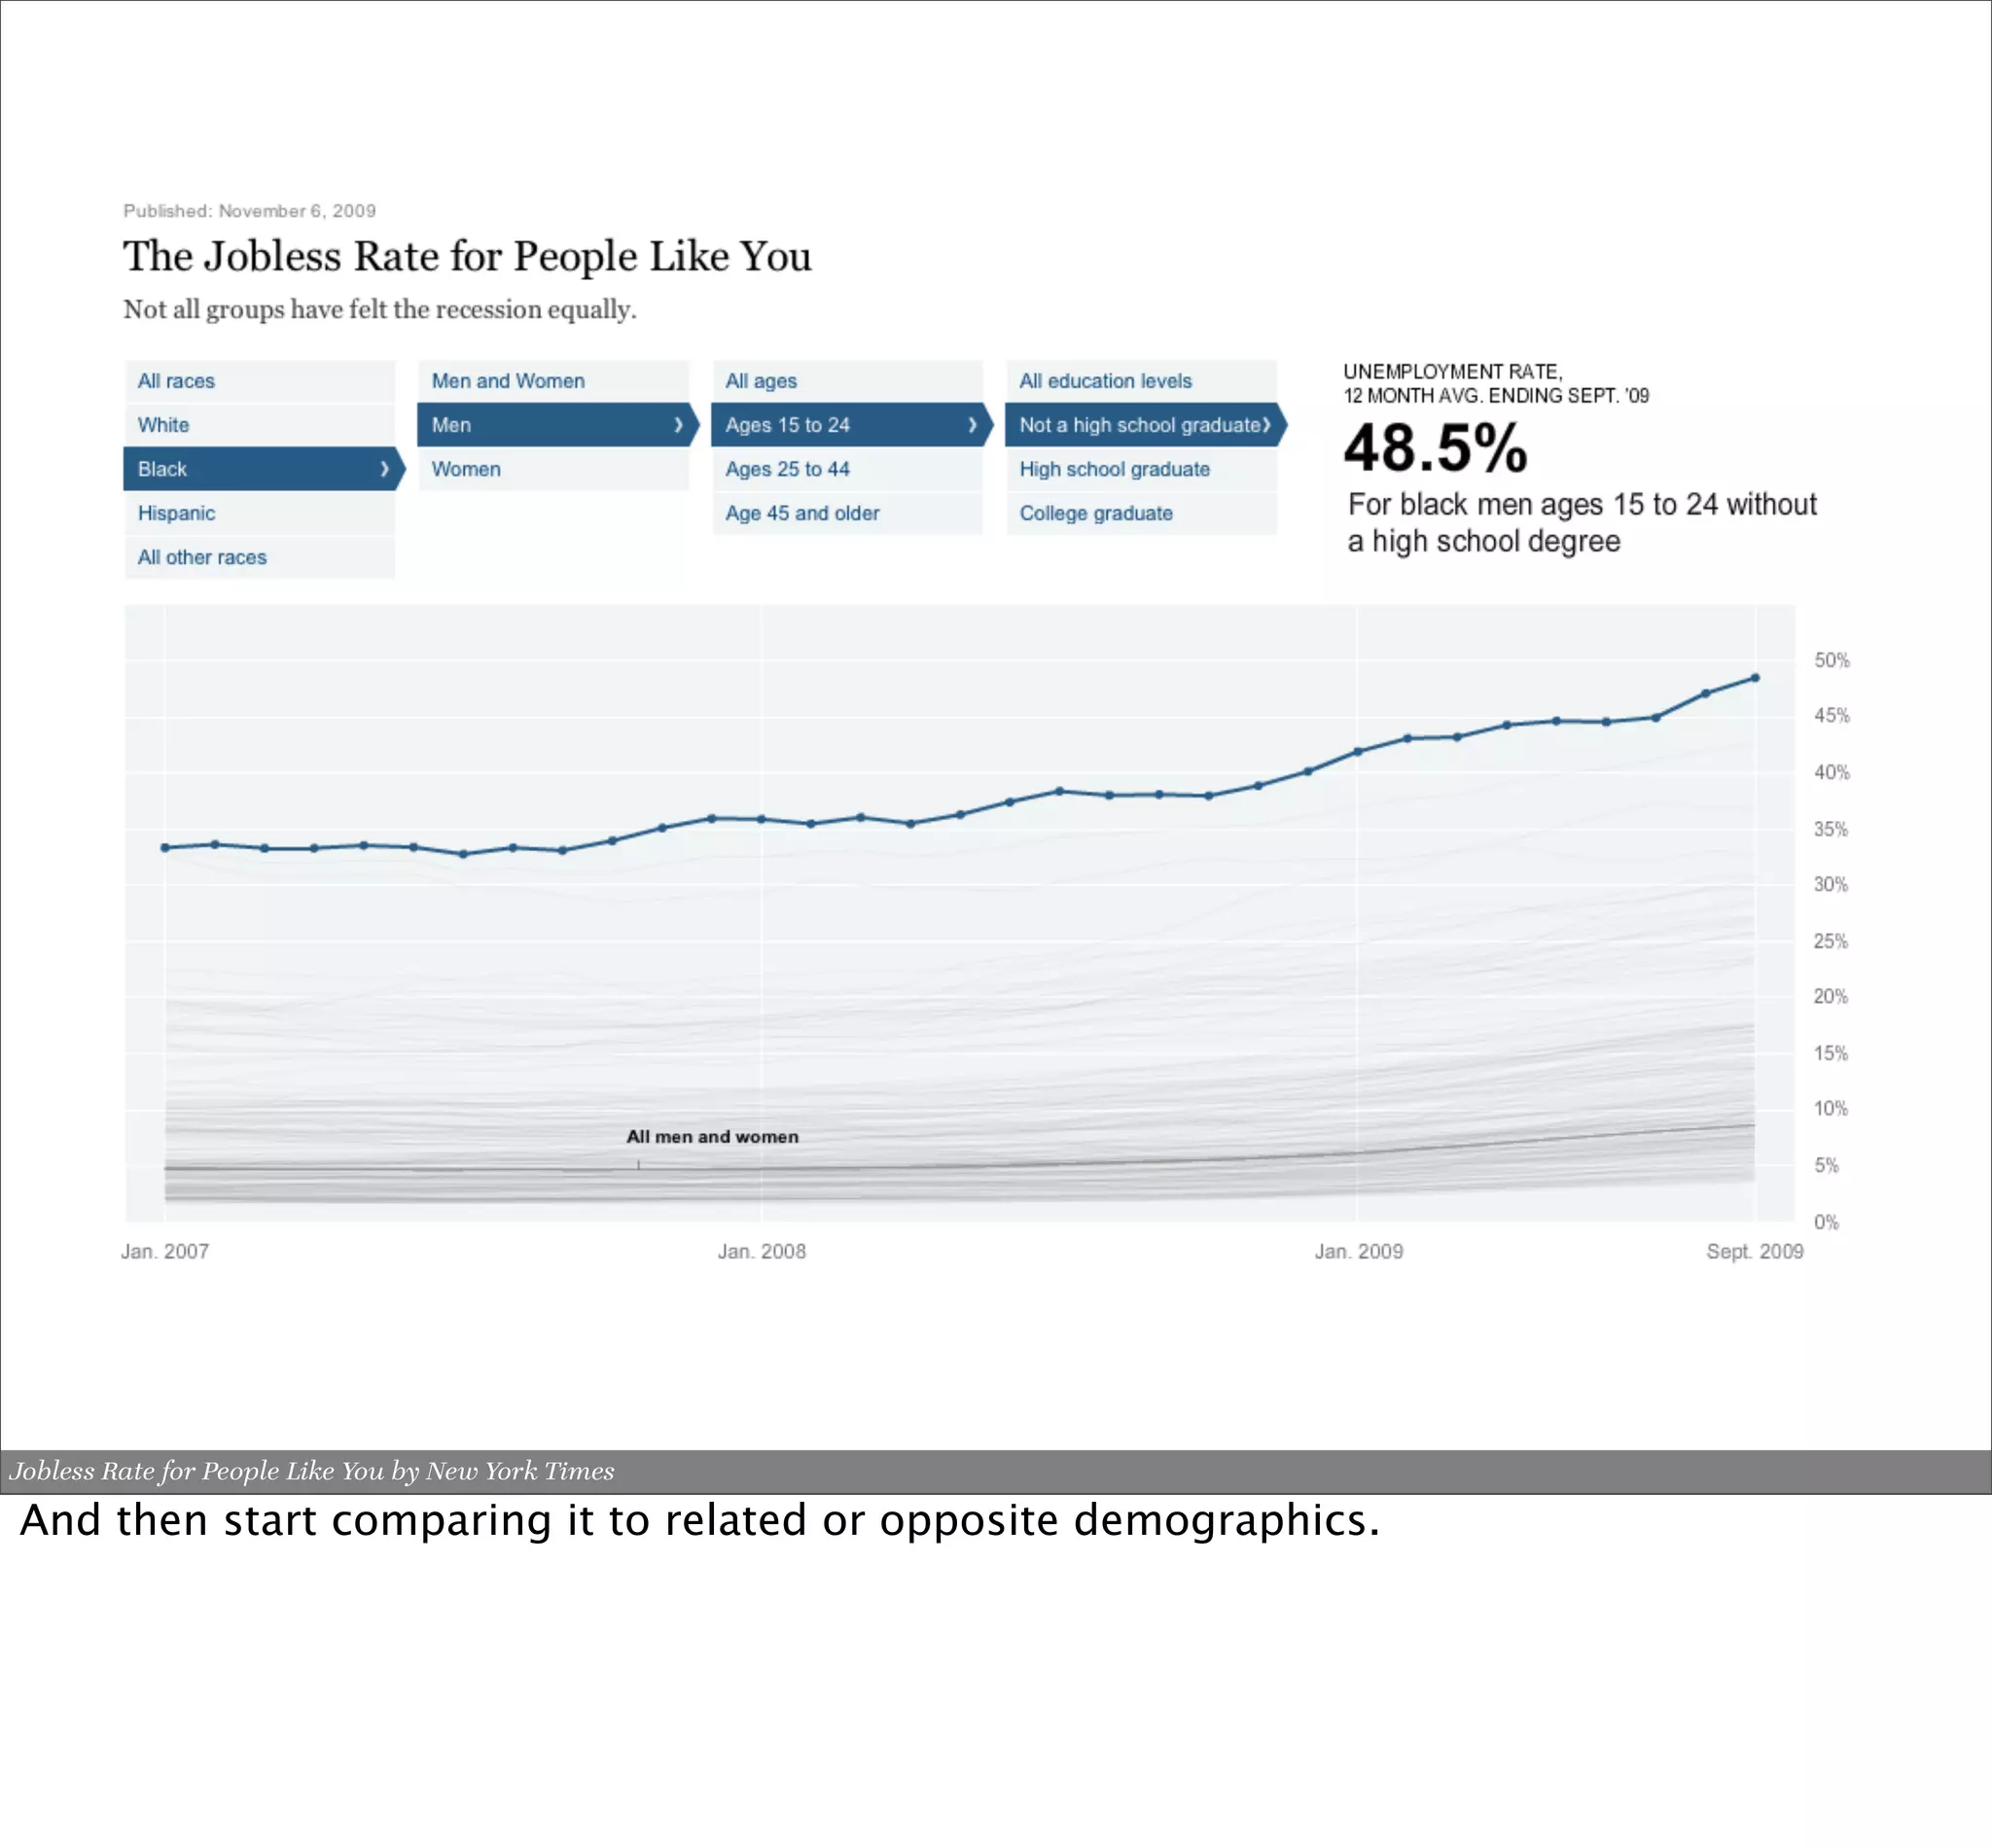
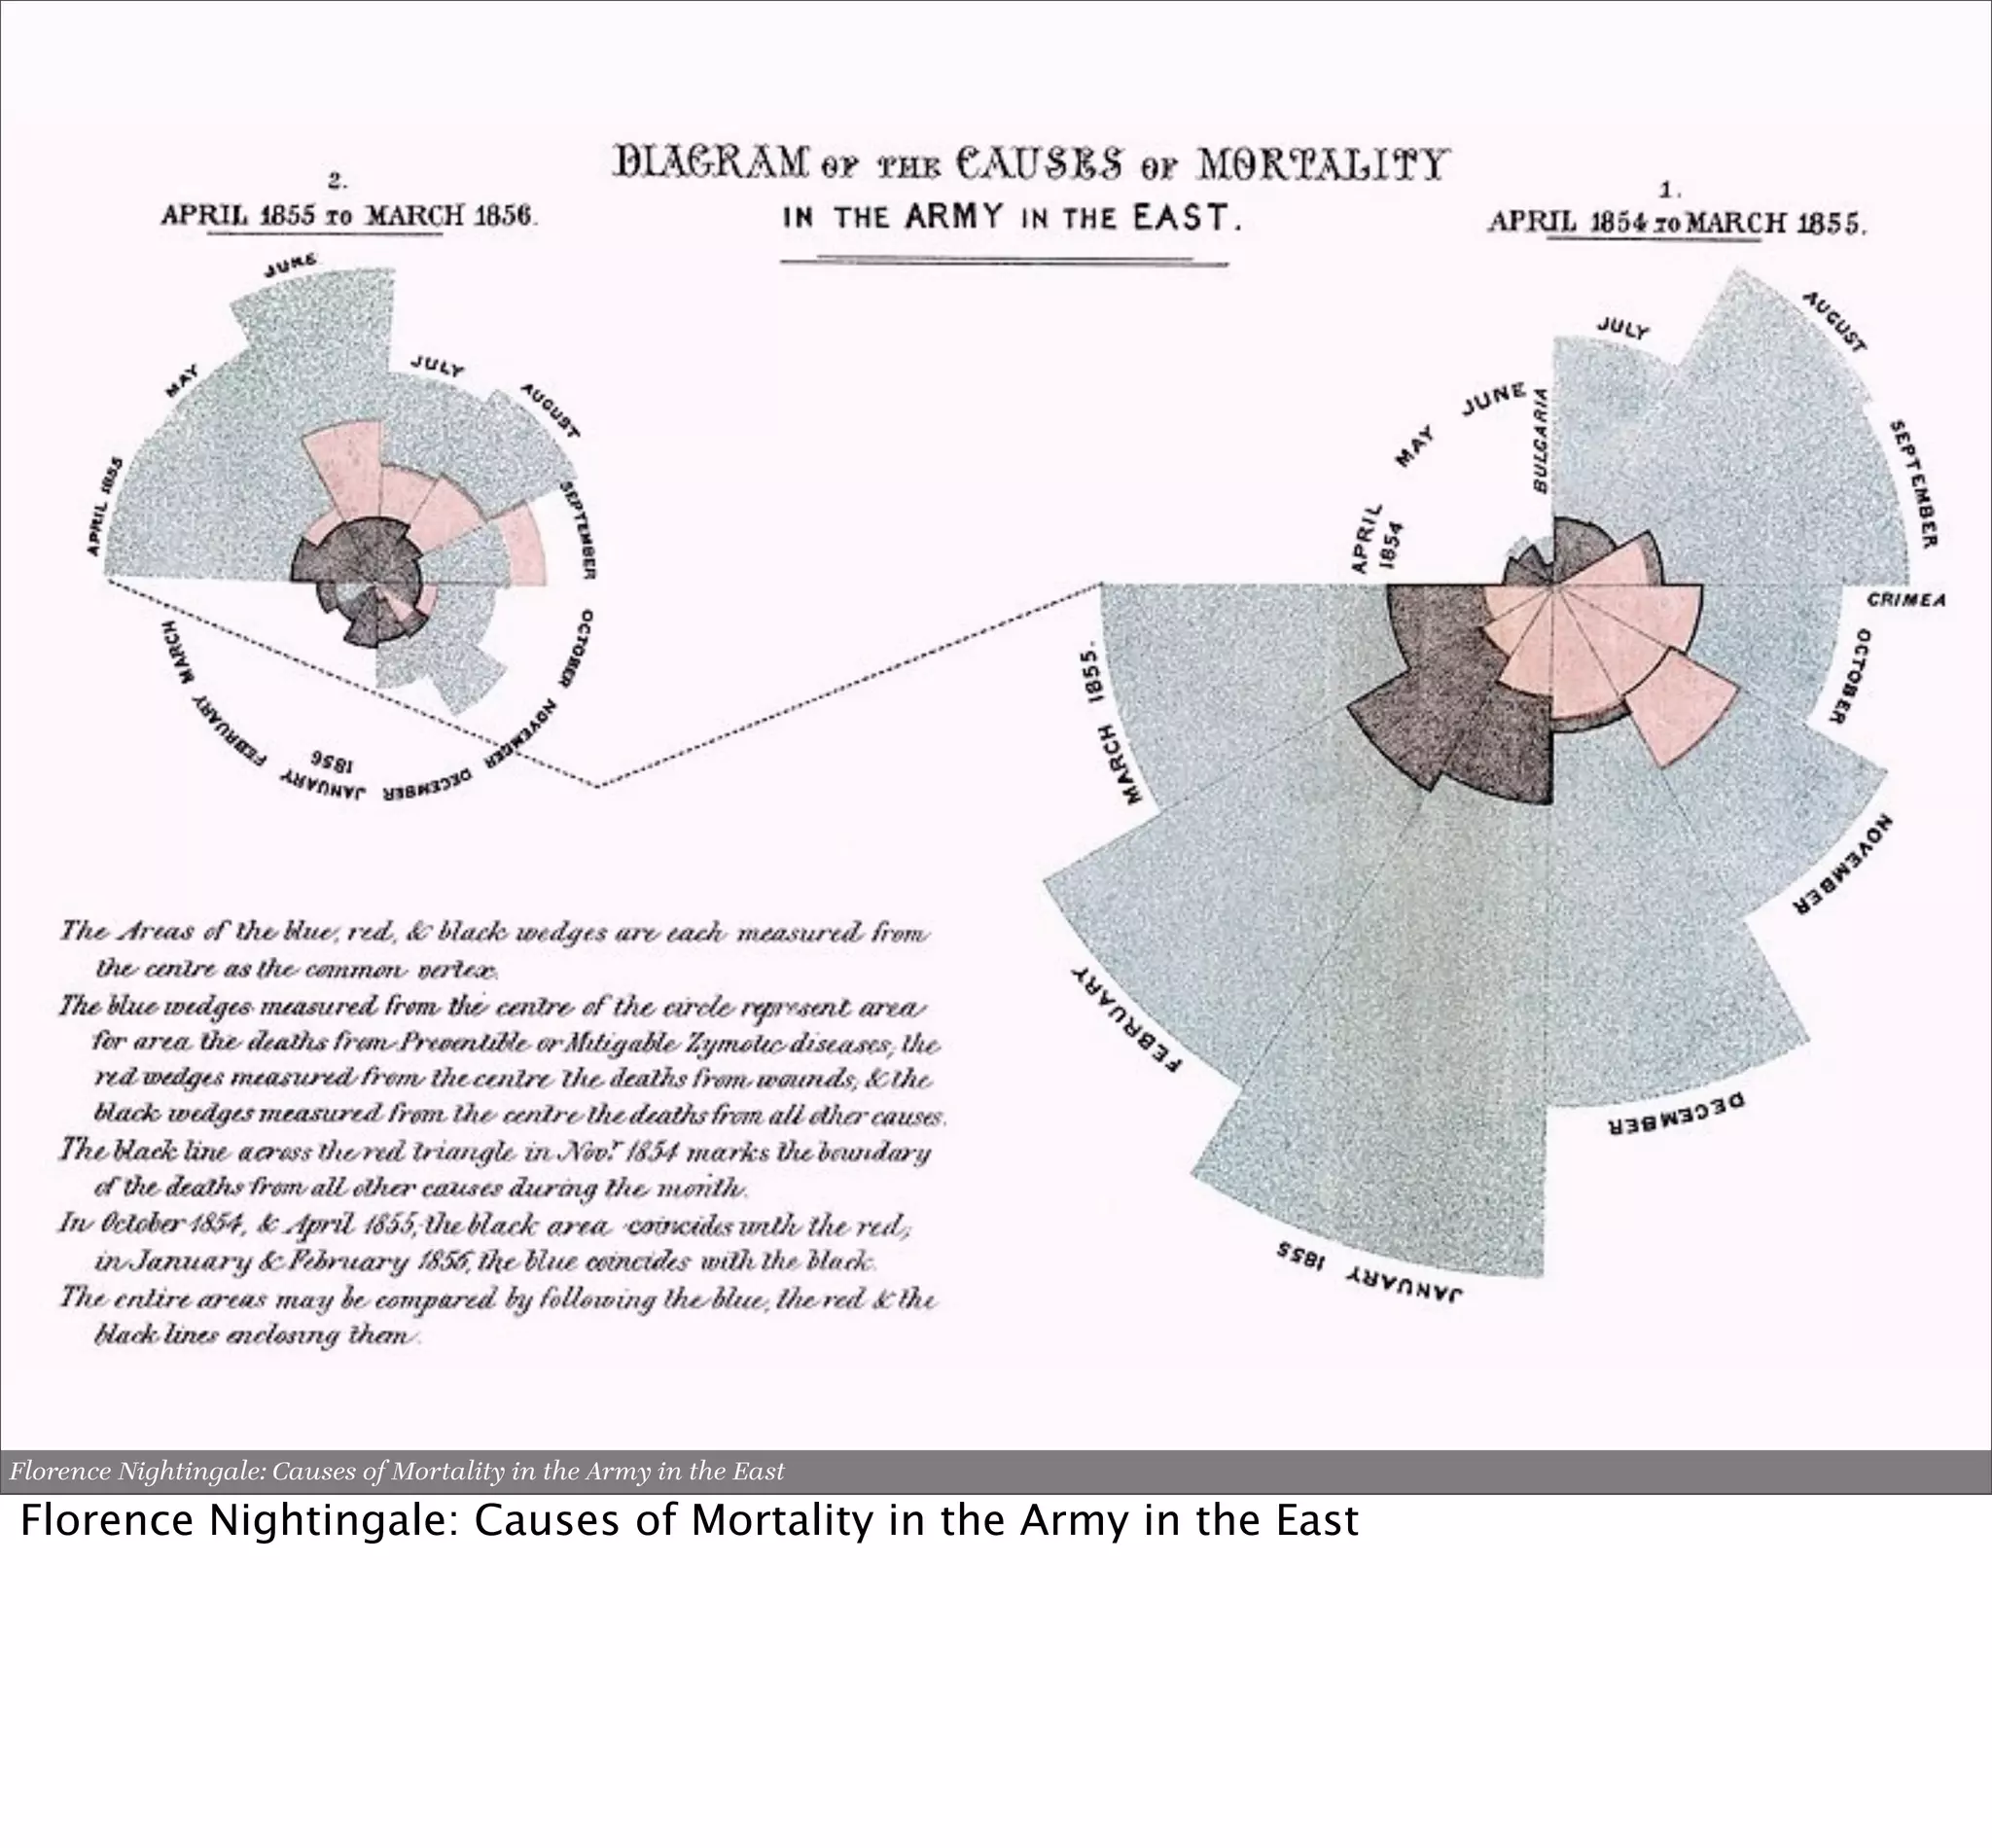
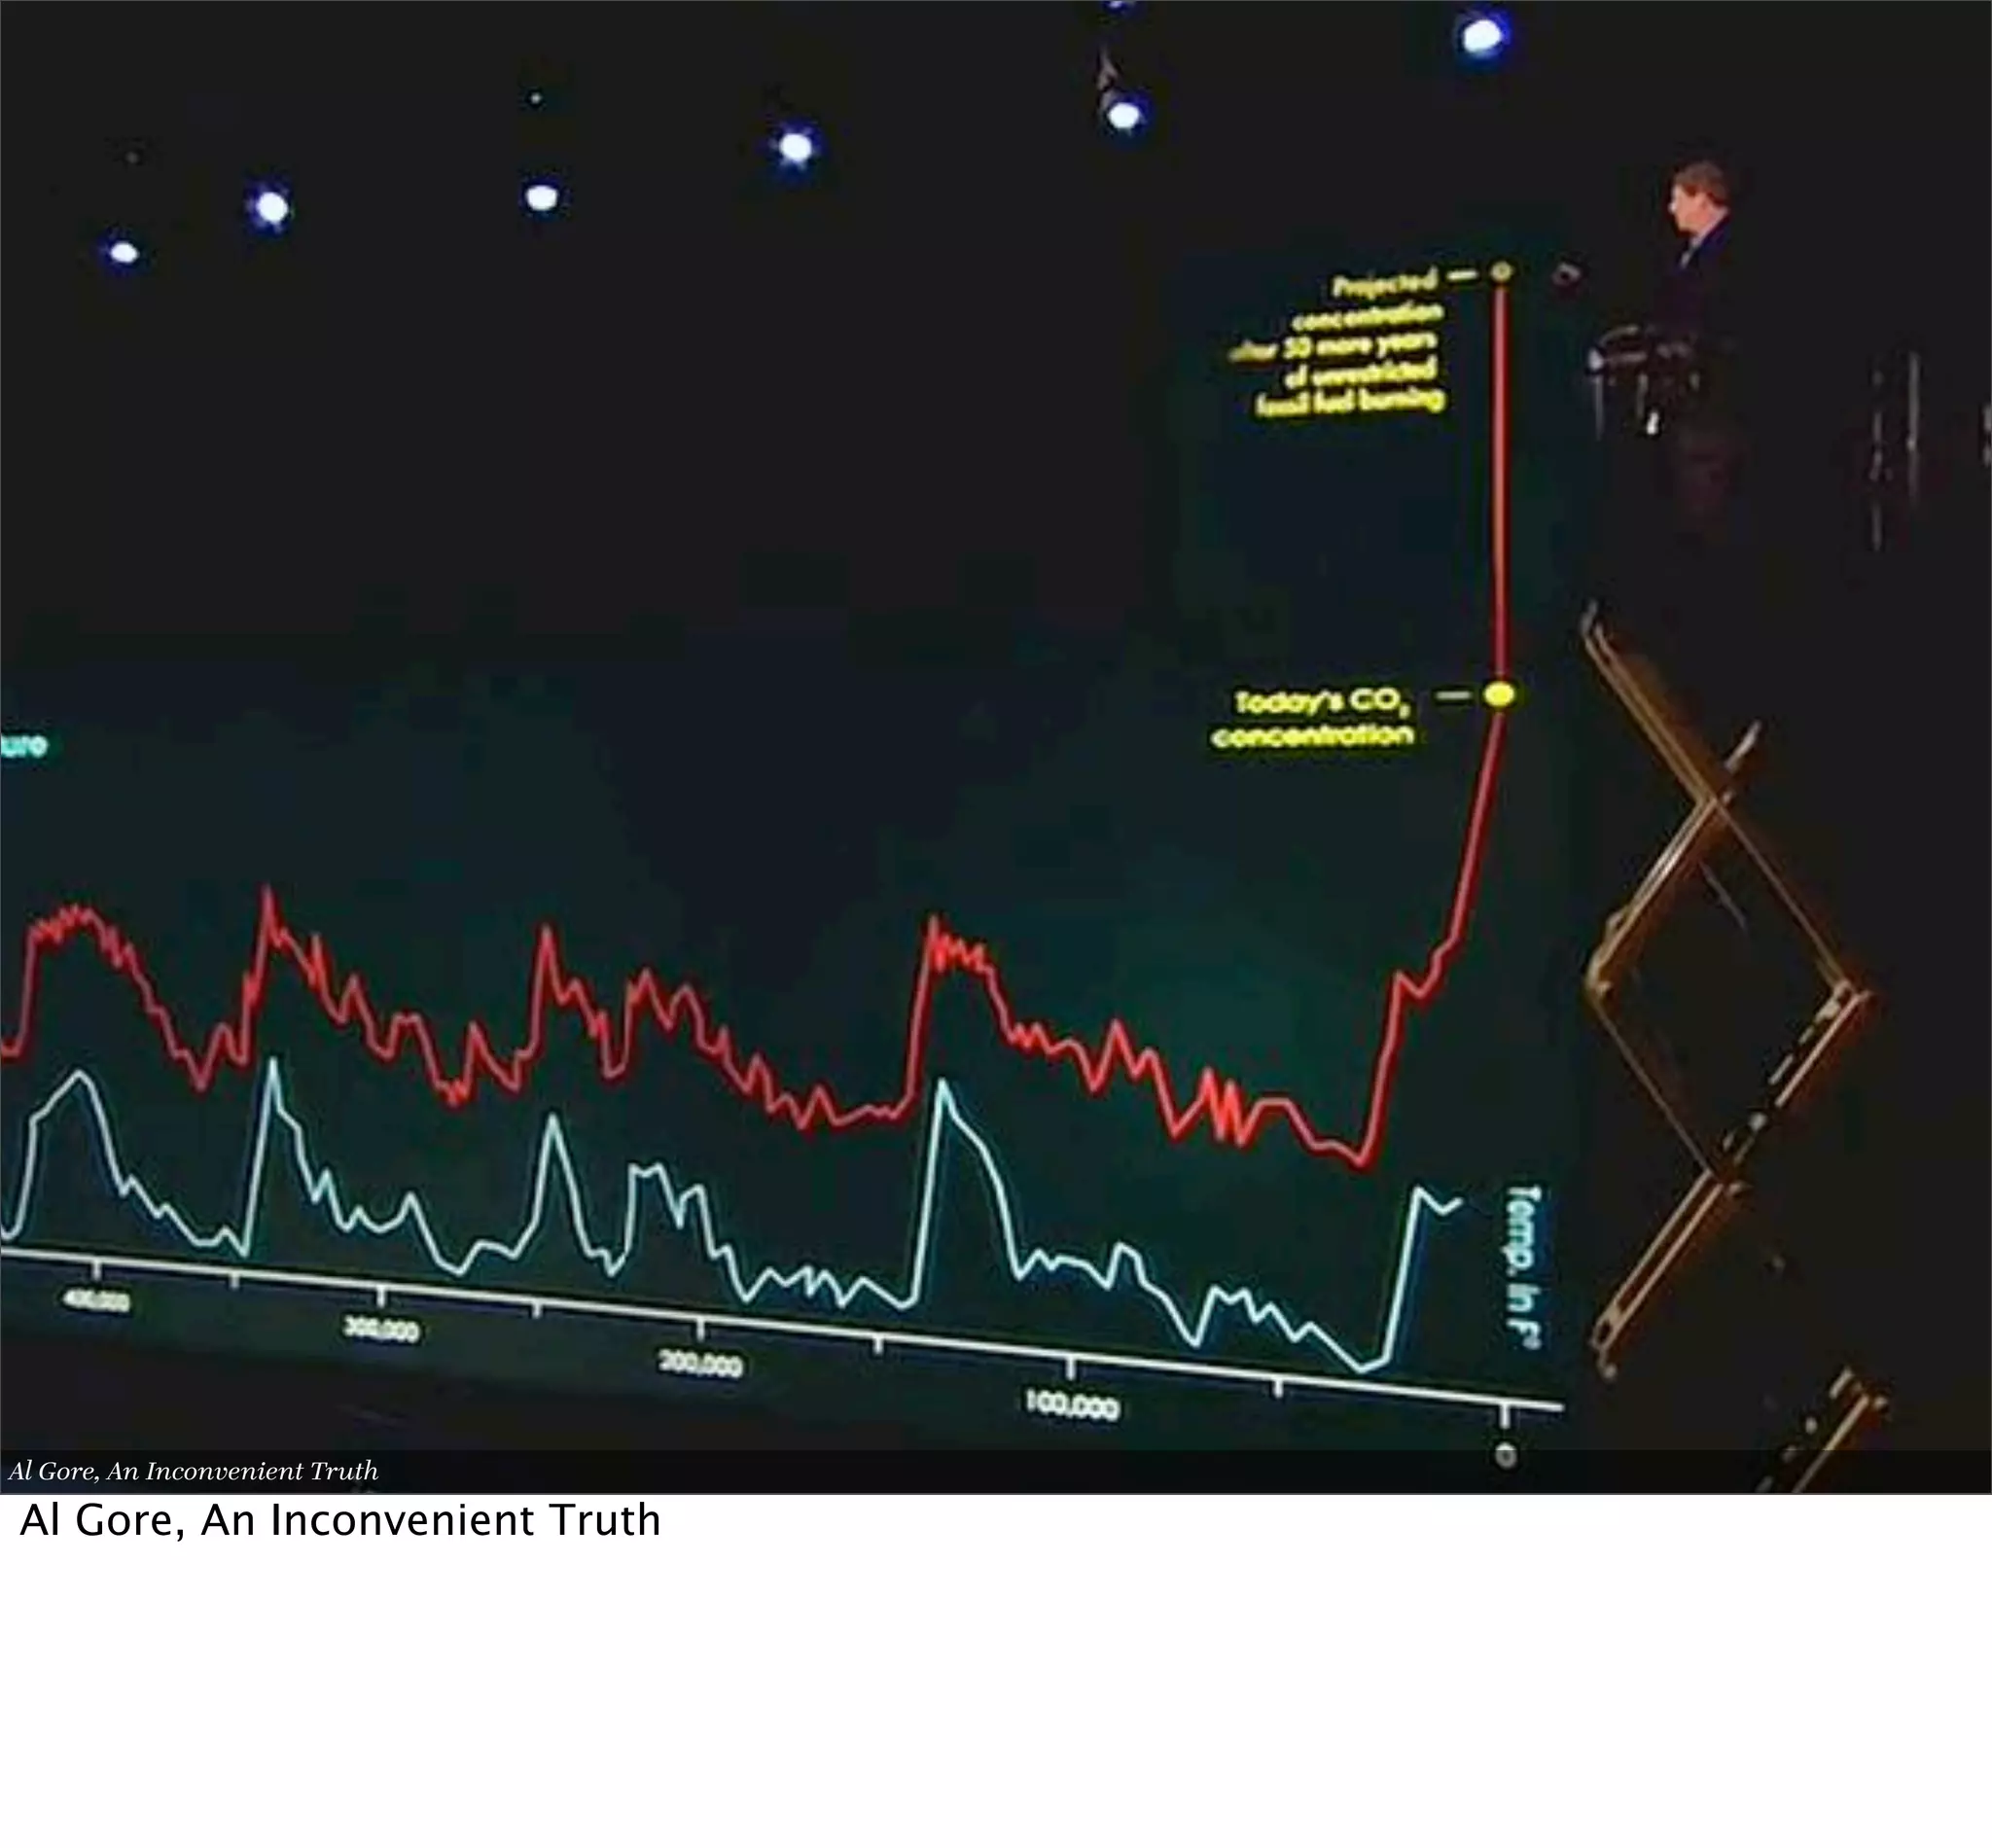
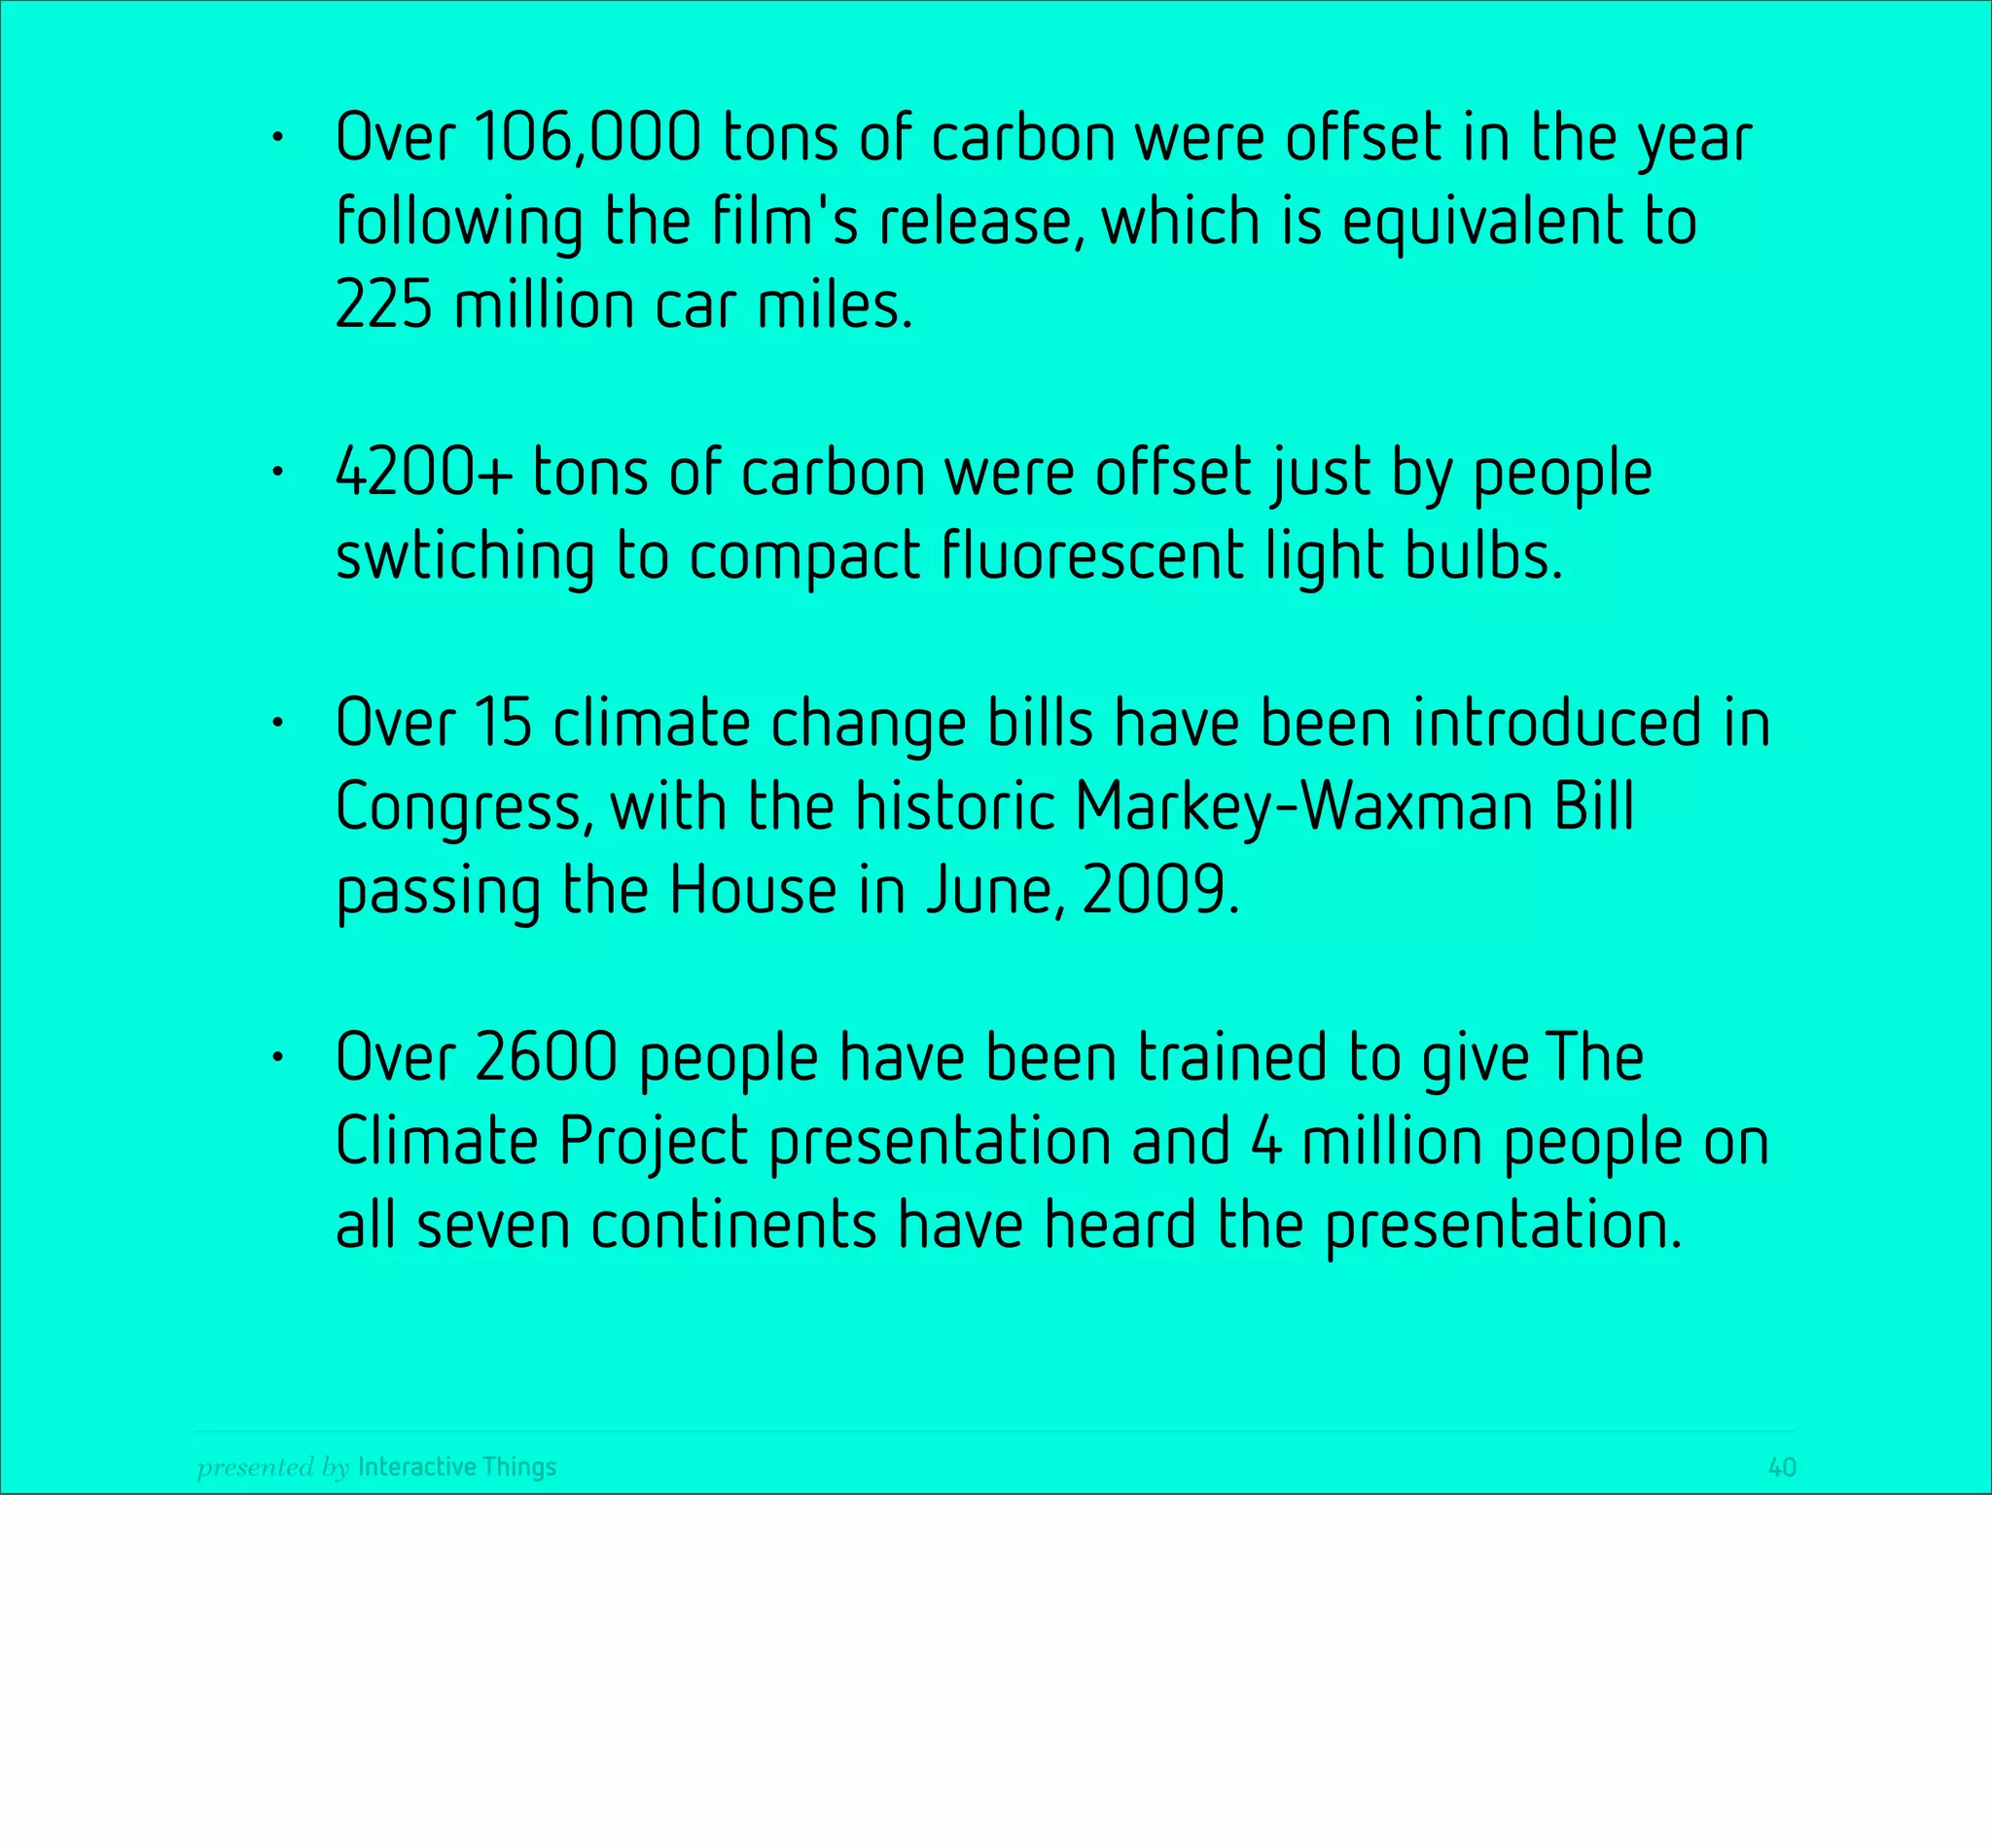
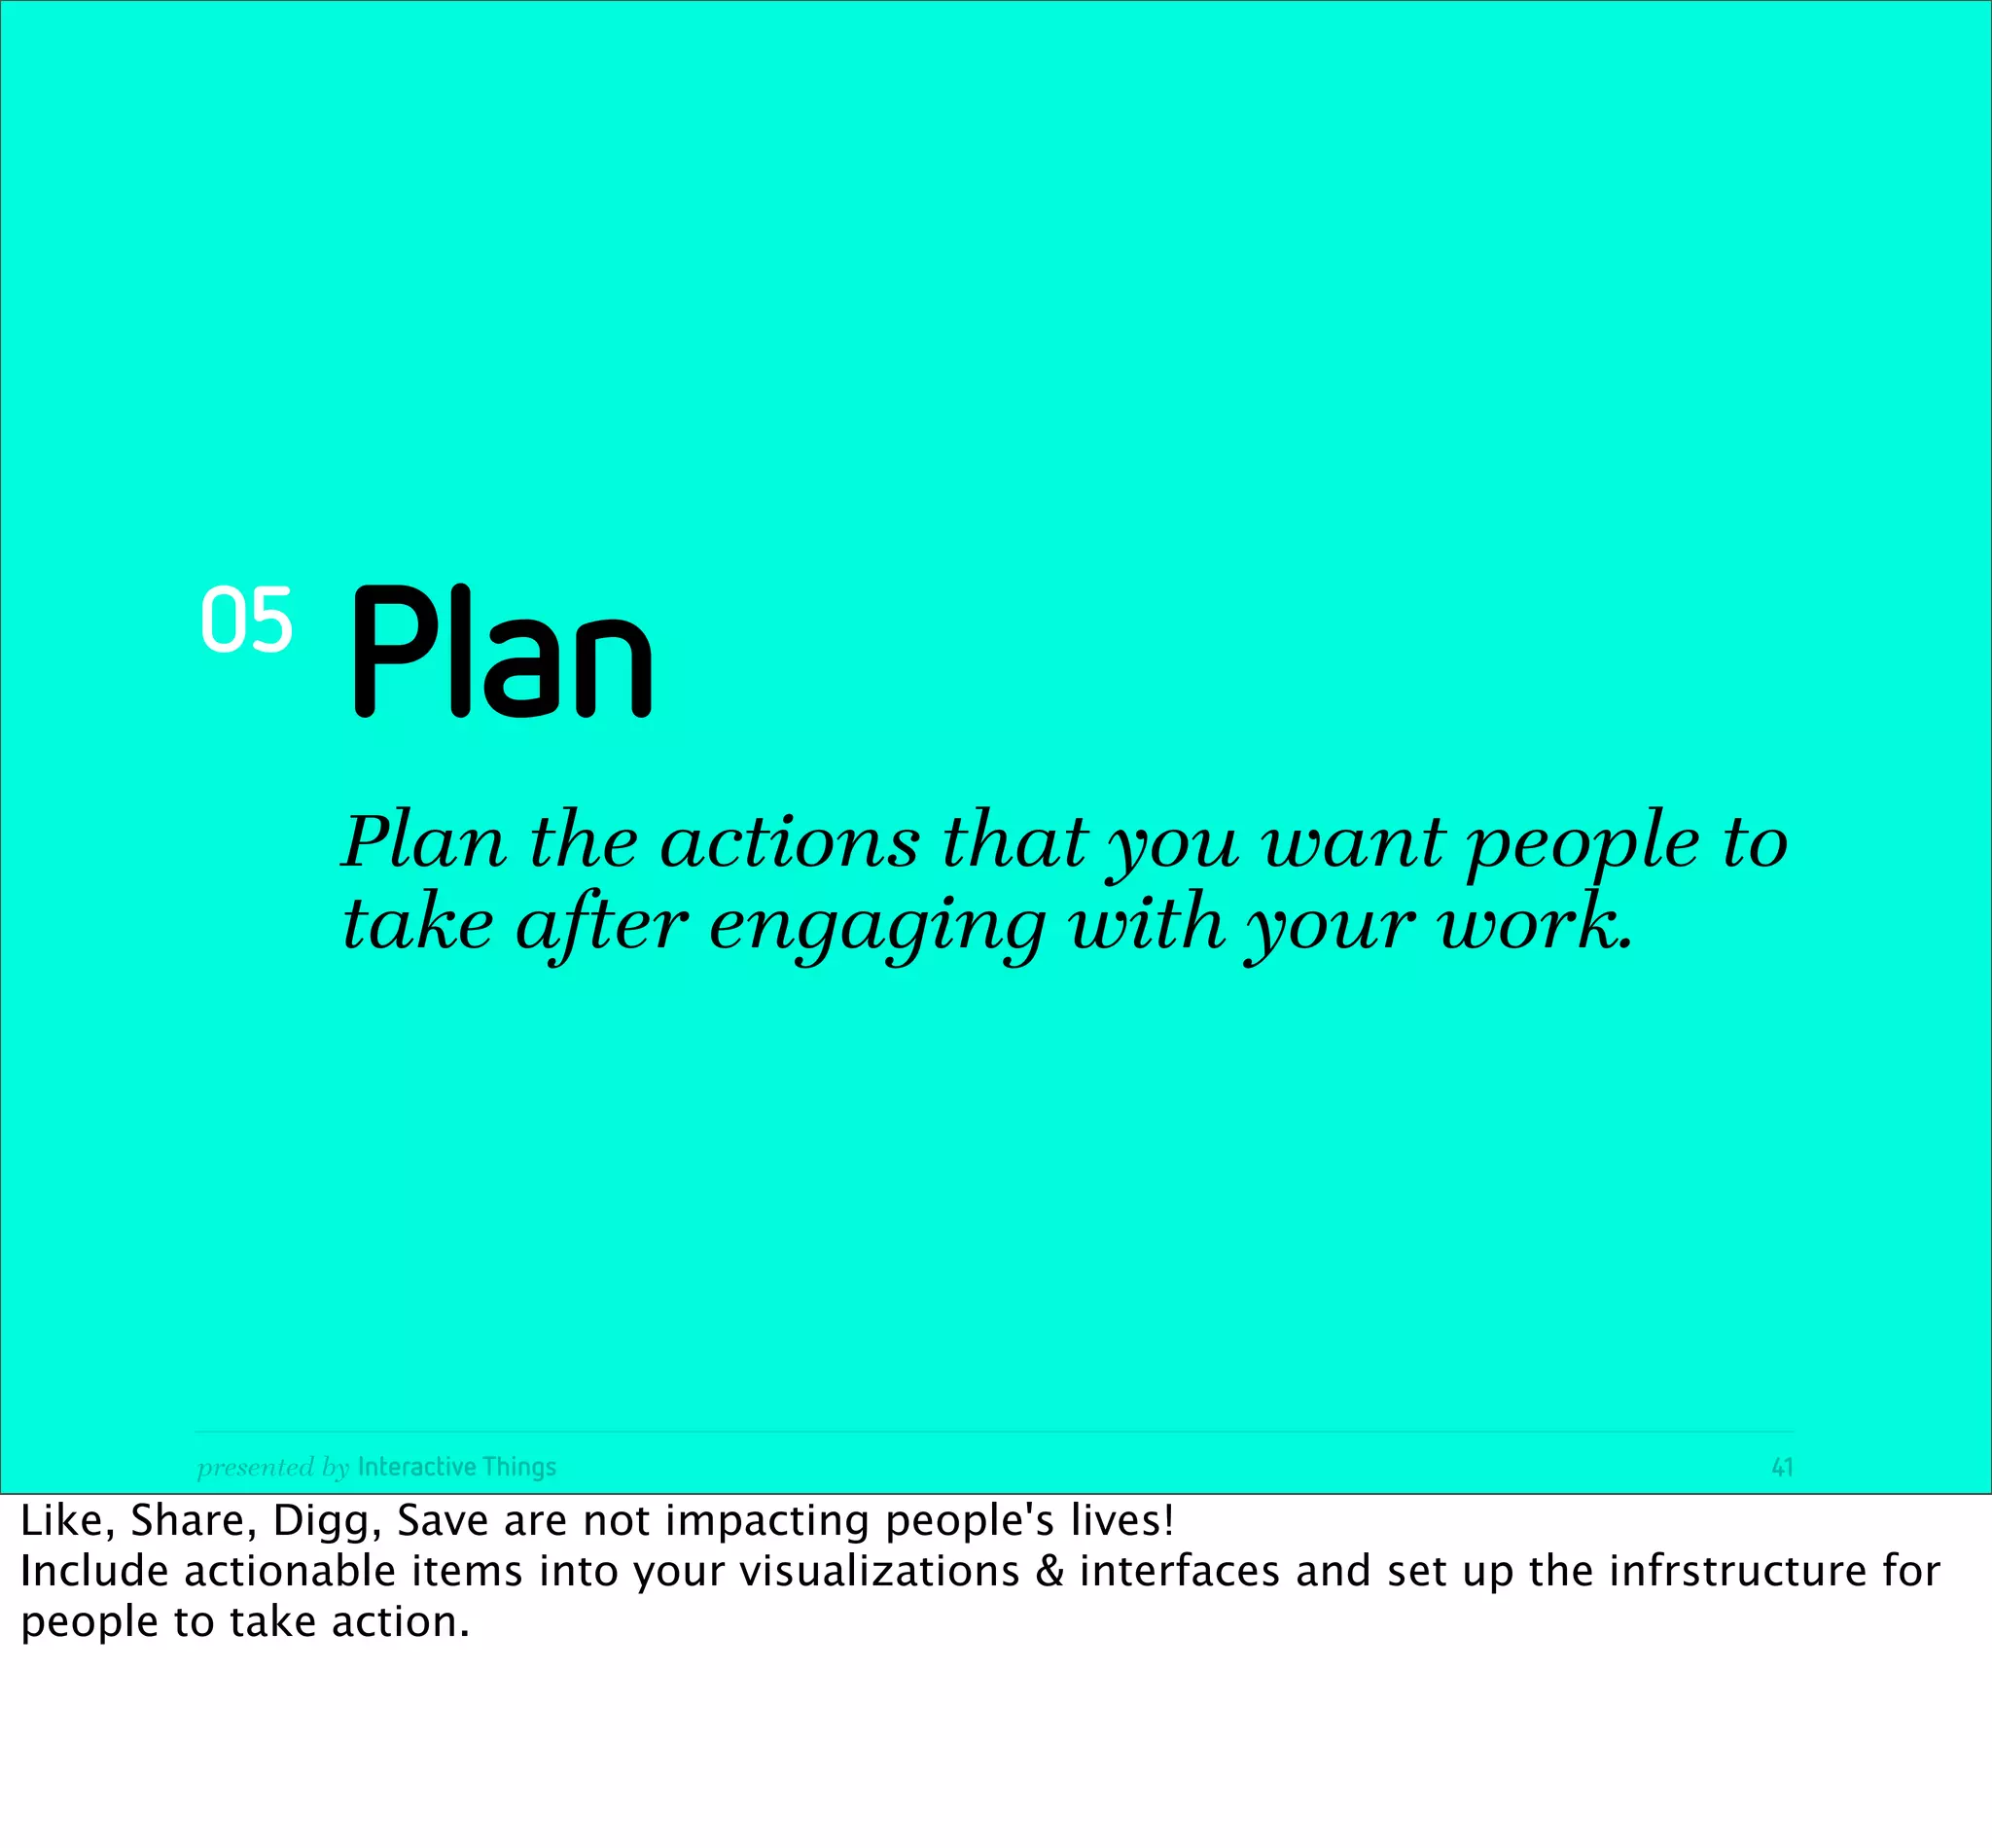
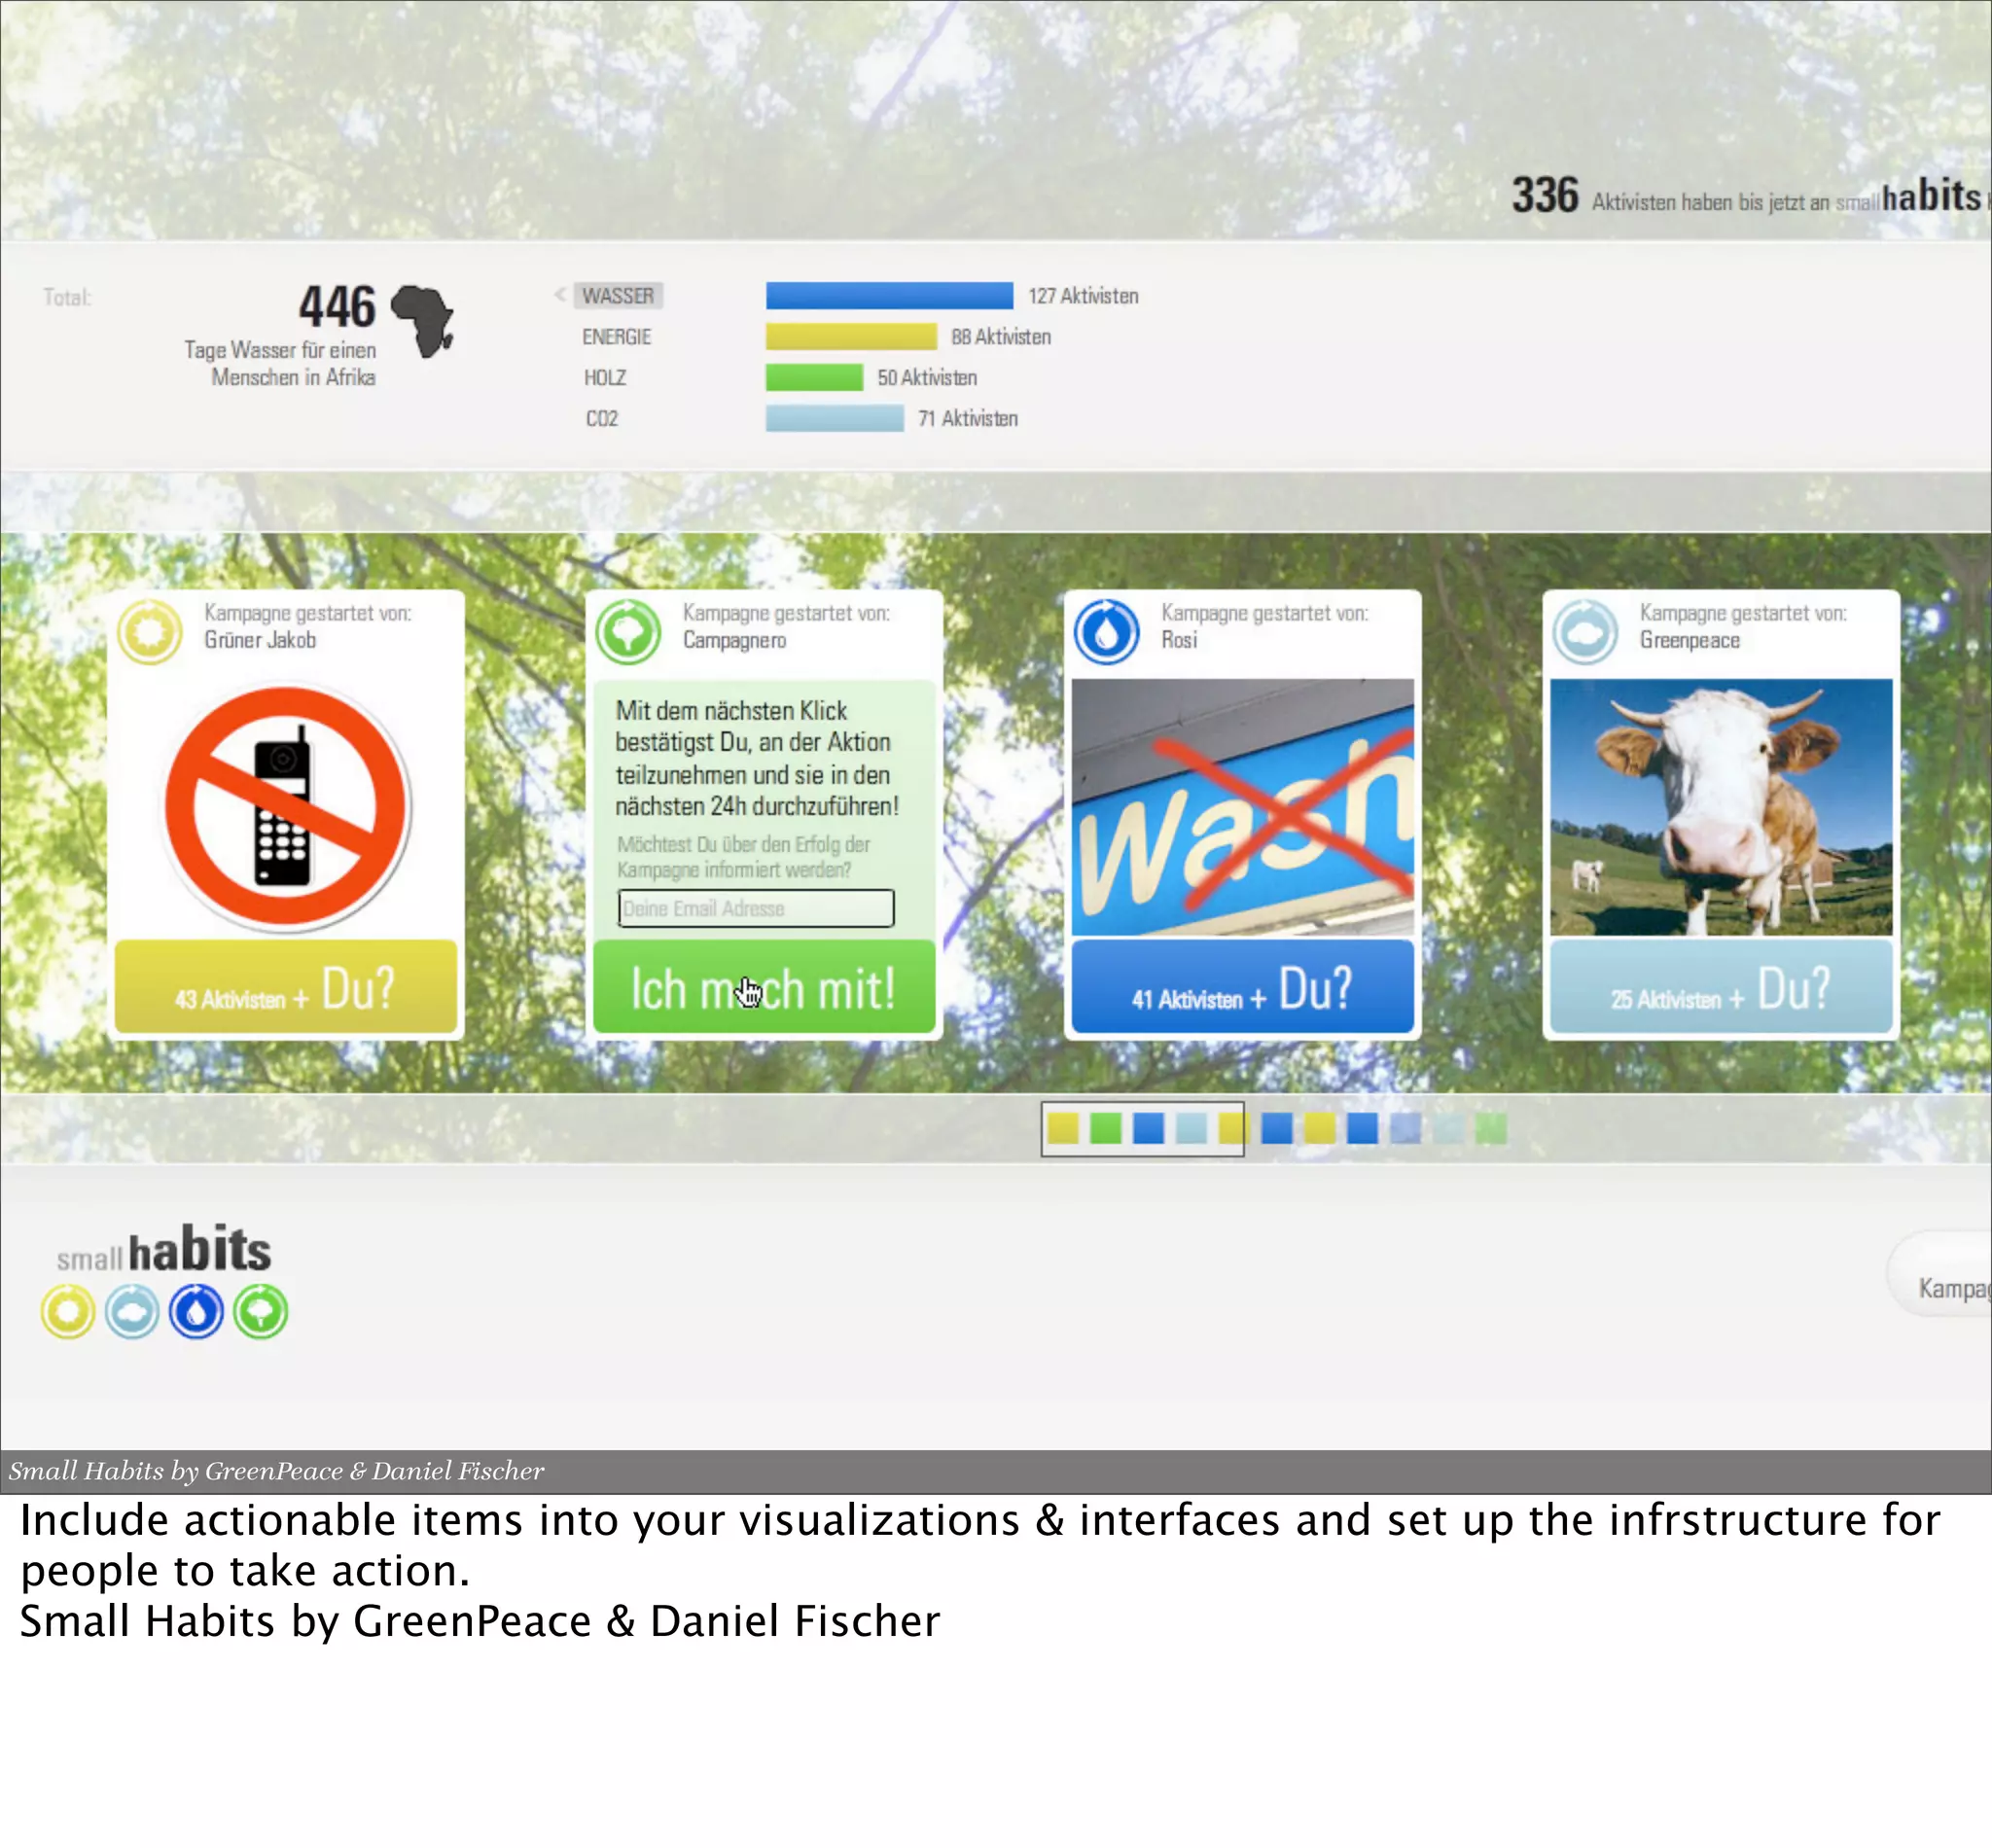
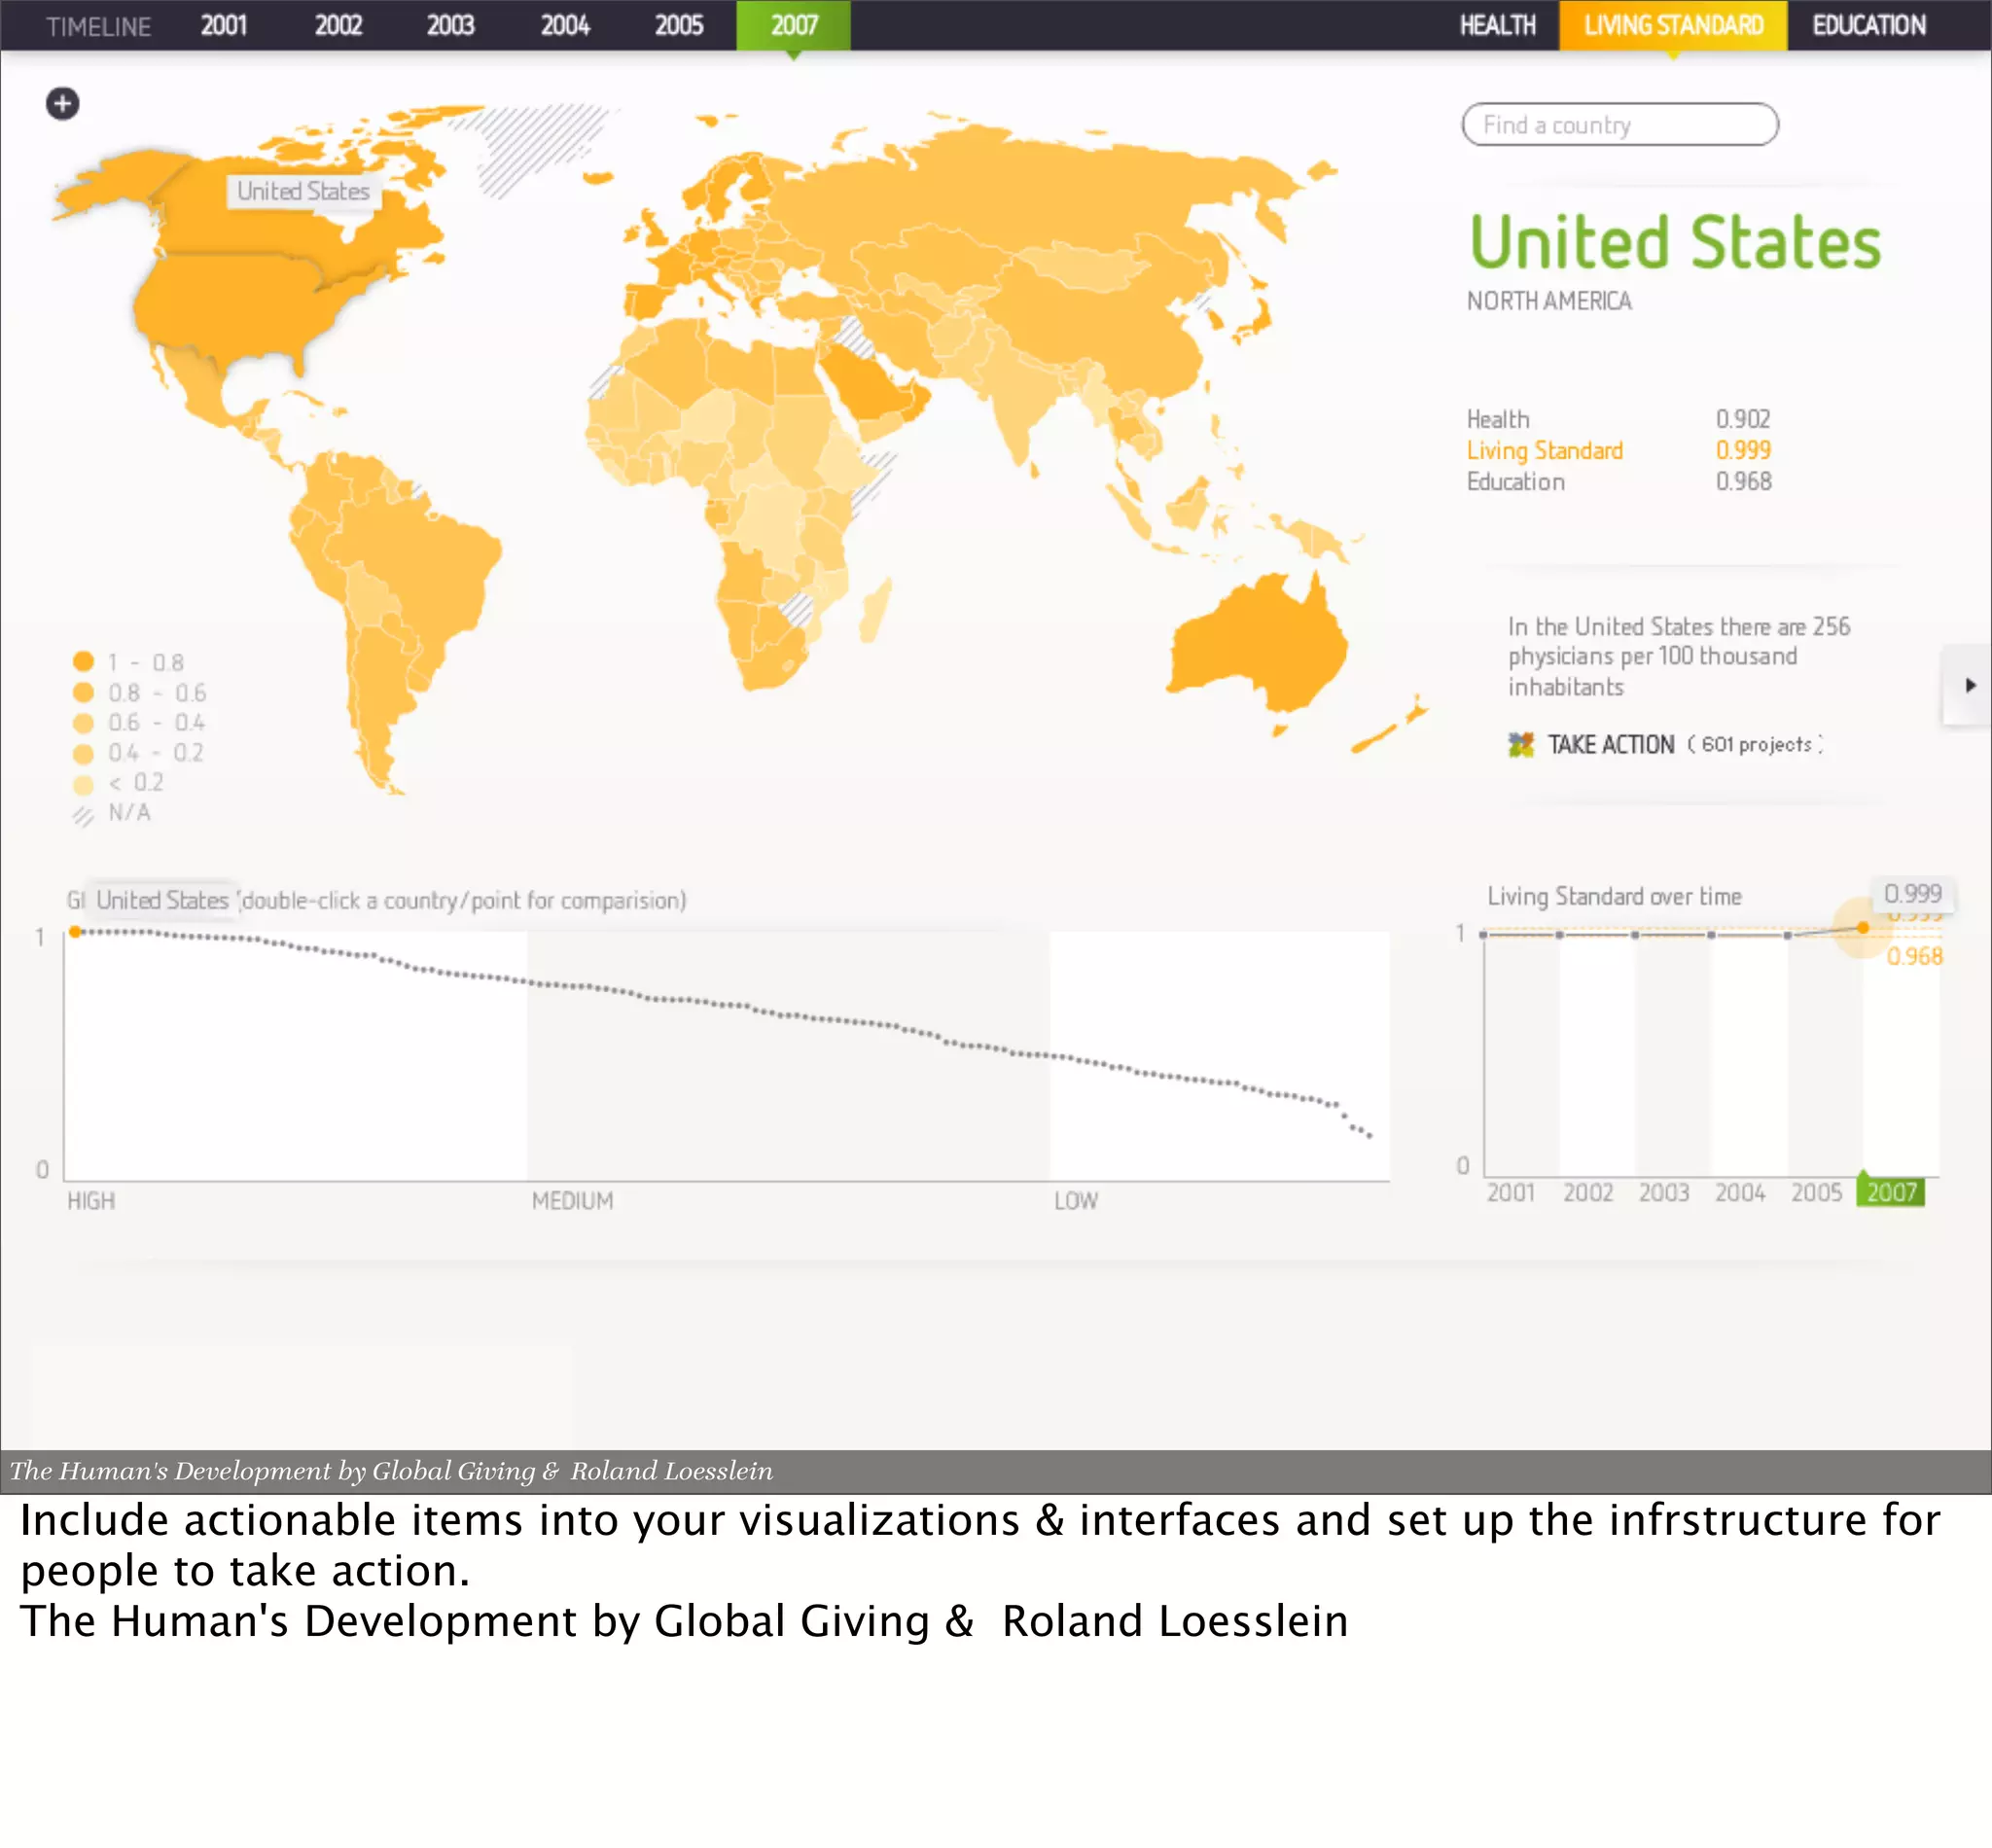
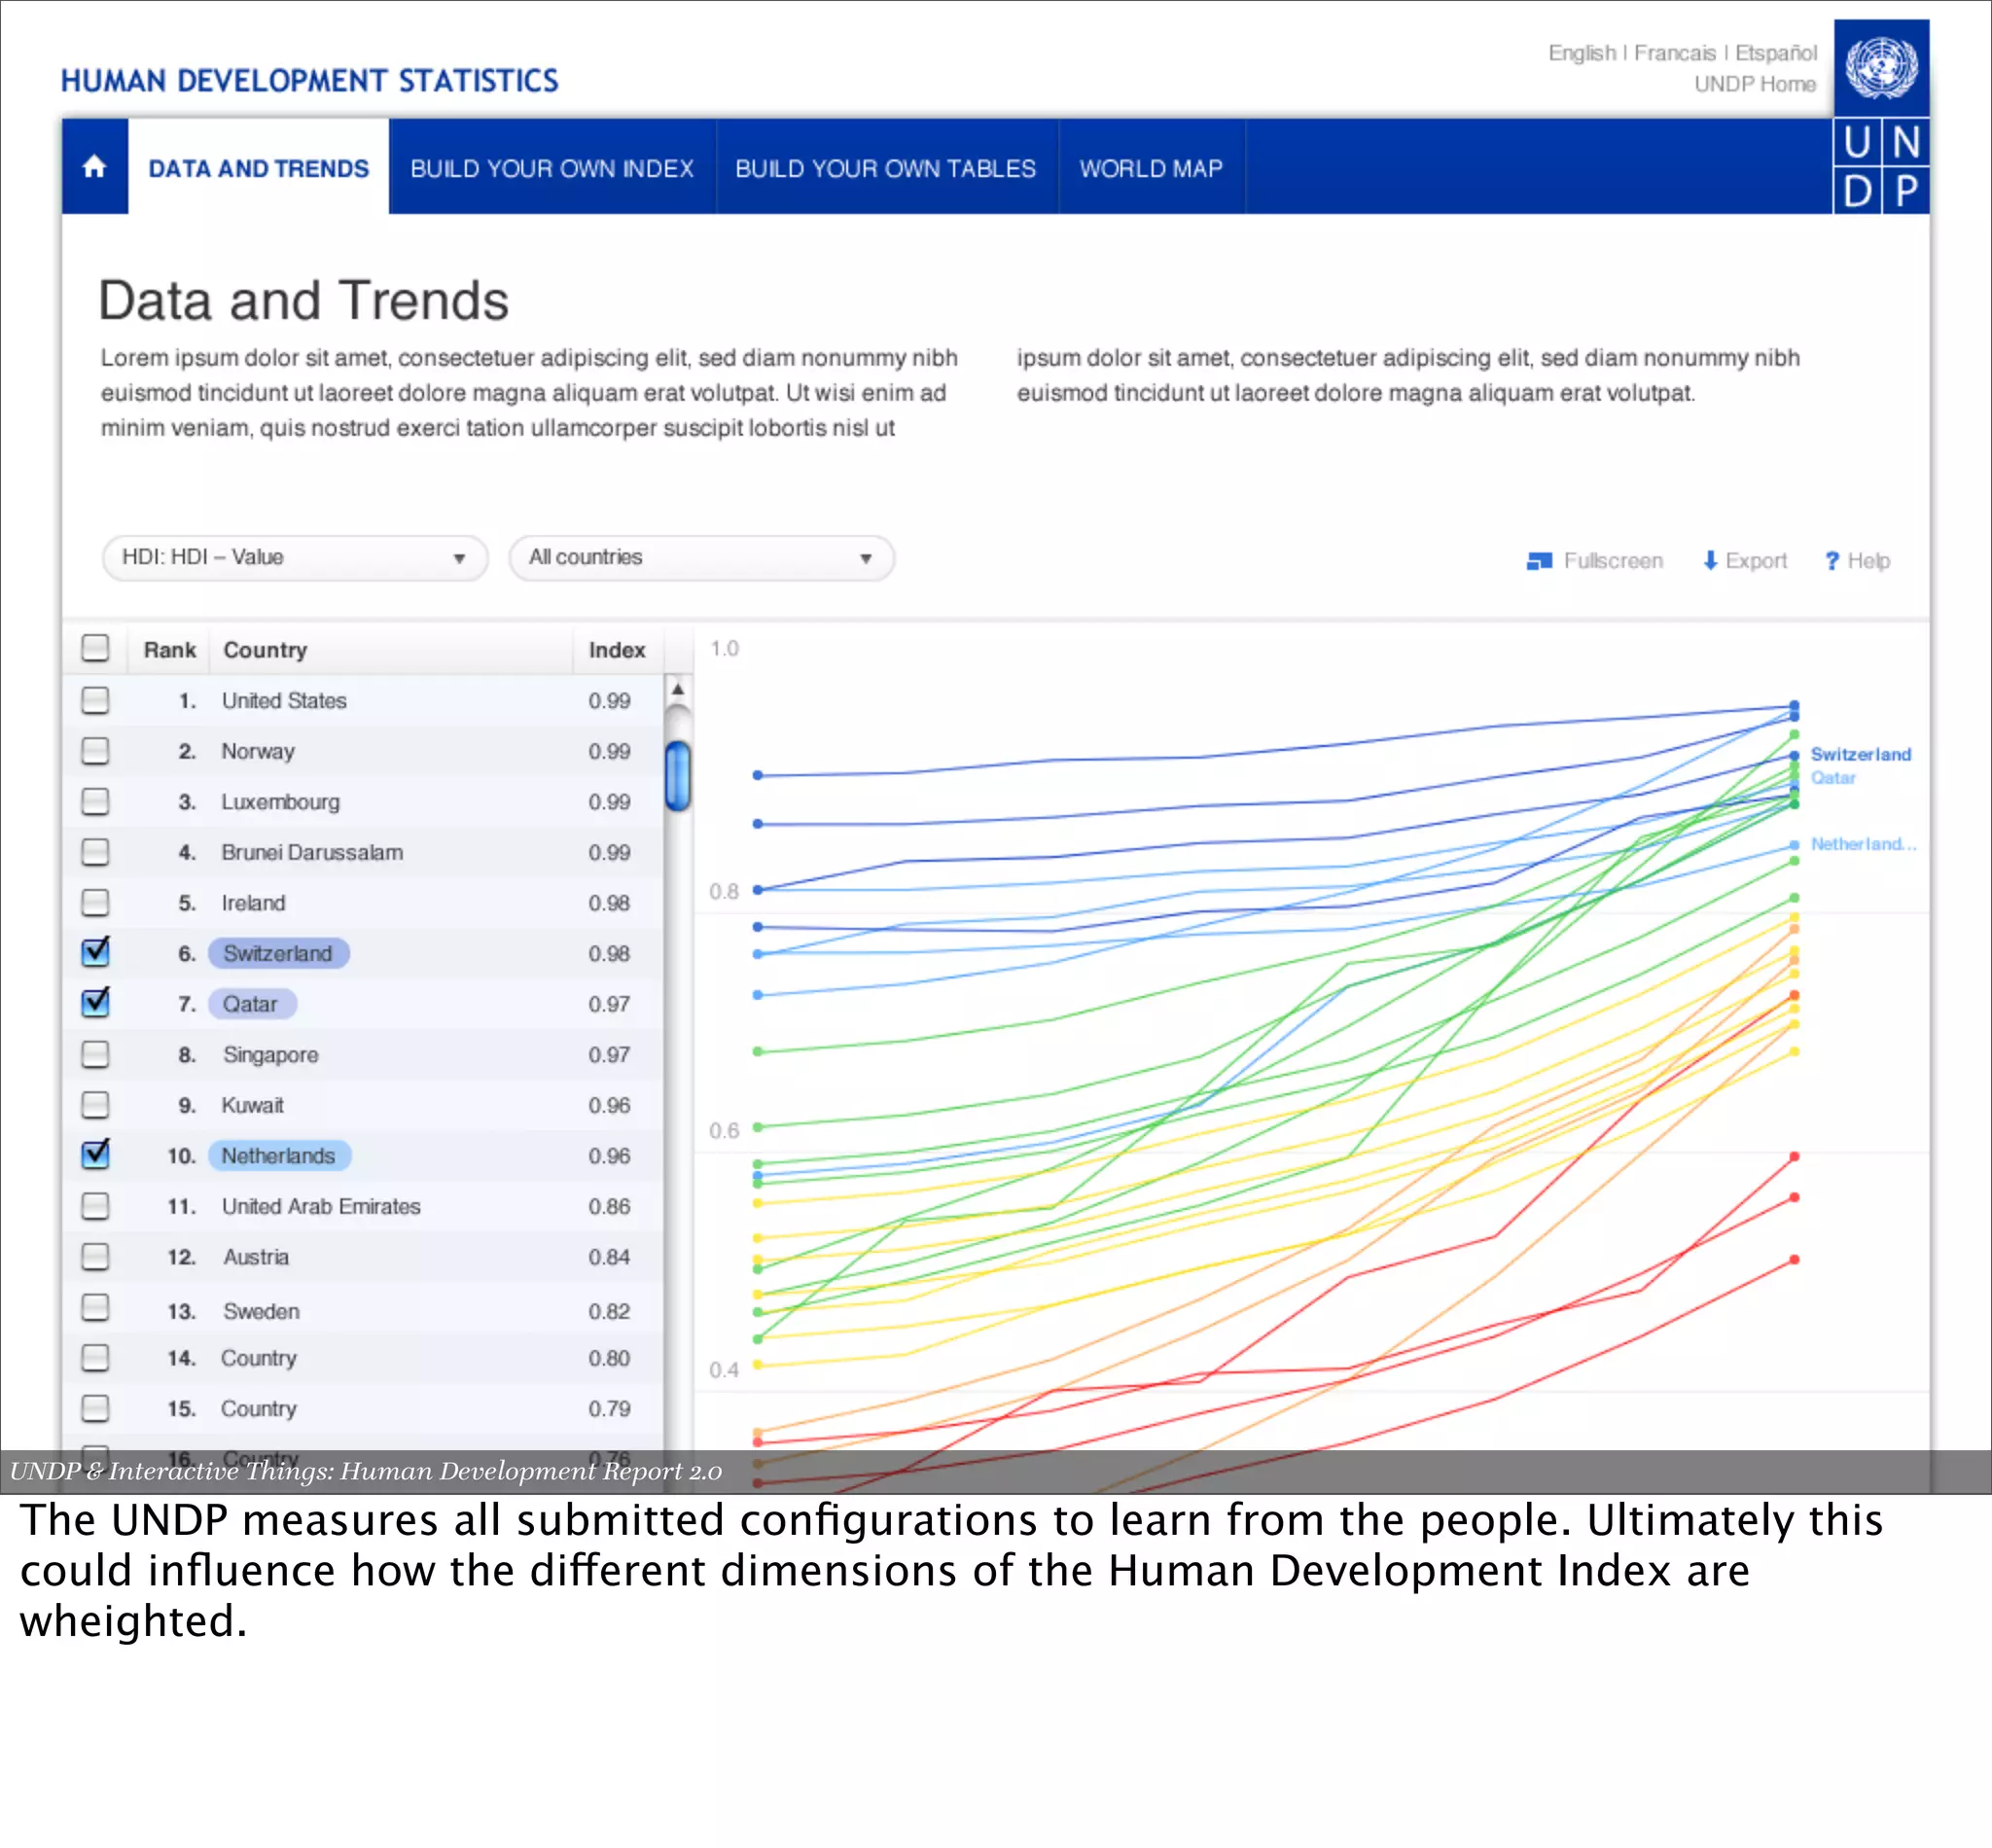
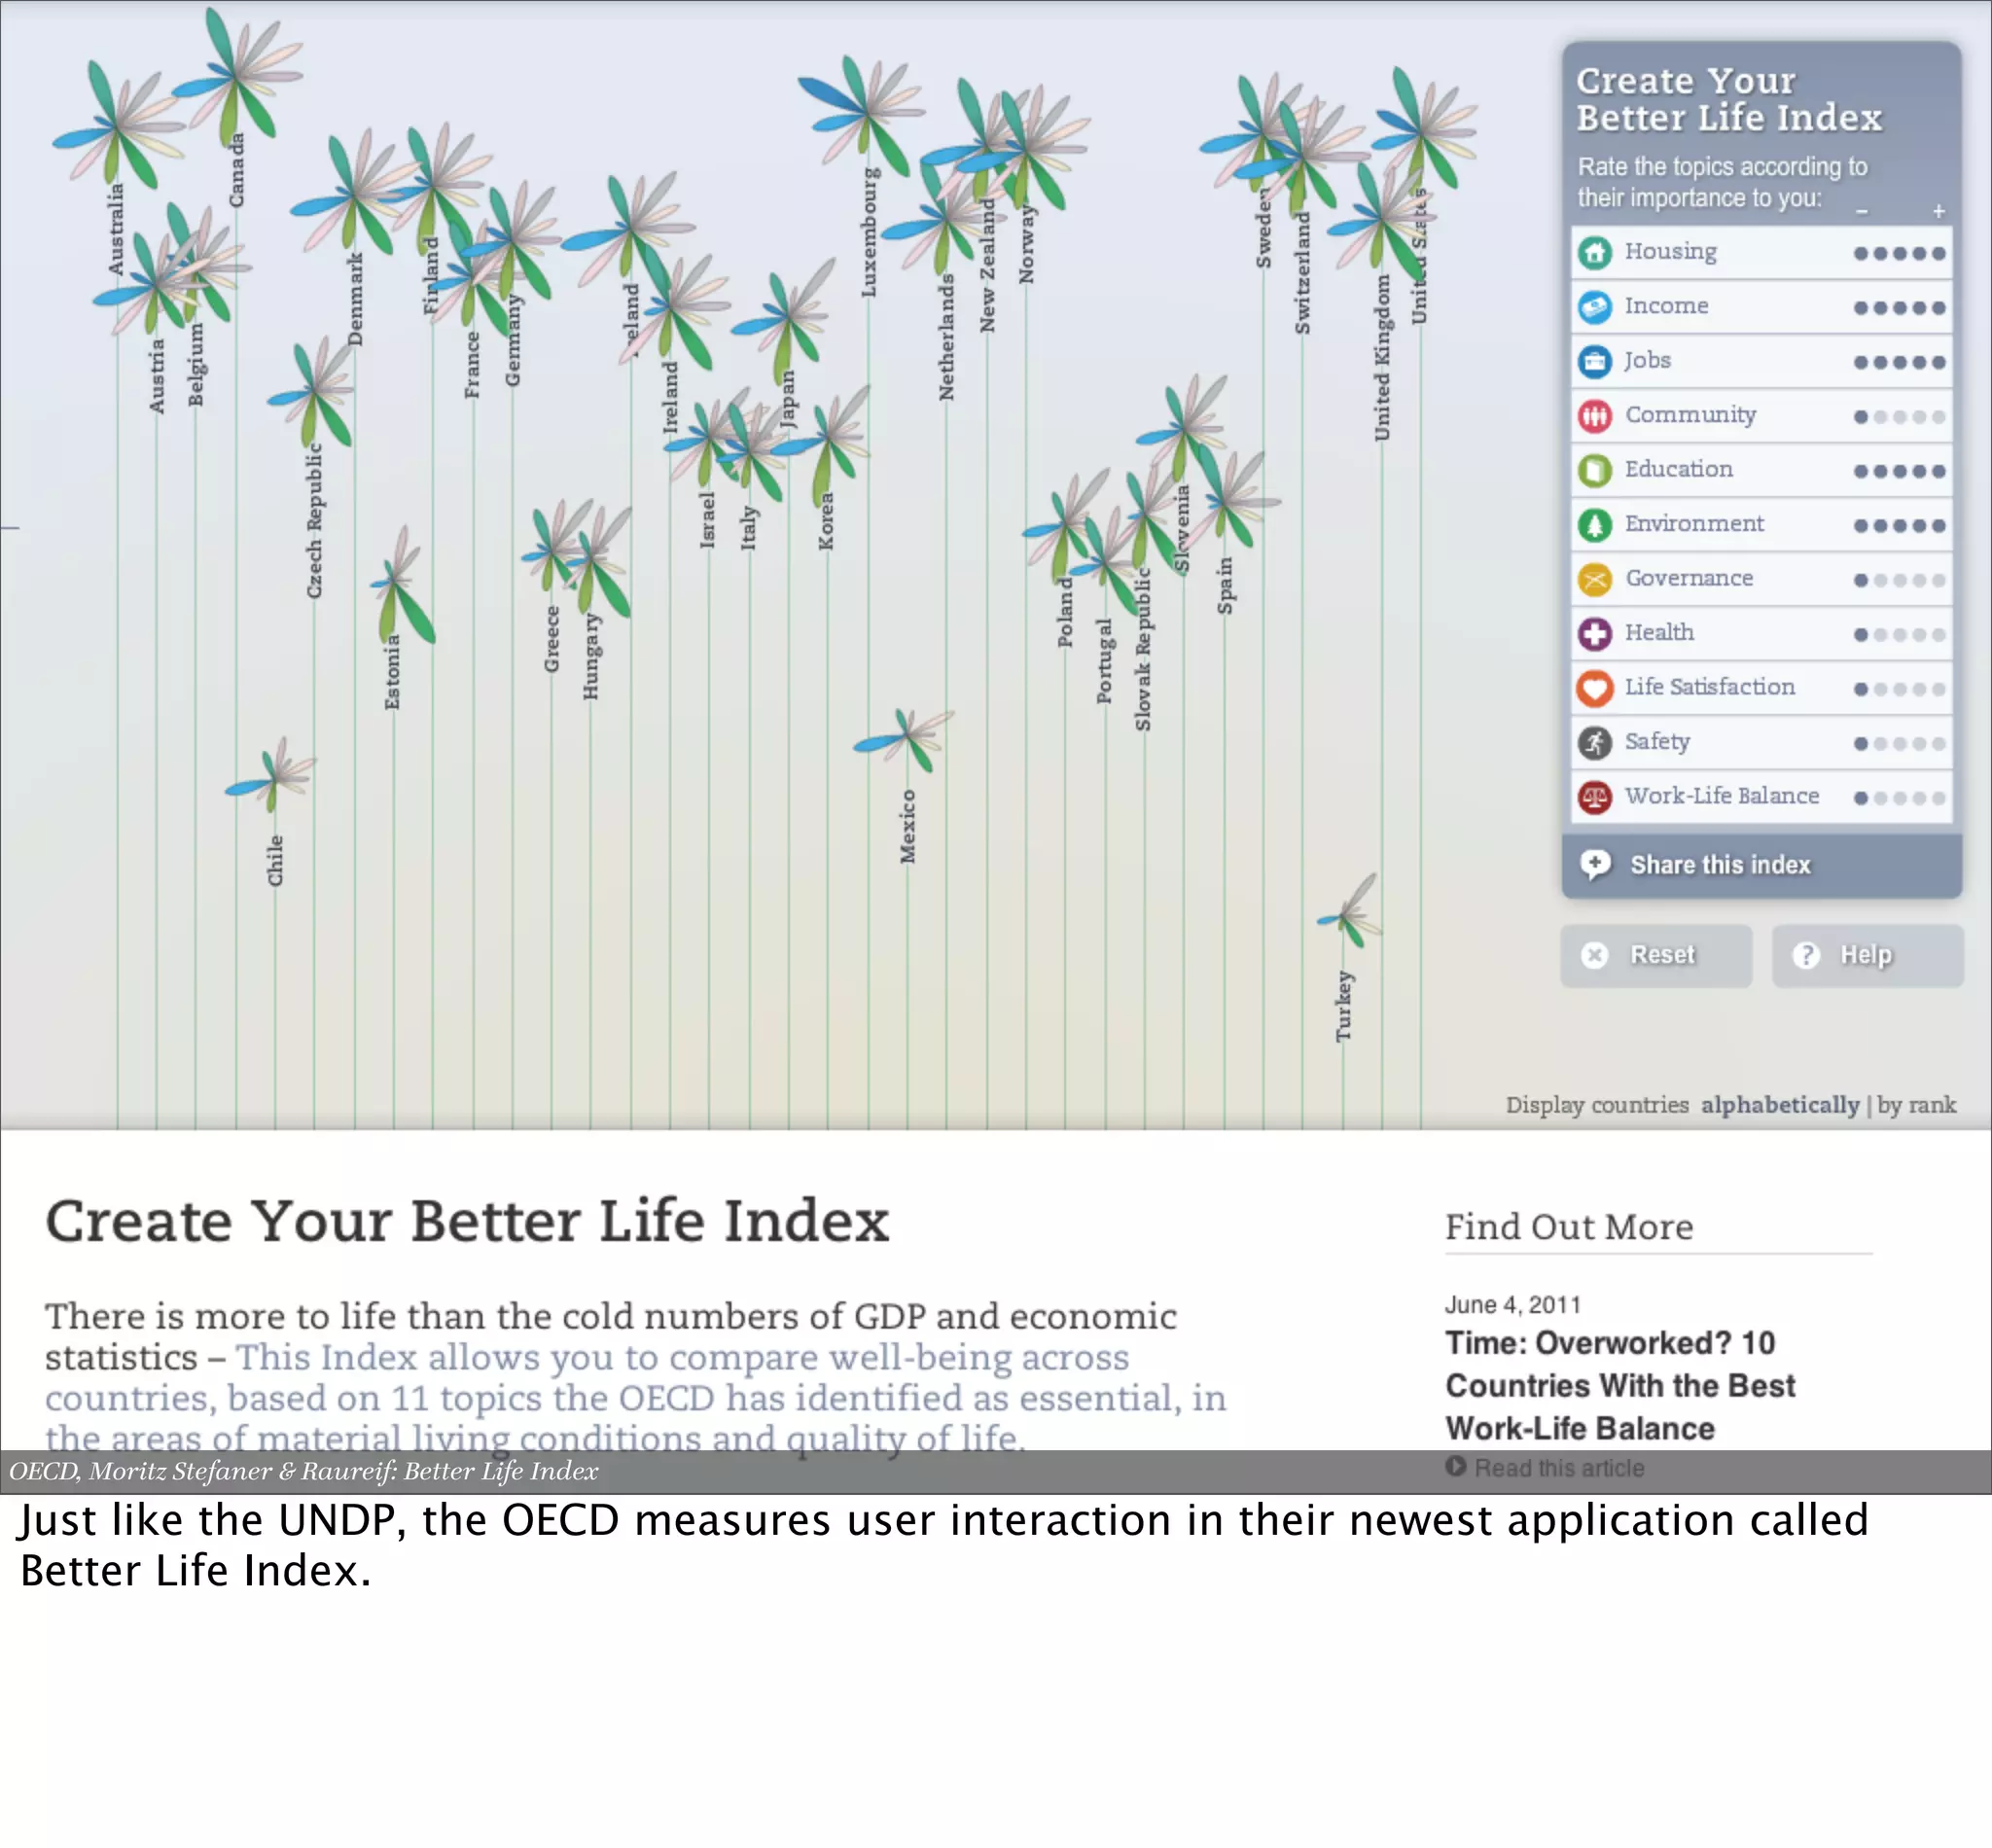
The raising amount data exhaust of the past years has created the need for more and better tools to analyze what lies within this massive amount of raw material. Visualization leveraging the human cognition proves to be an invaluable tool to explore, digest, analyze and communicate the information. We reveal patterns, trends, relations or dependencies that were buried before.
But, what happens after we have created such an elaborate and powerful visualization and released it to the world? How does the it affect the beholder? How does it help shaping his opinions or even changing his behavior? Because, at the end of the day, visualization is simply a means to an end — a tool to achieve a bigger goal.
young call girls in Pandav nagar 🔝 9953056974 🔝 Delhi escort Service
Intent & Impact: Thoughts on Persuasion in Visualization
1. INTENT & IMPACT
Thoughts on Persuasion in Visualization
presented by Interactive Things 1
I dubbed it impact and intent and it will be more an collection of thoughts and questions for
you to reflect on, discuss, seek answers than a complete theory.
2. Explore → Ideate → Create → Publish
presented by Interactive Things 2
One thing that strikes me is the amount of talk around the visual and functional qualities of
visualizations or the process of creating them, but I feel a lack of discussion around the
underlying motivation and the resulting outcome.
I think that visualization should be seen as a means to an end and not an end in it's own
right. Thus, this talk is focused on the things that happen before the exploration phase and
after the publication.
3. Talk - Action = Shit
presented by Interactive Things 3
The underlying thought is…
I am totally stealing this from Brendan Dawes.
4. INTENT & IMPACT
Have a clear understanding
why you do what you do.
presented by Interactive Things 4
5. 01
Set your aim
Informing people
→
Increase knowledge
Convincing people
→
Shape opinions
Nudge people
→
Change behavior
presented by Interactive Things 5
First we need to be clear about our goal with the visualization.
Do you wan‘t to inform people to increase their knowledge? Fine.
Or do you want to convince people and shape their opinions? That‘s fine, too.
Or do you want to nudge people to ultimately change their behavior ? That‘s great!
Inspired by Enrico Bertini, Fell in Love with Data
6. Increasing Knowledge
presented by Interactive Things 6
How do humans learn and increase their knowledge?
7. Sarah Slobin
„ Something new, relevant, different,
informative and even entertaining
is a good place to start.
“
7
If you plan to inform and delight readers then something new, relevant, different, informative
and even entertaining is a good place to start.
Sarah Slobin, Visual Journalist for the Wall Street Journal, previously at NYT, Fortune, CNN
Money.
8. Scheiter, Wiebe, & Holsanova
Decorative
→Enlivening Text
Representational
→Making information more concrete
Organisational
→Bringing coherence to data
Interpretative
→Enhancing understanding of data
Transformative
→Recode information into more
concrete and memorable form,
organizing it through relations, and
providing systemic means of retrieval
presented by Interactive Things 8
Transformative visualization have the strongest positive learning effect. Thus, I highly
recommend to move your efforts in this direction.
Make information concrete & memorable.
Organize it for faster comprehension.
Provide options for analysis.
9. Shaping Opinions
presented by Interactive Things 9
How do humans build up their opinions and beliefs?
10. Aristoteles
„ In an ideal society opinions are the
end result of informed discussions,
readings, & listenings.
“
10
That‘s quite a romantic view on us as humans, but we know it better, right?
11. Whenever we are confronted with external stimuli we first
resort to what we feel or what we believe and later to
what we think.
stimuli limbic system neocortex reaction
The cognitive process is a combination of
emotion & reason.
presented by Interactive Things 11
12. Clara Kayser-Bril, Nicolas Kayser-Bril and Marion Kotlarski: 100 Years of World Cuisine
„100 Years of World Cuisine“ uses very strong visuals that immediately provoke an emotional
reaction to convey their story.
13. Changing Behavior
presented by Interactive Things 13
What is necessary for humans to change their behavior?
14. Behavior Model
According to B. J. Fogg is people's behavior a result of the
convergence of three elements:
Motivation, Ability, & Trigger
presented by Interactive Things 14
To do a certain task or even to change behavior someone must be motivated for that.
Furthermore, the users ability or the tasks simplicity either should be as easy as possible or it
should be perceived easy to do. Finally, the user must be triggered for action.
As designers and developers we need to make it simple for them to use. Thus, the ability
should be a problem.
So how can we motivate people?
And how can we include triggers for action at the right time?
16. Gamification
Using game mechanics in non-gaming contexts to
improve user engangement or even change user behavior.
You know, stuff like rewards, leaderboards, competitions.
presented by Interactive Things 16
There are many services that are sucessfully using game mechanics to increase user
engagement. So, it looks like a promising method that could be applied to visualization as
well.
17. TidyStreet.org
Tidy Street is a project from Brighton, UK that happend earlier this year.
Each day the participants' electricity usage over the previous 24 hours will be marked on the
street compared to the average Brighton household‘s electricity usage.
20. 02
Tell a story
presented by Interactive Things 20
21. Donald Norman
„ Stories are important cognitive
events, for they encapsulate, into “
one compact package,
information, knowledge, context,
& emotion.
21
Effectively designed transformational visualizations can assume this exact role, acting not
just as simple data representations but rather as layered, multidimensional, optical
allegories, perceptually aequivalent to stories.
Inspired by Carla Casilli.
22. Edward Segel & Jeffrey Heer
Narrative Visualization: Telling Stories with Data
Martini Glass Structure
Interactive Slideshow
Drill-Down Story
presented by Interactive Things 22
Edward Segel and Jeffrey Heer published a wonderful paper in 2010 about this topic — I
recommend everybody has a look at it. Narrative Visualization: Telling Stories with Data
23. Faces of the Dead by New York Times
Martini Glass Structure: Starts with one story and then let‘s the user explore further.
24. Budget Forecasts, Compared With reality by Amanda Cox for New York Times
Interactive Slideshow: Tells the story over multiple slides with every slide being interactive.
25. Murder: New York City by New York Times
Drill-Down Story: The user needs to start exploring the application to get more detailed
information.
26. 03
Make it personal
presented by Interactive Things 26
27. Jobless Rate for People Like You by New York Times
Start with the general public
28. Jobless Rate for People Like You by New York Times
Select your own demography…
29. Jobless Rate for People Like You by New York Times
And then start comparing it to related or opposite demographics.
30. 04
Don‘t be evil
The people trust you to act with fair
spirit — please be aware of that.
presented by Interactive Things 30
31. You can twist data just
like a balloon animal.
But, keep in mind that
these things usually pop
before you get home.
canopic on flickr.com
33. When you design to convey your audience to consider
novel opinions, here are some things to keep in mind:
• Bandwidth
• Overload
• Framing
• Scale
• Social Effects
presented by Interactive Things 33
Bandwidth
How much information can we process?
Overload
Remove unnecessary distractions
Framing
What‘s the context of the information?
Scale
Show consequences and implications based on the information
Social Effects
Social remoteness may prevent sympathising with the information — make
it human!
34. INTENT & IMPACT
Have a clear vision for what you
want to achieve with your work.
presented by Interactive Things 34
36. John Snow convinced Whitehead that the Broad Street
pump was the source of the local infections. Whitehead
then joined with Snow in tracking the contamination to a
faulty cesspool and the outbreak’s index case
presented by Interactive Things 36
Henry Whitehead was a Church of England Cleric.
37. Florence Nightingale: Causes of Mortality in the Army in the East
Florence Nightingale: Causes of Mortality in the Army in the East
38. Florence Nightingale convinced military authorities,
Parliament and Queen Victoria to carry out her reforms.
Her insistence on good sanitation, fresh air and public
health saved thousands of lives, both for soldiers and
civilians, on battlefields and in hospitals.
presented by Interactive Things 38
39. Al Gore, An Inconvenient Truth
Al Gore, An Inconvenient Truth
40. • Over 106,000 tons of carbon were offset in the year
following the film's release, which is equivalent to
225 million car miles.
• 4200+ tons of carbon were offset just by people
swtiching to compact fluorescent light bulbs.
• Over 15 climate change bills have been introduced in
Congress, with the historic Markey-Waxman Bill
passing the House in June, 2009.
• Over 2600 people have been trained to give The
Climate Project presentation and 4 million people on
all seven continents have heard the presentation.
presented by Interactive Things 40
41. 05
Plan
Plan the actions that you want people to
take after engaging with your work.
presented by Interactive Things 41
Like, Share, Digg, Save are not impacting people's lives!
Include actionable items into your visualizations & interfaces and set up the infrstructure for
people to take action.
42. Small Habits by GreenPeace & Daniel Fischer
Include actionable items into your visualizations & interfaces and set up the infrstructure for
people to take action.
Small Habits by GreenPeace & Daniel Fischer
43. The Human's Development by Global Giving & Roland Loesslein
Include actionable items into your visualizations & interfaces and set up the infrstructure for
people to take action.
The Human's Development by Global Giving & Roland Loesslein
44. 06
Observe
Observe the impact that your
work has after you published it.
presented by Interactive Things 44
45. Google Analytics Feedburner
Twitter Search Social Mention
presented by Interactive Things 45
Try to measure as much as possible about the usage of your visualization.
Google Analytics, Google Reader, Twitter, Social Mention.
Don't stop there and rather set up your own analytics…
46. UNDP & Interactive Things: Human Development Report 2.0
The UNDP measures all submitted configurations to learn from the people. Ultimately this
could influence how the different dimensions of the Human Development Index are
wheighted.
47. OECD, Moritz Stefaner & Raureif: Better Life Index
Just like the UNDP, the OECD measures user interaction in their newest application called
Better Life Index.
48. Recap
1. Set your aim
2. Tell a story
3. Make it personal
4. Don‘t be evil
5. Plan for actions
6. Observe your impact
presented by Interactive Things 48
49. THANKS!
If you have any questions, please get in touch.
Email benjamin@interactivethings.com
Twitter @wiederkehr
Phone +41 76 533 33 72
presented by Interactive Things 49