Download to read offline

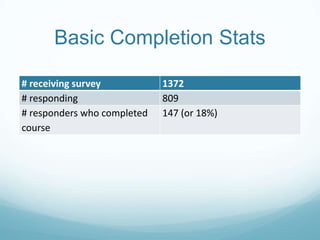

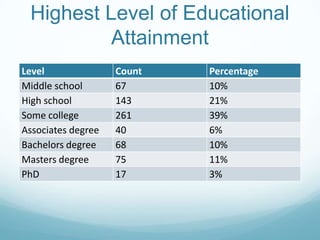

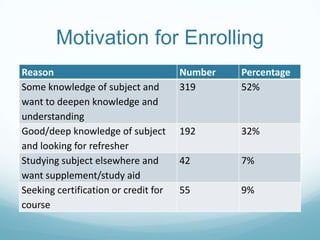
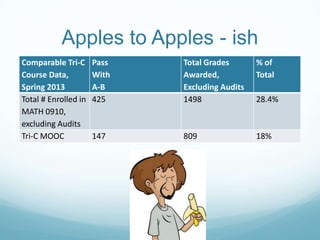
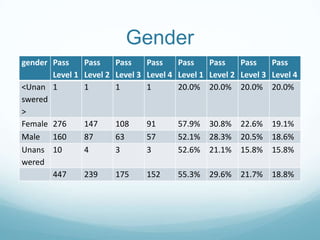
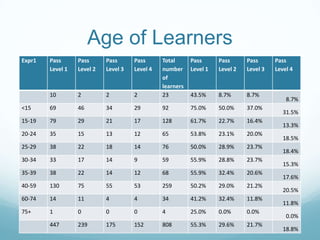
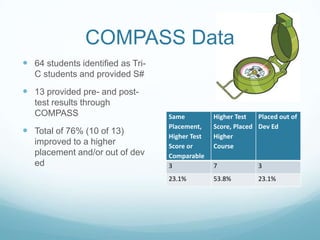

This document summarizes data from a MOOC course, including: - 18% of survey respondents completed the course - Most participants had some college education or higher, and over 25% were currently enrolled in higher education - The top motivations for enrolling were to deepen knowledge and as a study supplement - Completion rates were similar to a comparable in-person course, with around 55% completing the first level and around 30% completing the second level - Completion rates were similar across gender and age ranges, with the highest rates for those aged 15-19 - Of students who also took a placement exam, 76% improved their placement level or scored high enough to avoid remedial courses


