Download as PDF, PPTX


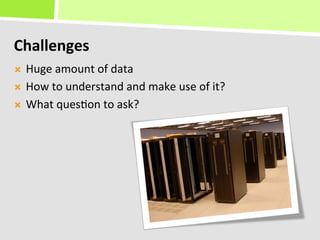
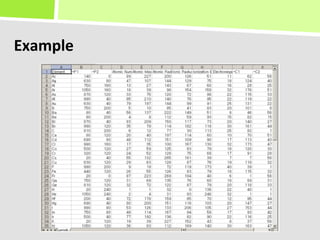


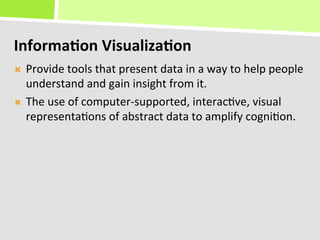


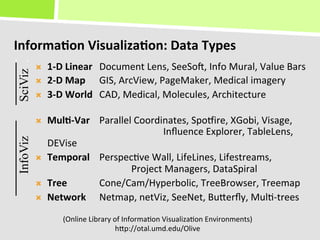
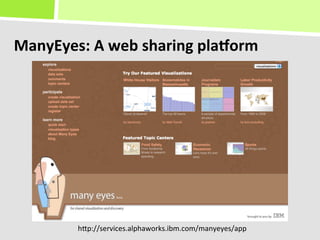


This document provides an introduction to information visualization and its role in knowledge discovery. It discusses the challenges of understanding large datasets and how information visualization techniques like scatter plots, maps, and interactive visualizations can help identify patterns, trends, outliers and support communication and discovery. Examples of information visualization tools and techniques are presented across different data types like temporal, hierarchical, and network data.