Download as PDF, PPTX
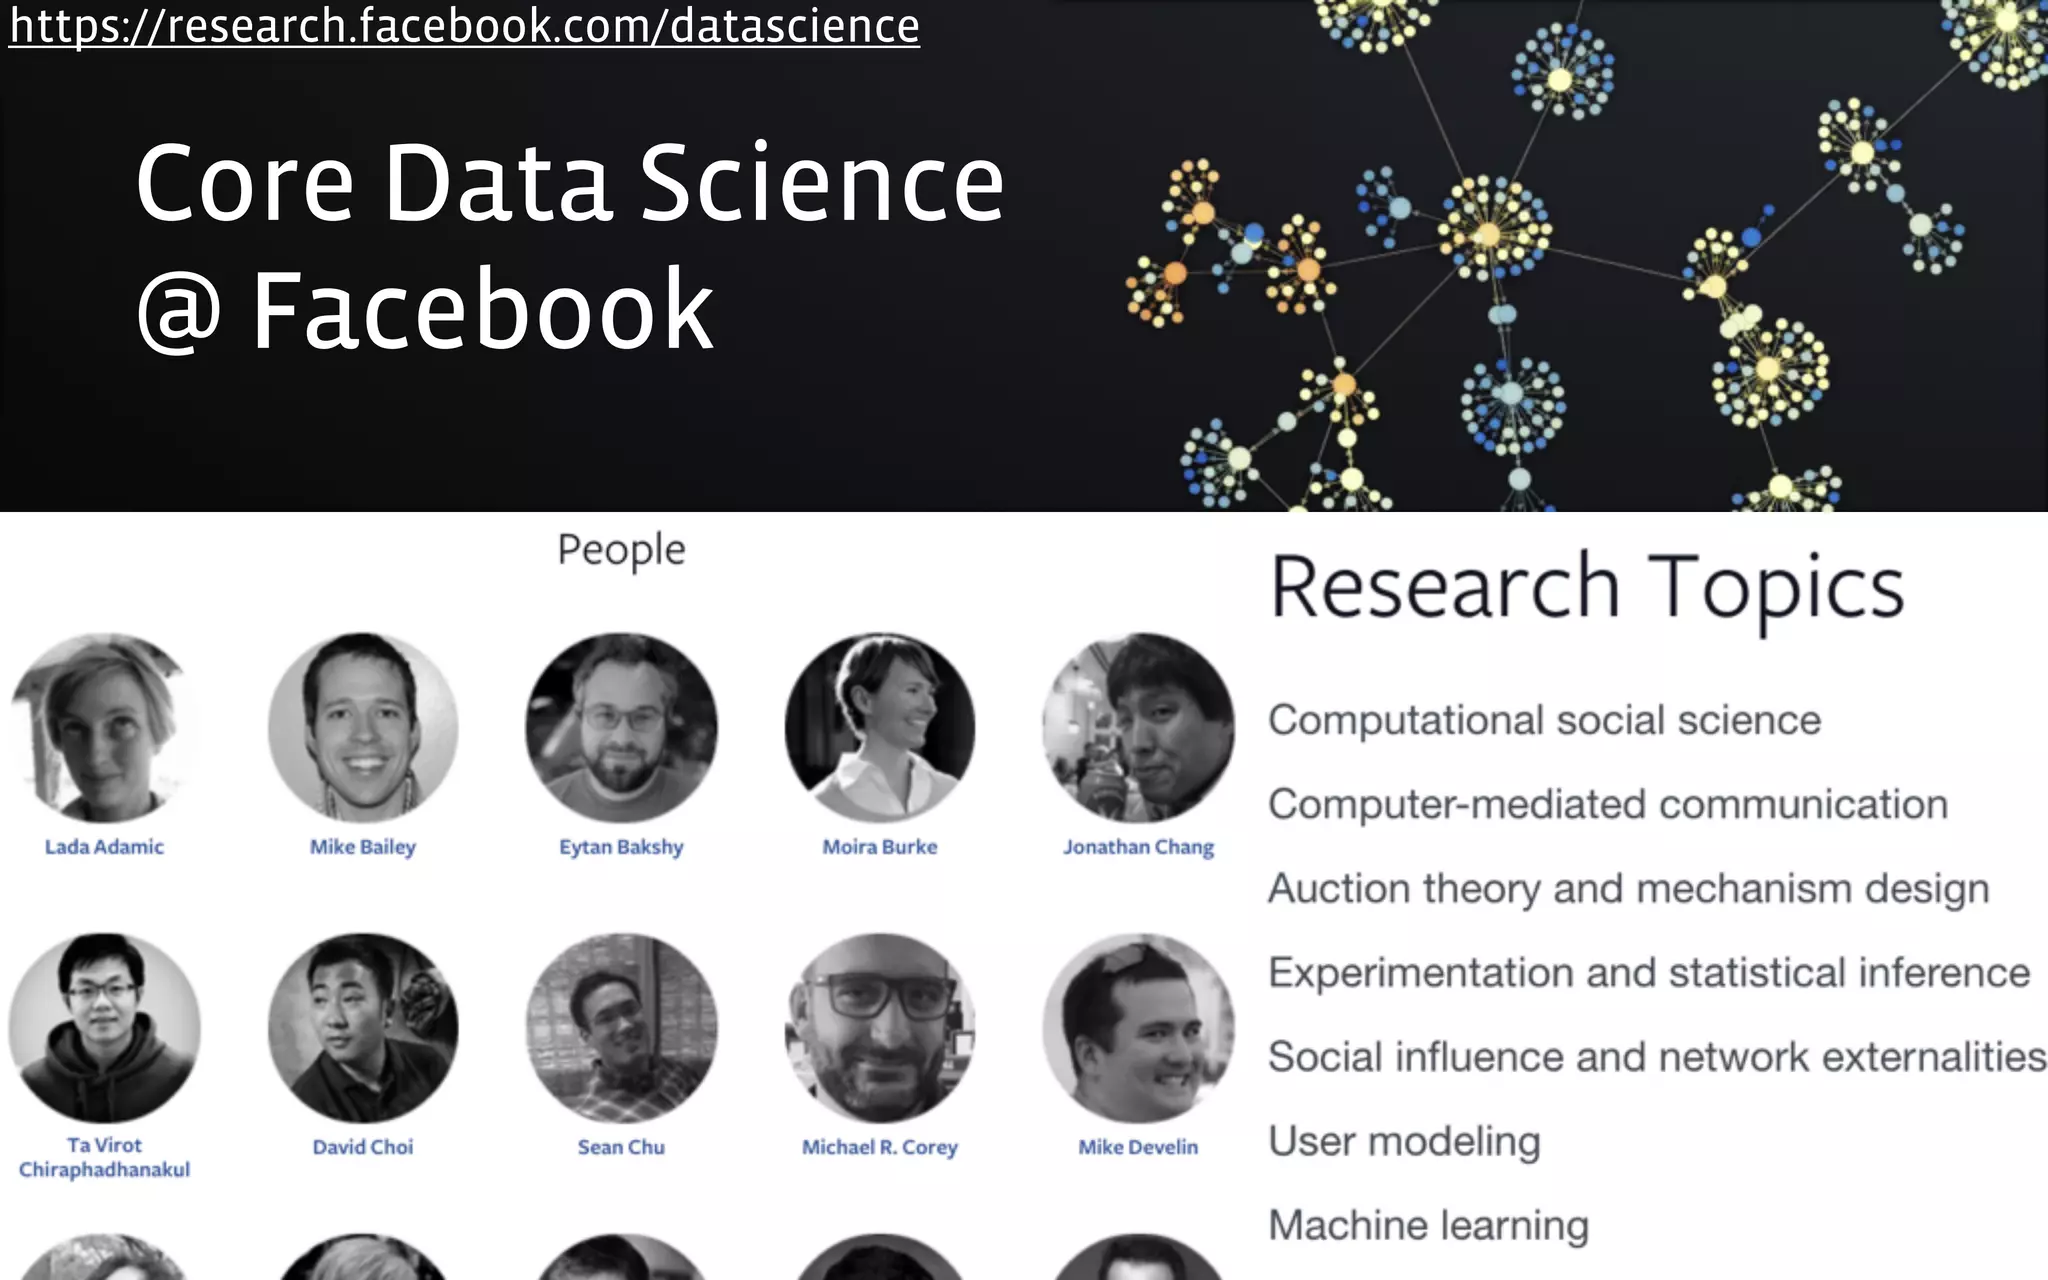


The document discusses putting "magic" into data science. It provides several tricks or techniques for data science, including collecting novel data sources, dimensionality reduction, Bayesian methods, bootstrapping statistics, and matrix factorizations. It also emphasizes the importance of reliability, latency/interactivity, simplicity/modularity, and unexpectedness to solve the "last mile" problem of getting people to actually use data science tools and models. Specific Facebook tools like Planout, Deltoid, ClustR, Prophet, and Hive/Presto/Scuba are presented as examples.


![Big Data [sorry] & Data Science: What Does a Data Scientist Do?](https://cdn.slidesharecdn.com/ss_thumbnails/dslatcloudmsevent20130125-130126065651-phpapp01-thumbnail.jpg?width=640&height=640&fit=bounds)


![Emerging_Exponential_Technologies[1]_[Autosaved]_[Autosaved][1].pptx](https://cdn.slidesharecdn.com/ss_thumbnails/emergingexponentialtechnologies1autosavedautosaved1-230427140545-d3e1b33e-thumbnail.jpg?width=640&height=640&fit=bounds)


