Downloaded 203 times
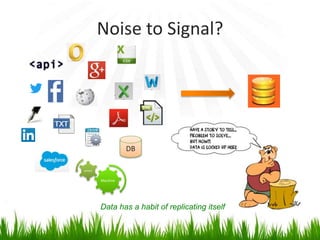
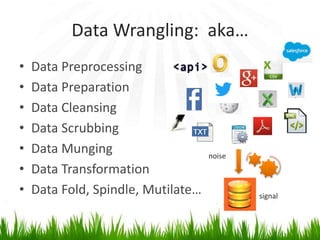
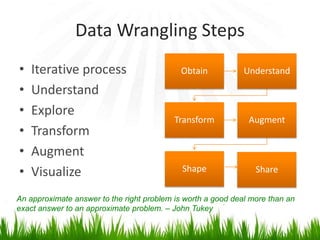


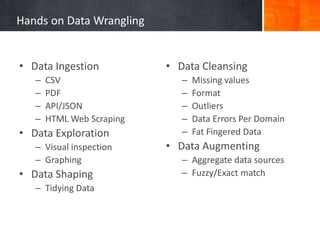


The document discusses the importance of data wrangling in improving data quality, which is critical for making accurate business decisions. It highlights various methods and tools for data transformation, cleansing, and visualization, emphasizing the significance of tidy data. The presentation also addresses challenges related to data accuracy and governance faced by enterprises, stressing the need for proper data management practices.


![Introduction to Pandas and Time Series Analysis [PyCon DE]](https://cdn.slidesharecdn.com/ss_thumbnails/introductiontopandasandtimeseriesanalysispyconde-170617163724-thumbnail.jpg?width=640&height=640&fit=bounds)