![Using Visuals to convey information Luís Manuel Borges Gouveia [email_address] Multimedia Resource Centre Fernando Pessoa University Porto - Portugal ICEIS 2004 Conference, 14-17 April](https://image.slidesharecdn.com/iceis-04-1193499331731230-3/75/Using-visuals-to-convey-information-1-2048.jpg)
![Motivation different representations can enhance the understanding level of a particular problem [ Tufte ]. the form of representation makes a dramatic difference in the ease of the task [ Norman ]. Norman proposes that external representations, that can be part of a workspace shared with others, require some sort of constructed device to support them: an artefact. is proposed an interface that tries to remove the computer as an object of perception, allowing the user to interact directly with the generated environment as discussed by [ Hubbold et al ].](https://image.slidesharecdn.com/iceis-04-1193499331731230-3/75/Using-visuals-to-convey-information-5-2048.jpg)
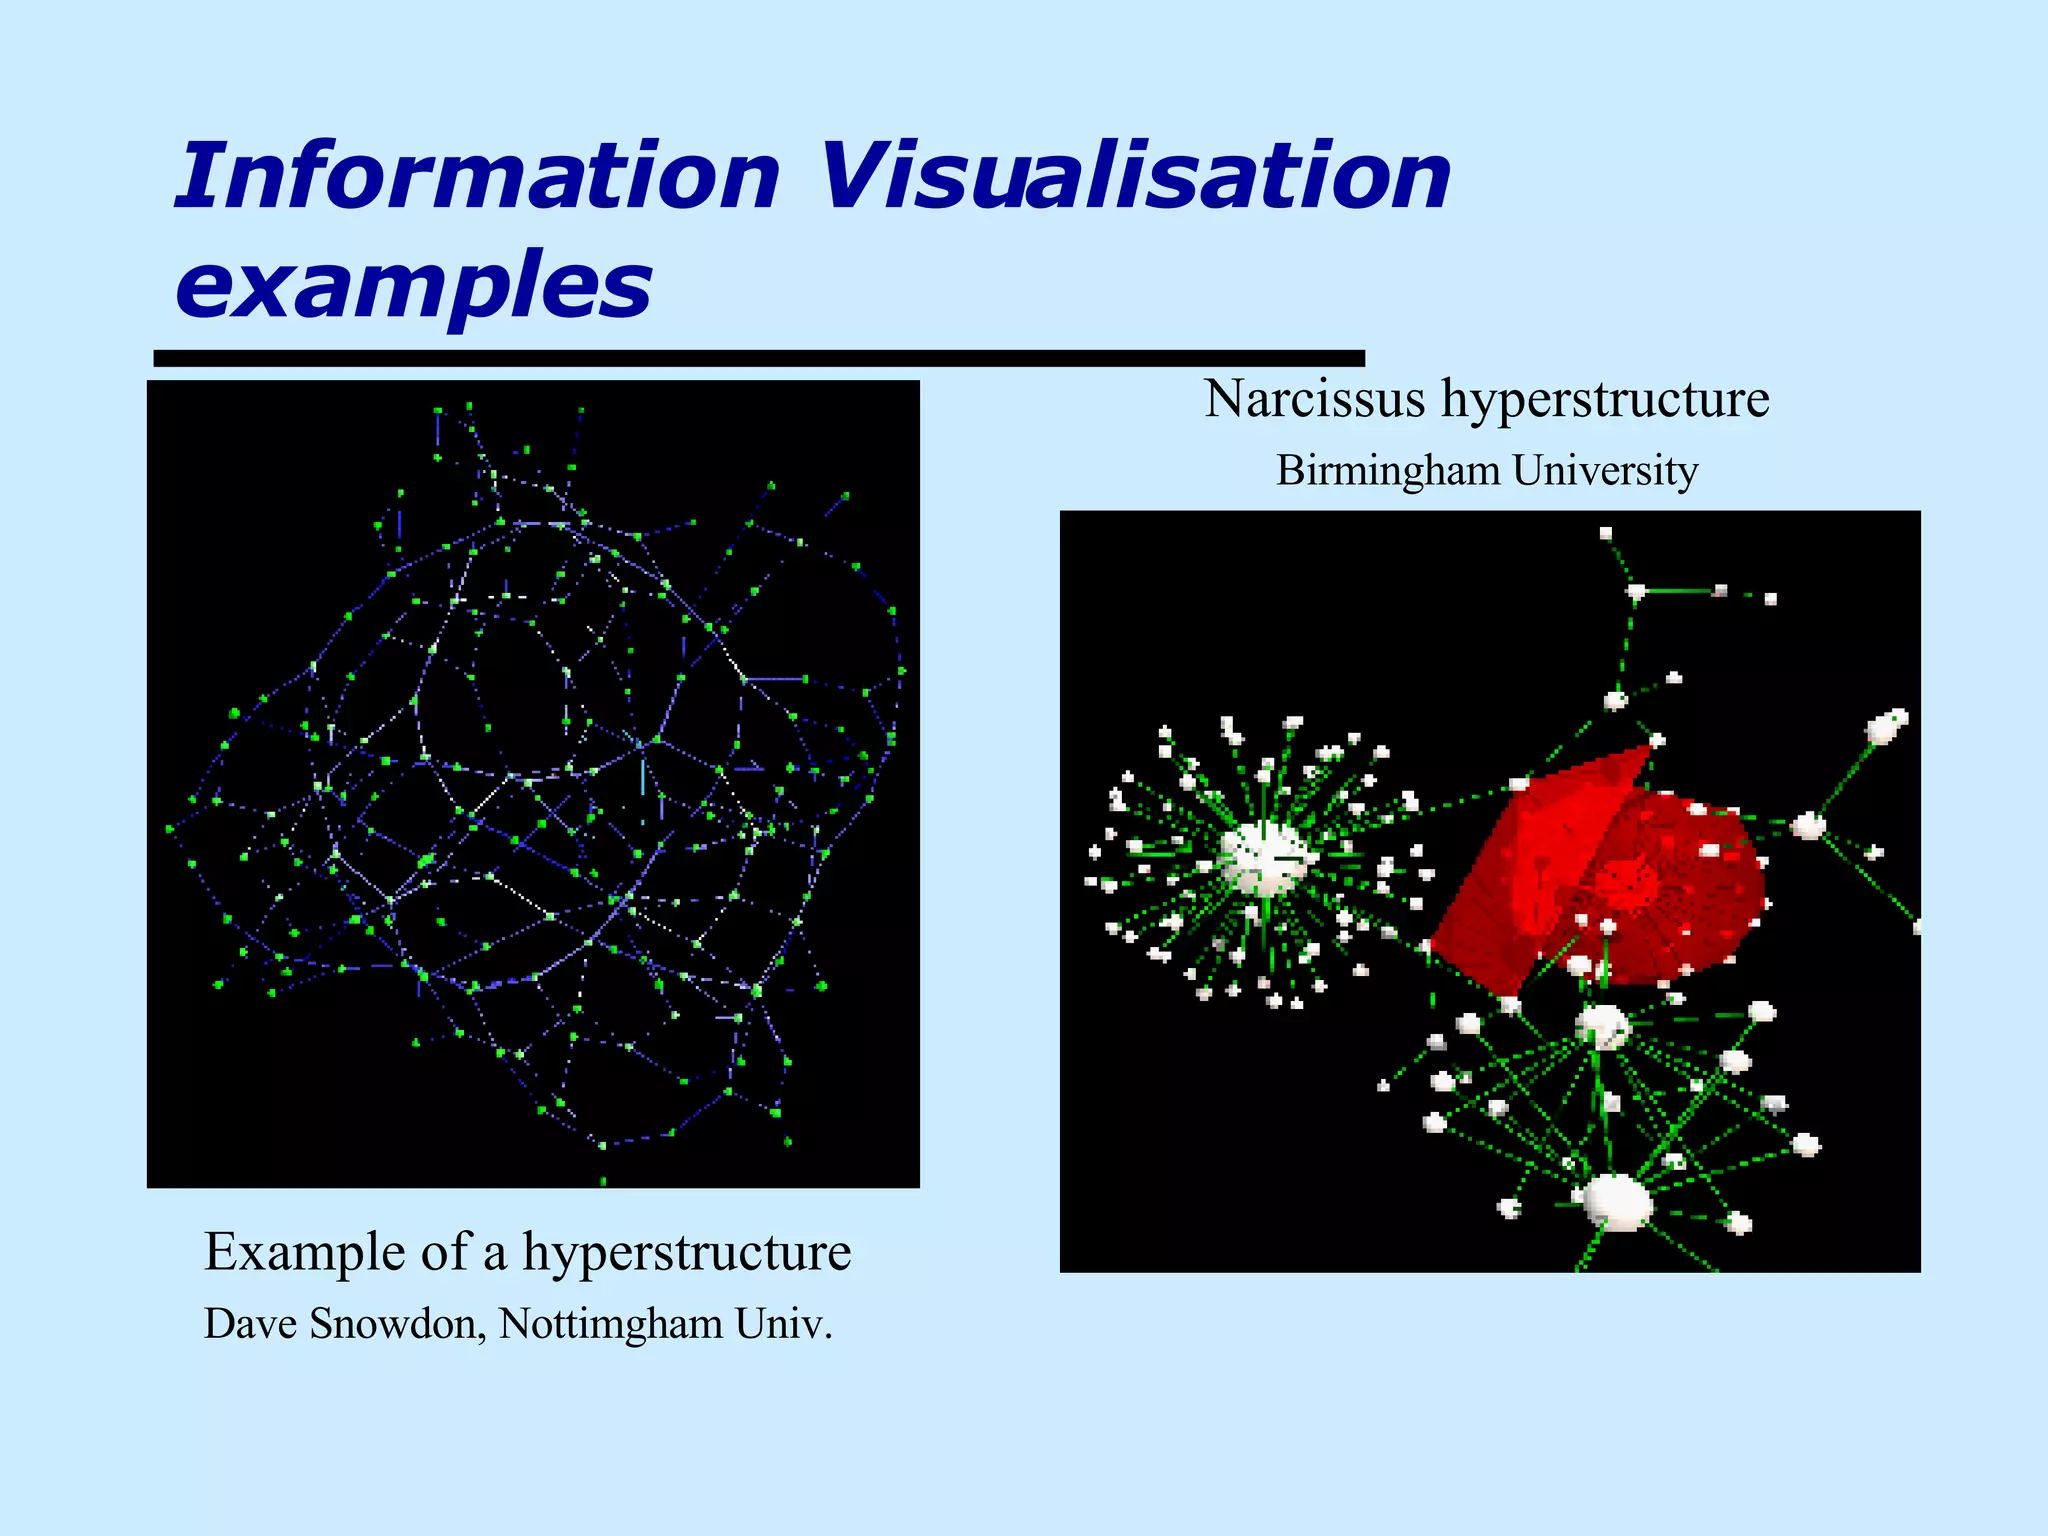
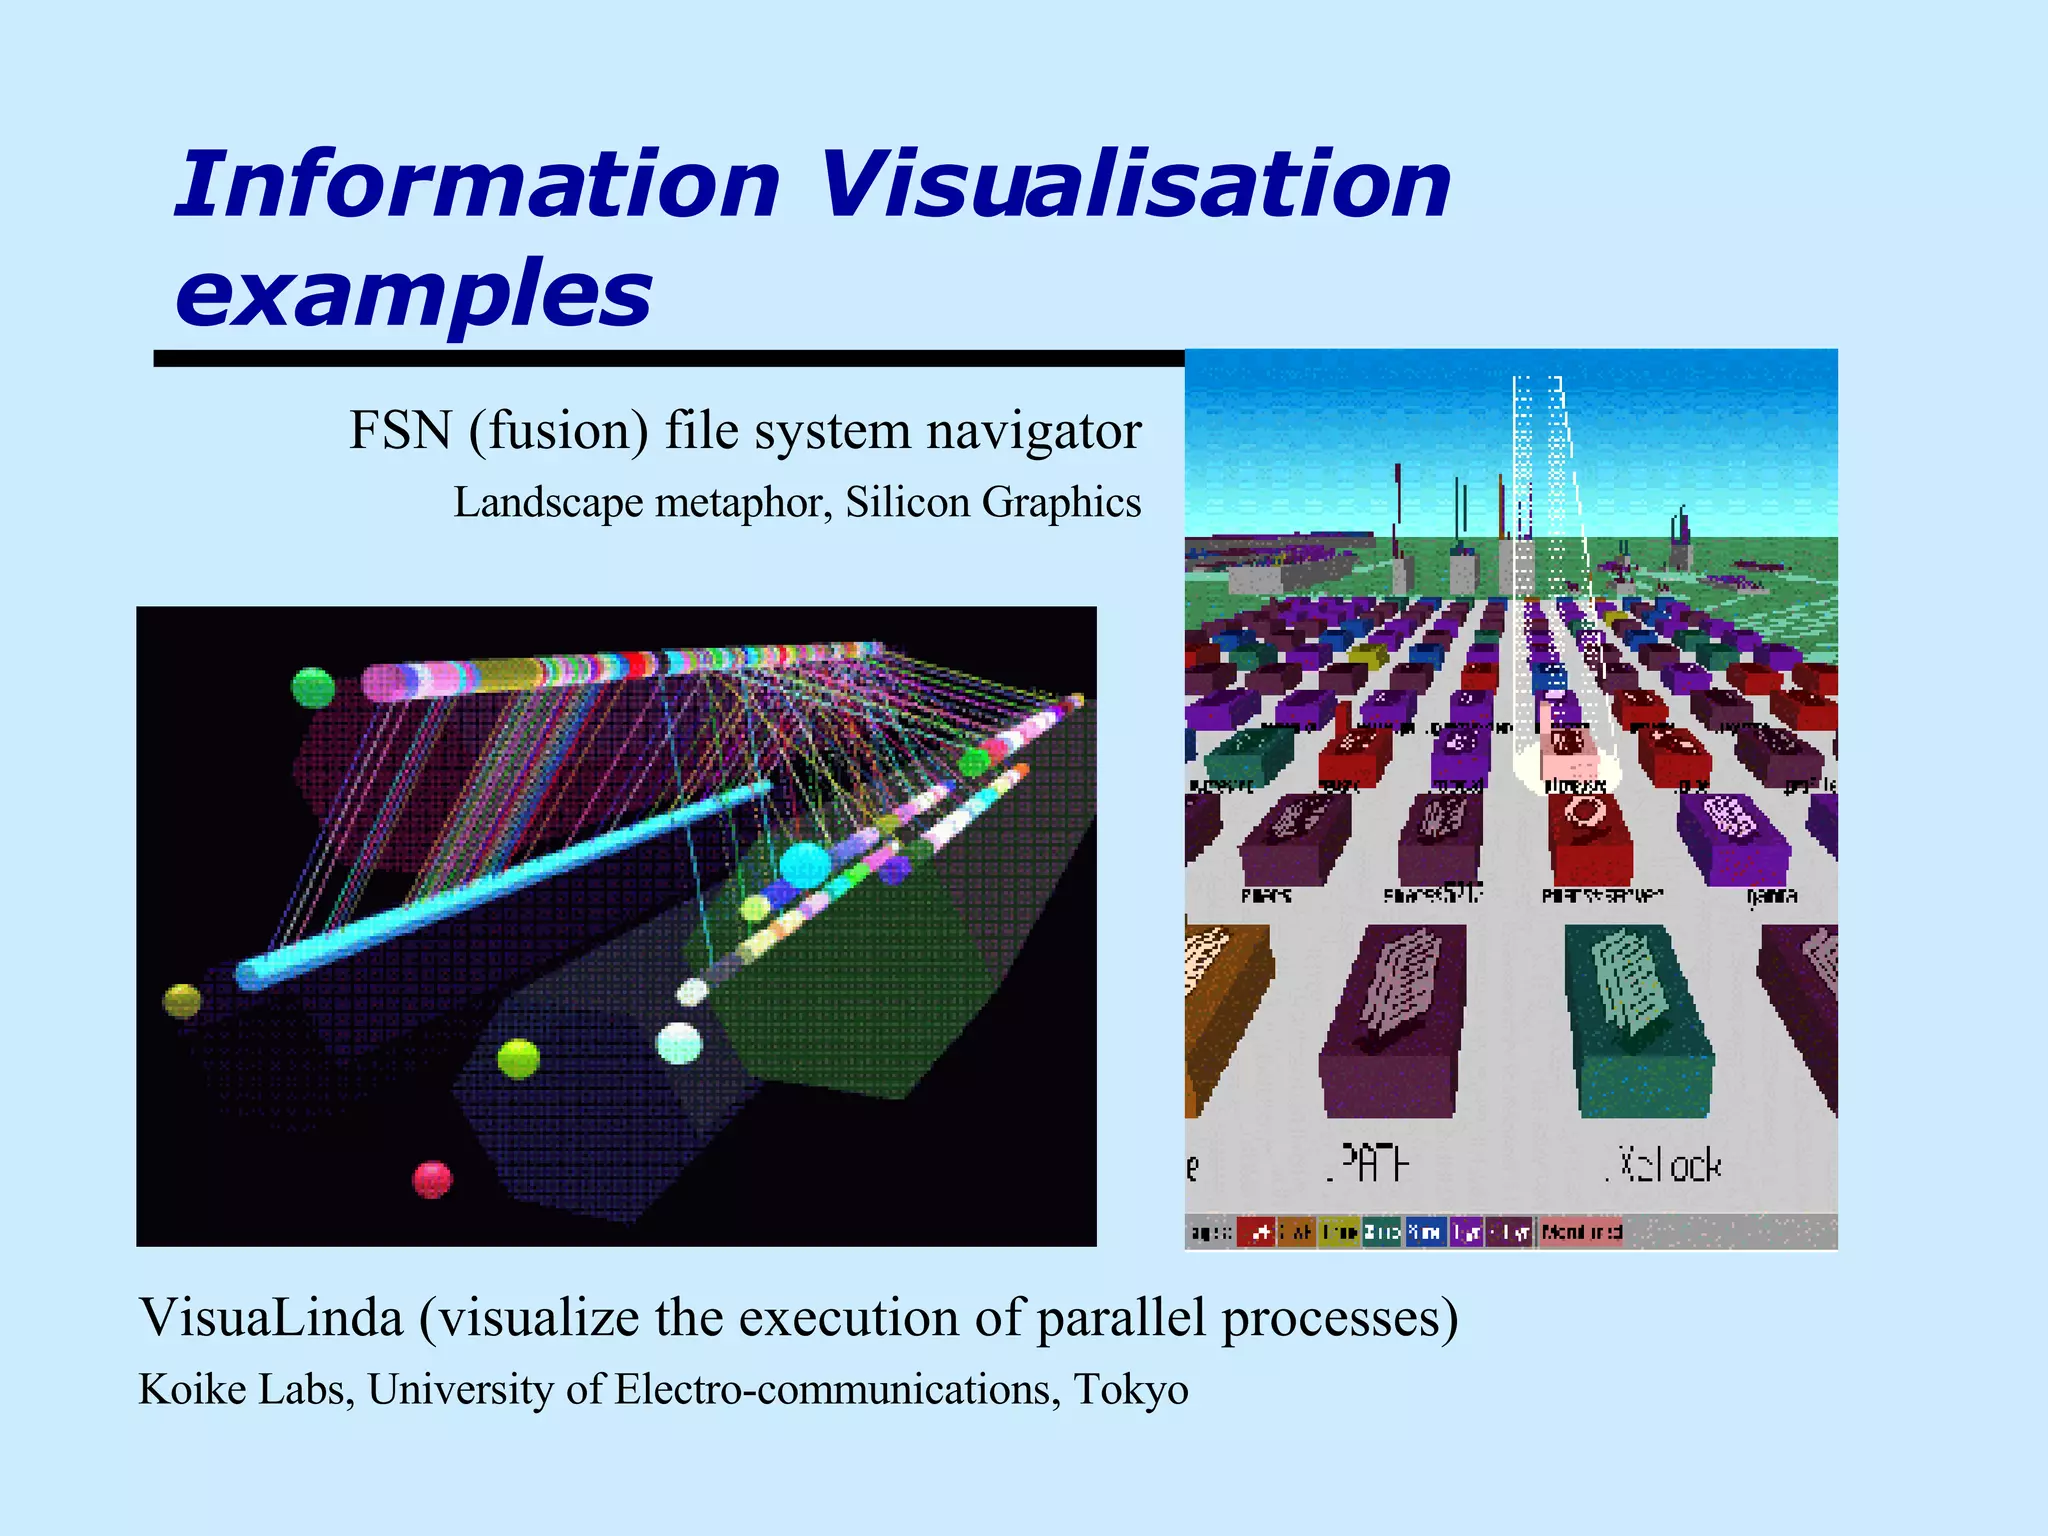
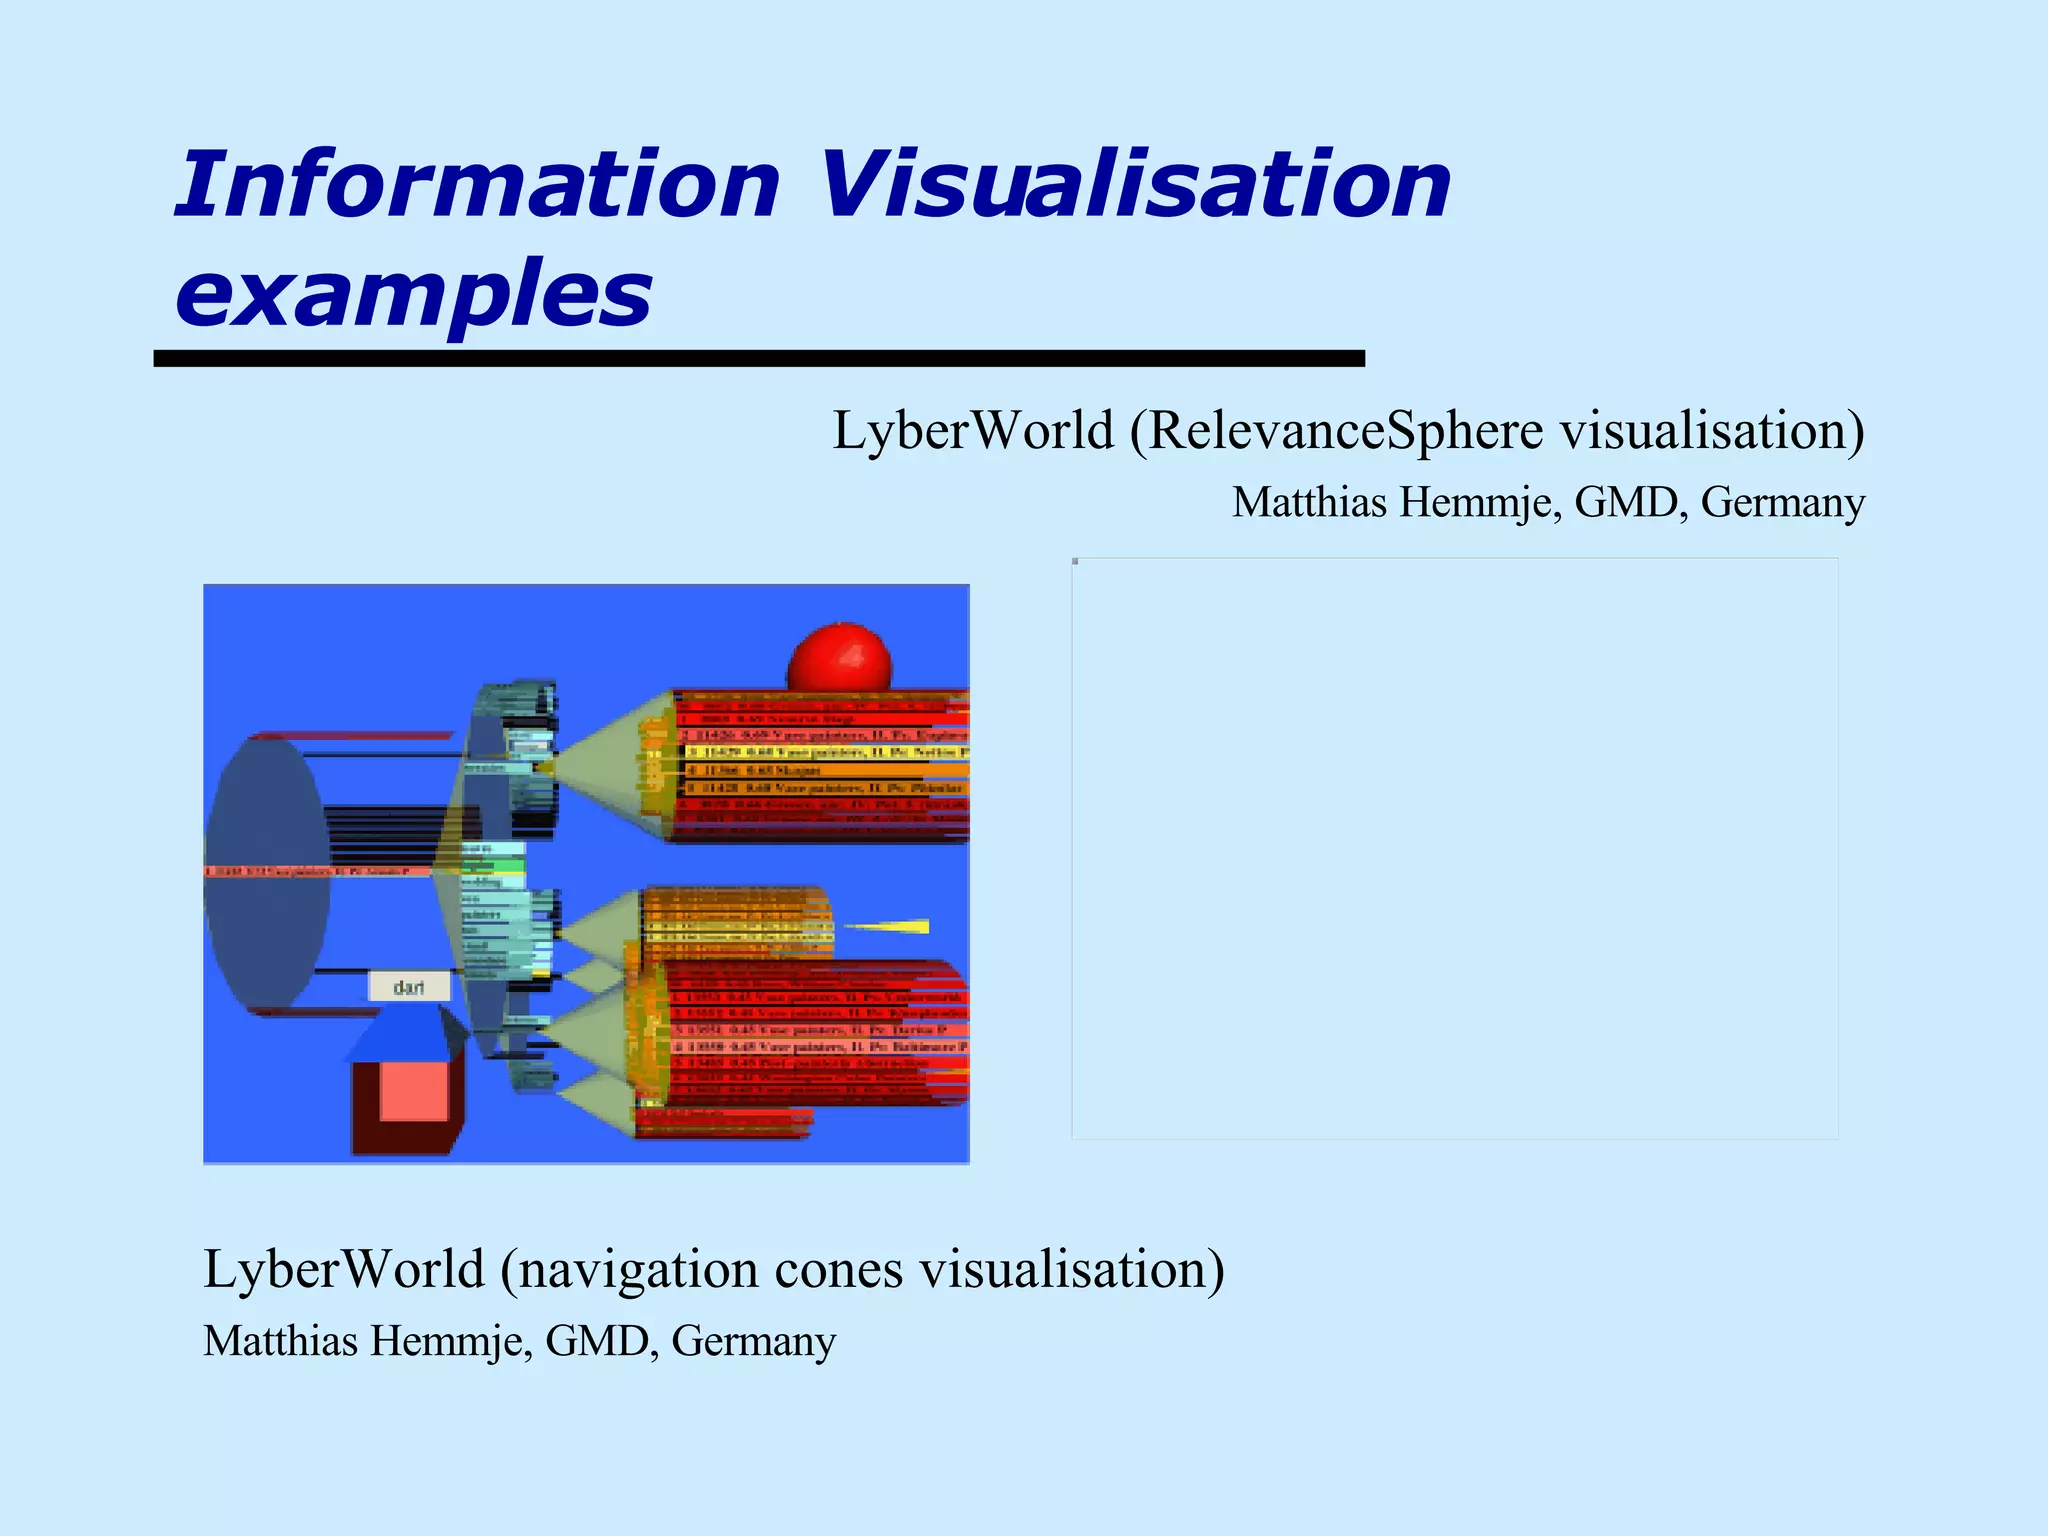
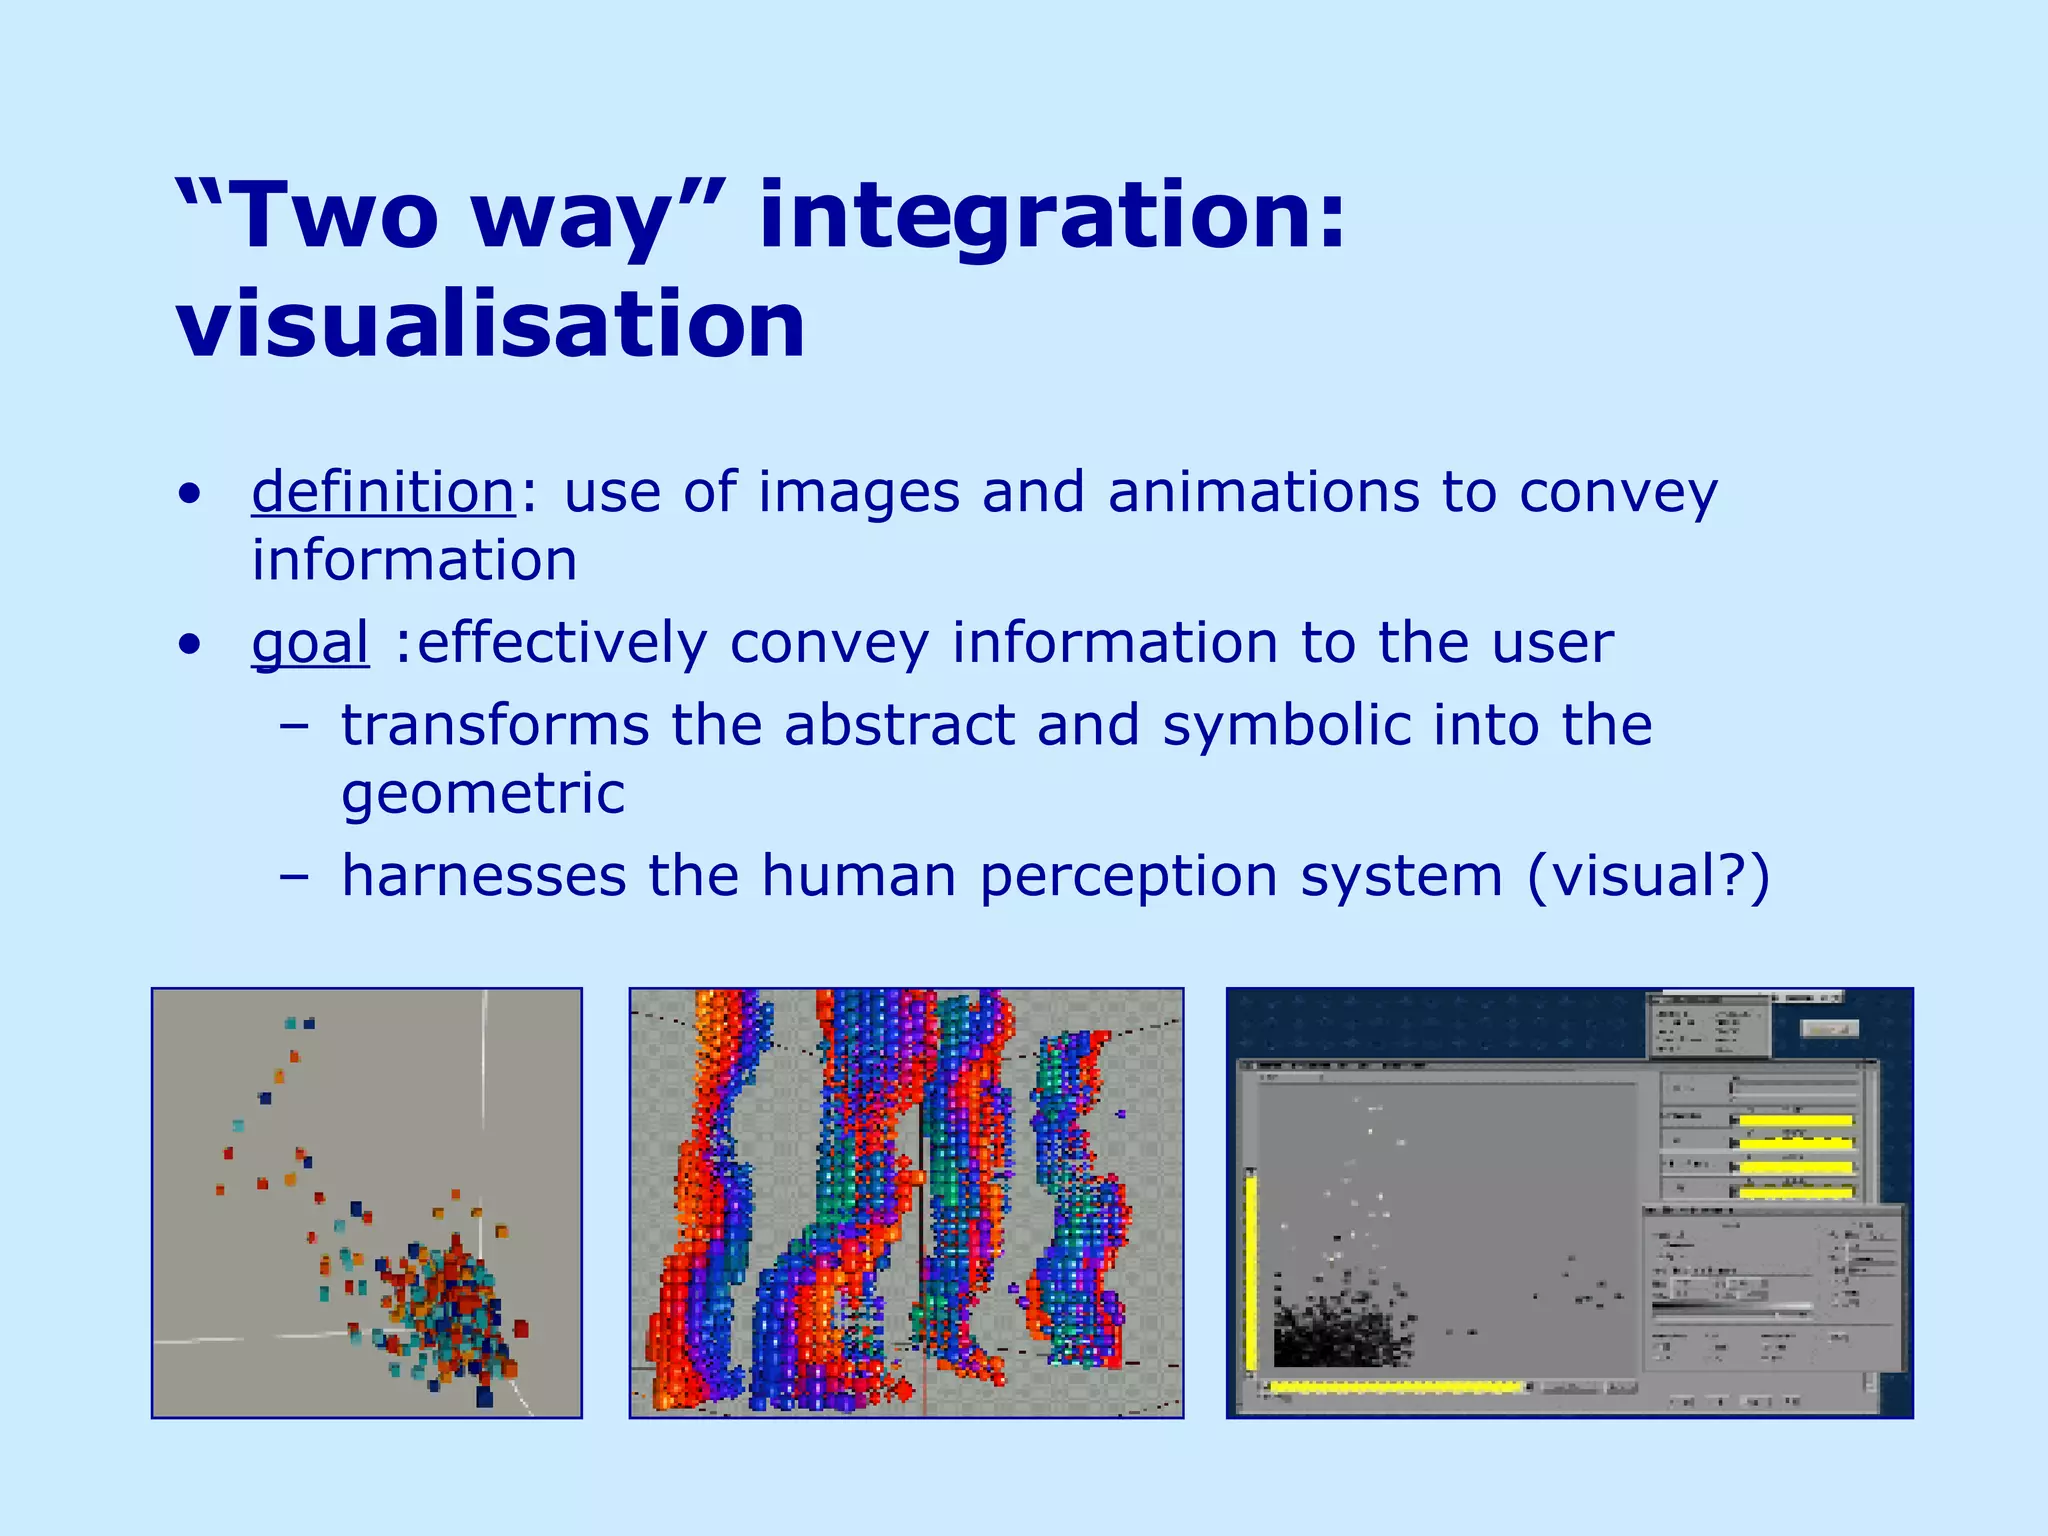
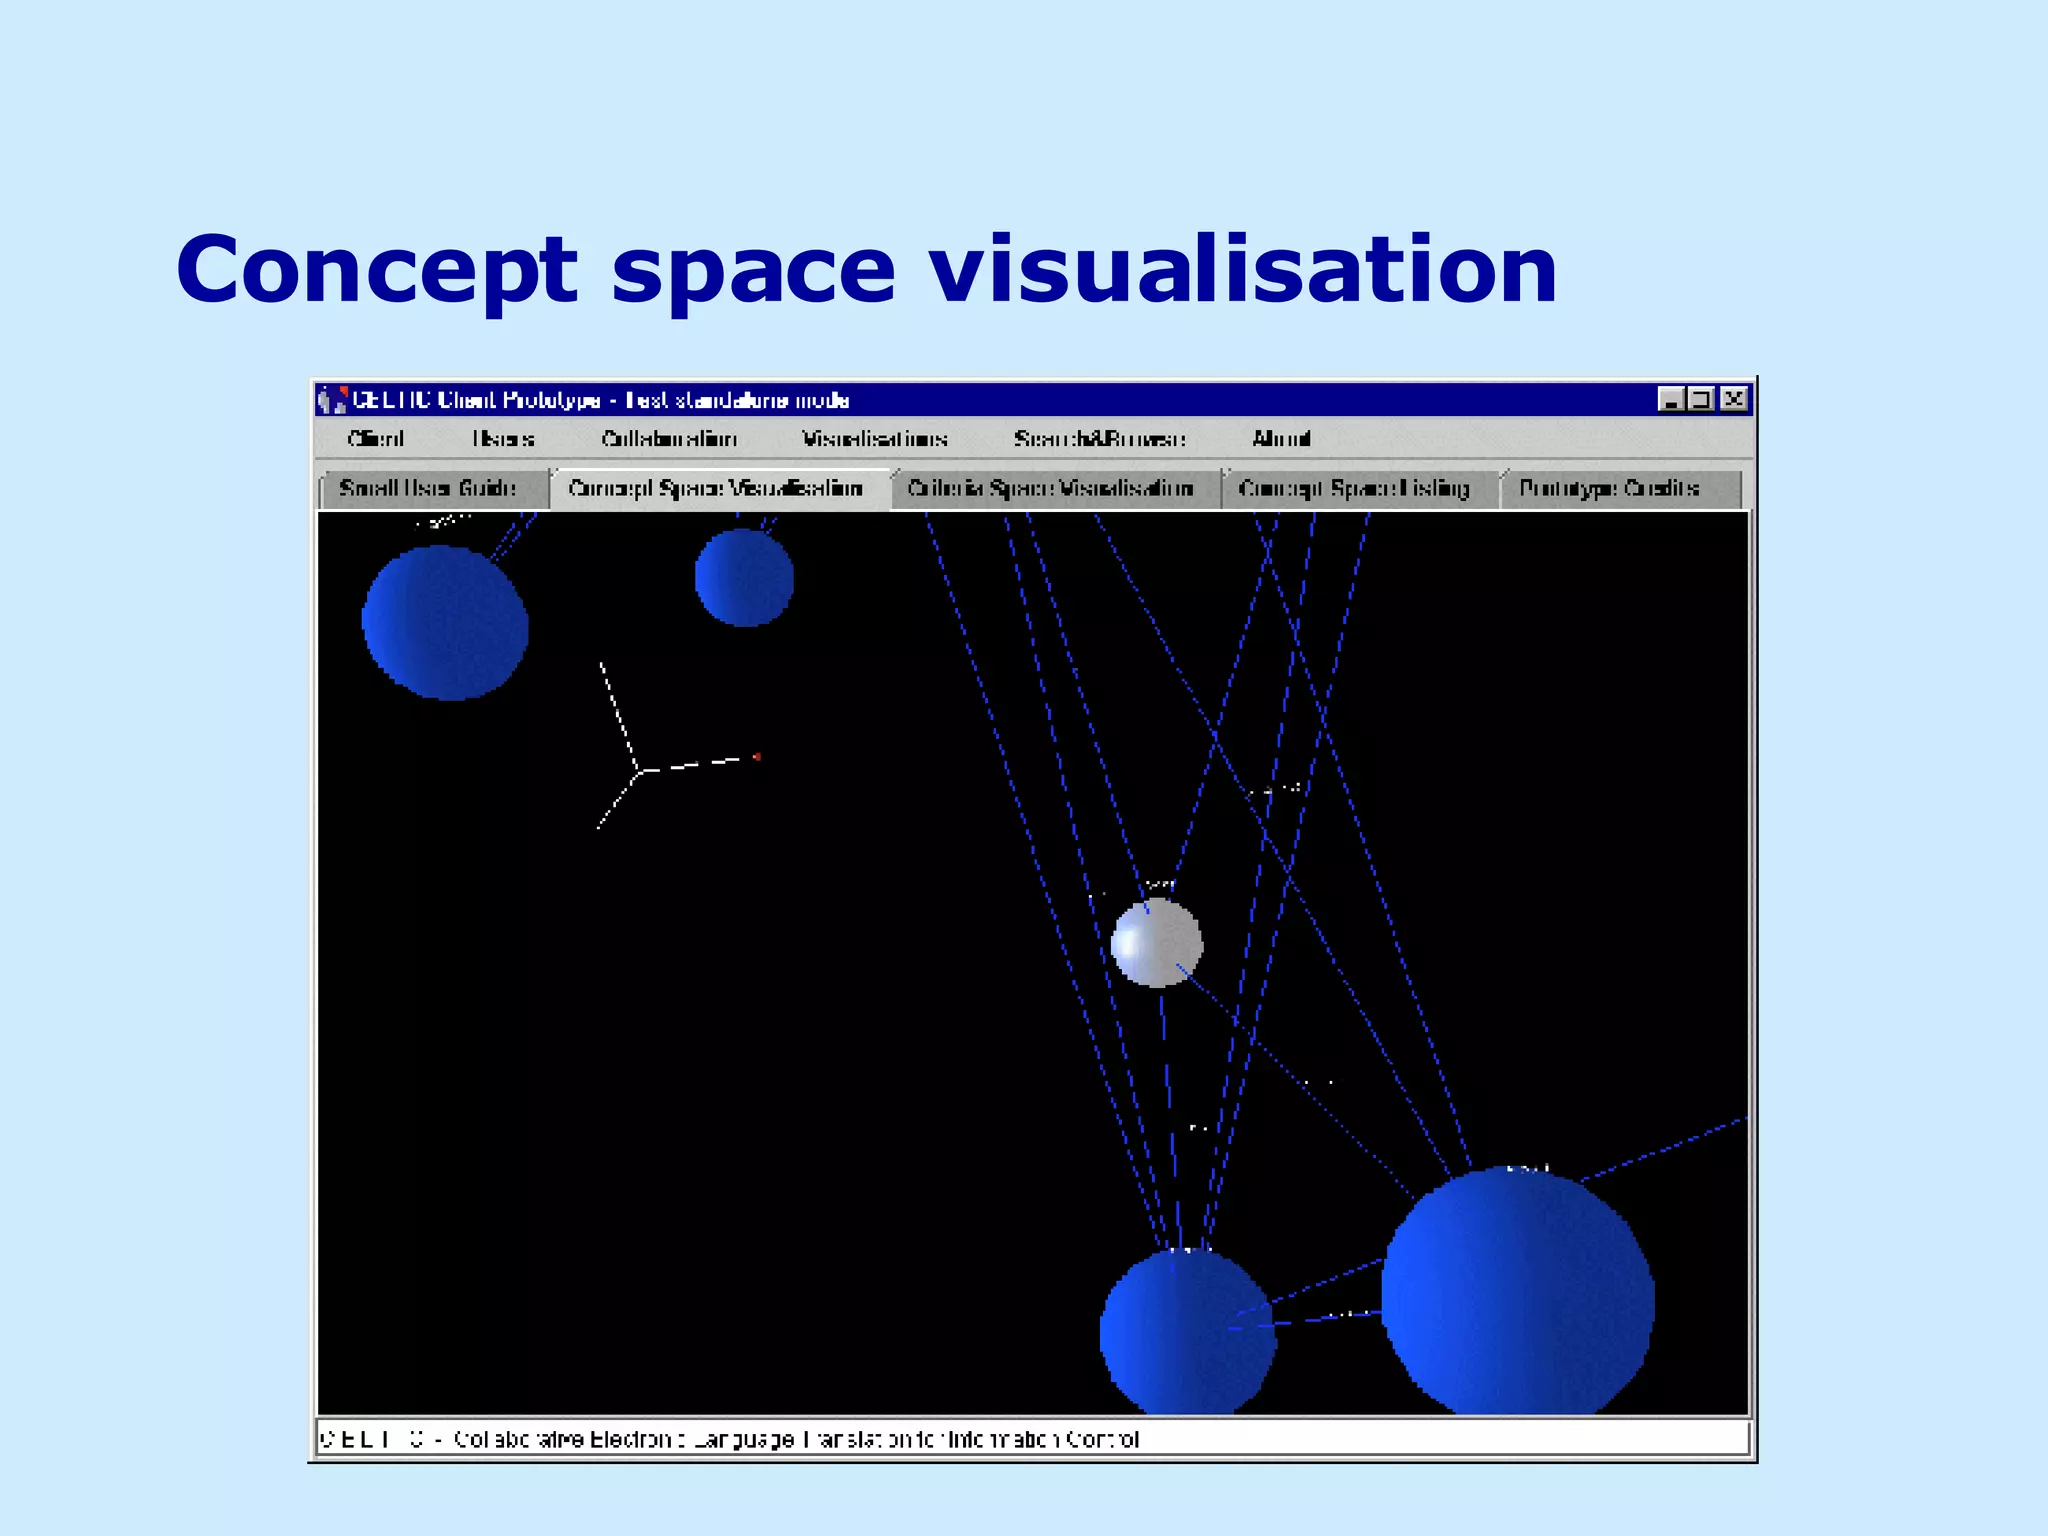
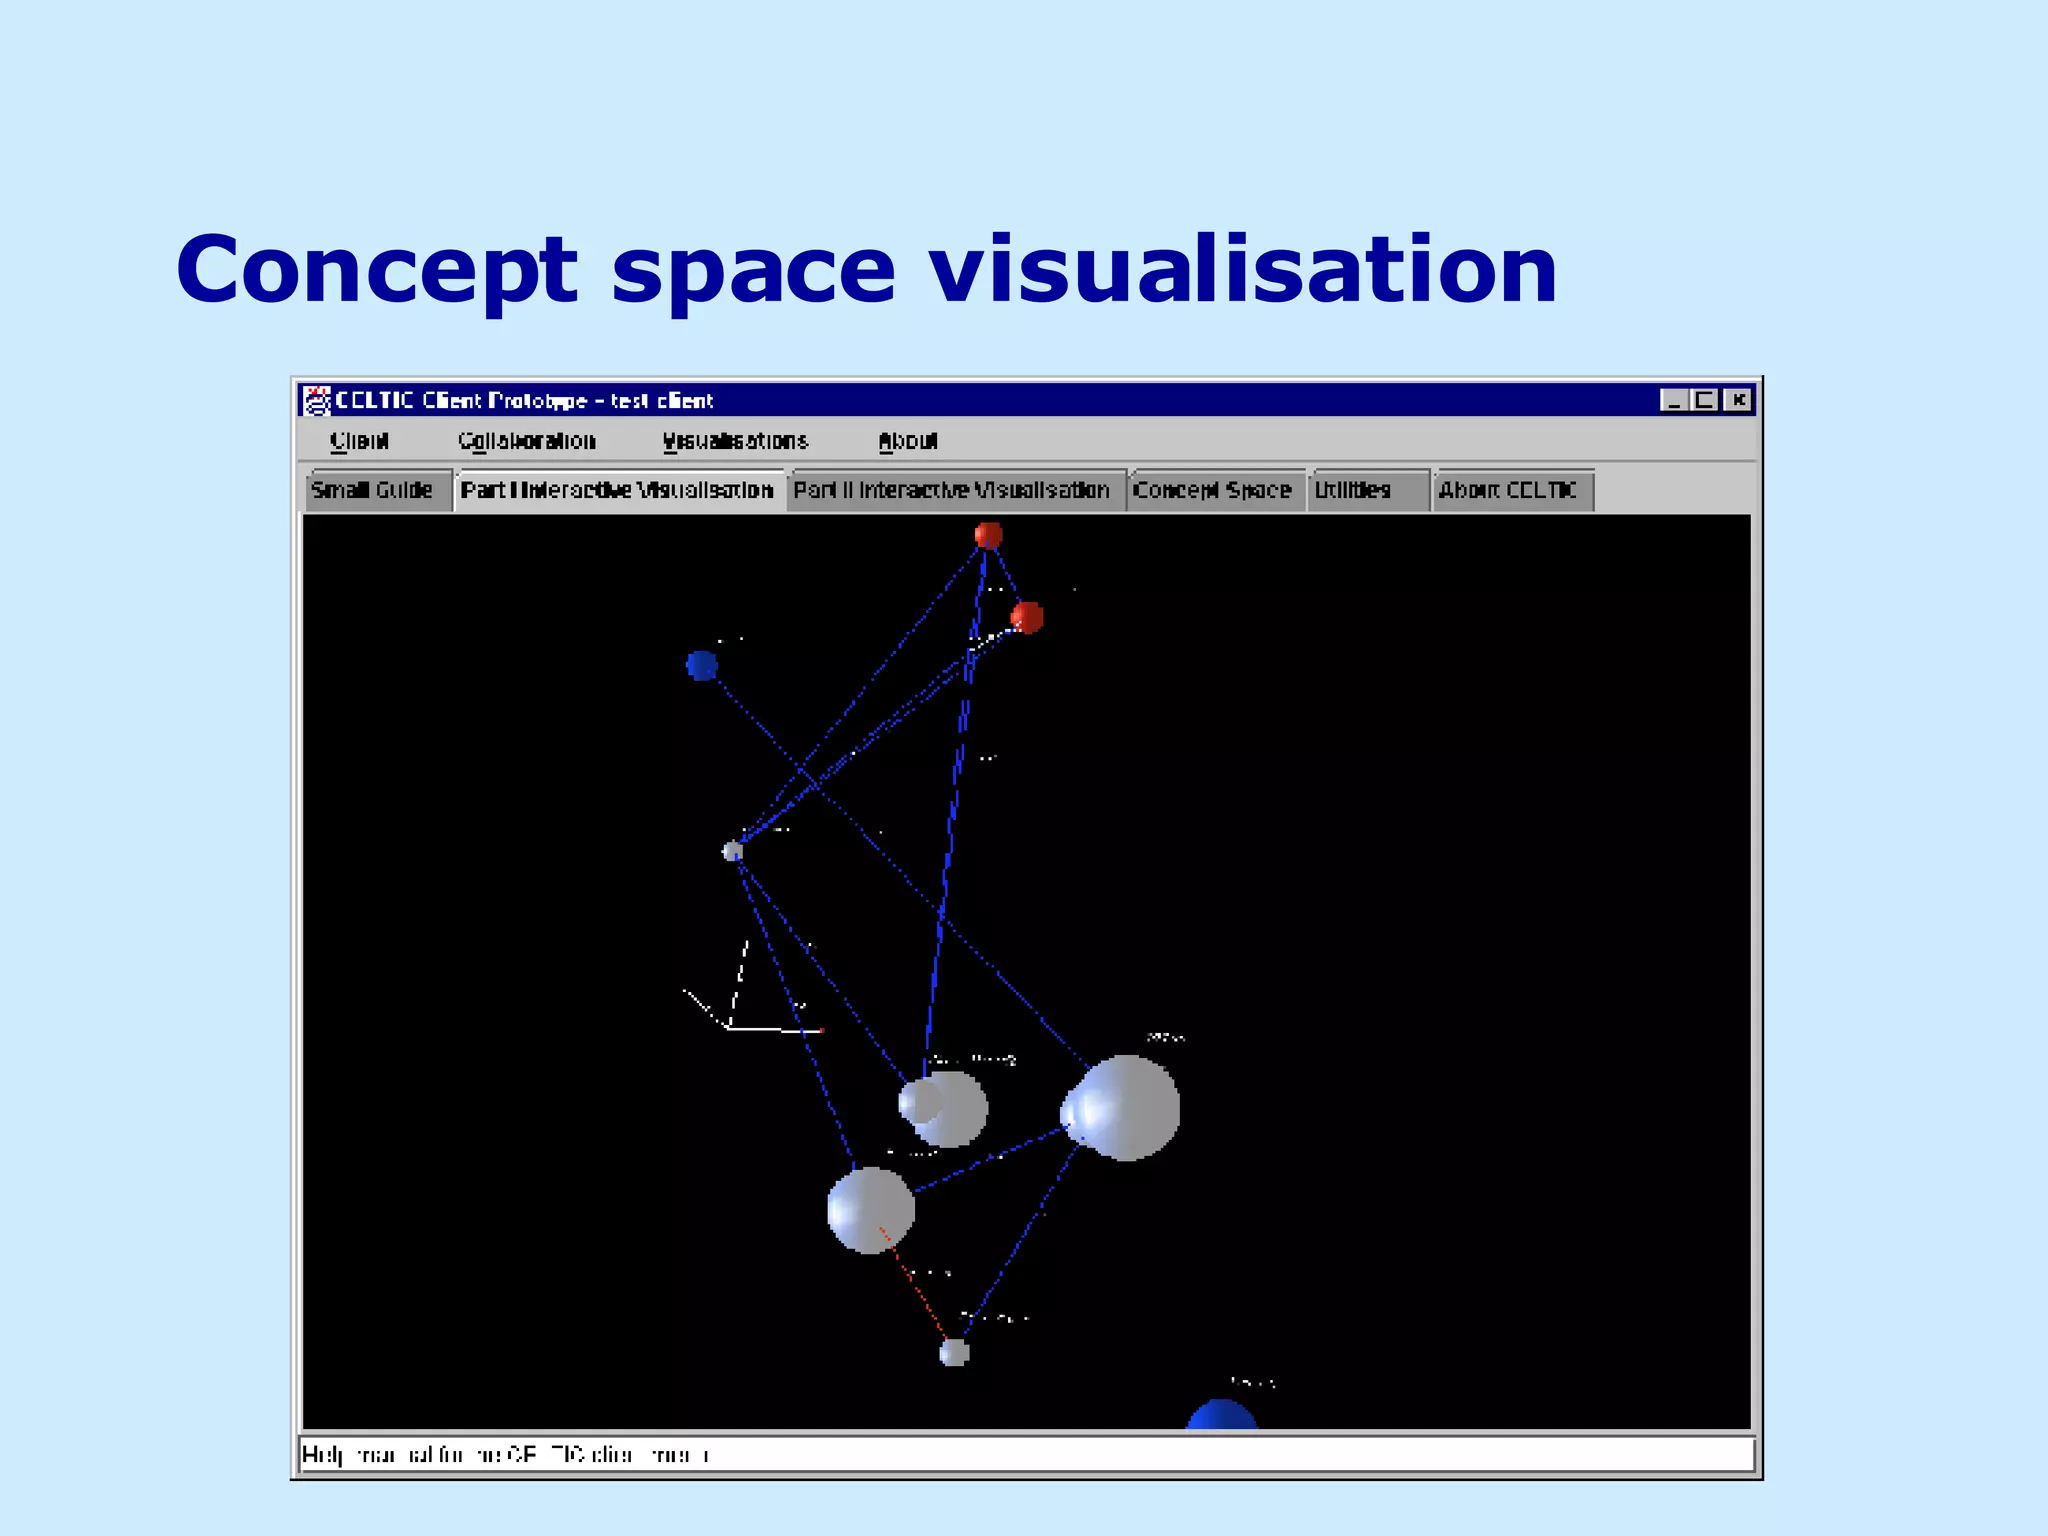
![Visualisation (why?) 3D visualisation can offer a more convenient and natural way for people to interact with information spaces (as distinct from environments that are naturally 3D) [ Tufte ] and [ Benedikt ]. to date, there is not much evidence to support it, other than in cases where the information has a natural spatial component [ Hubbold et al. ] many problems still exist, as user sense of position that can be lost if the layout changes [ Ingram and Benford ]](https://image.slidesharecdn.com/iceis-04-1193499331731230-3/75/Using-visuals-to-convey-information-12-2048.jpg)
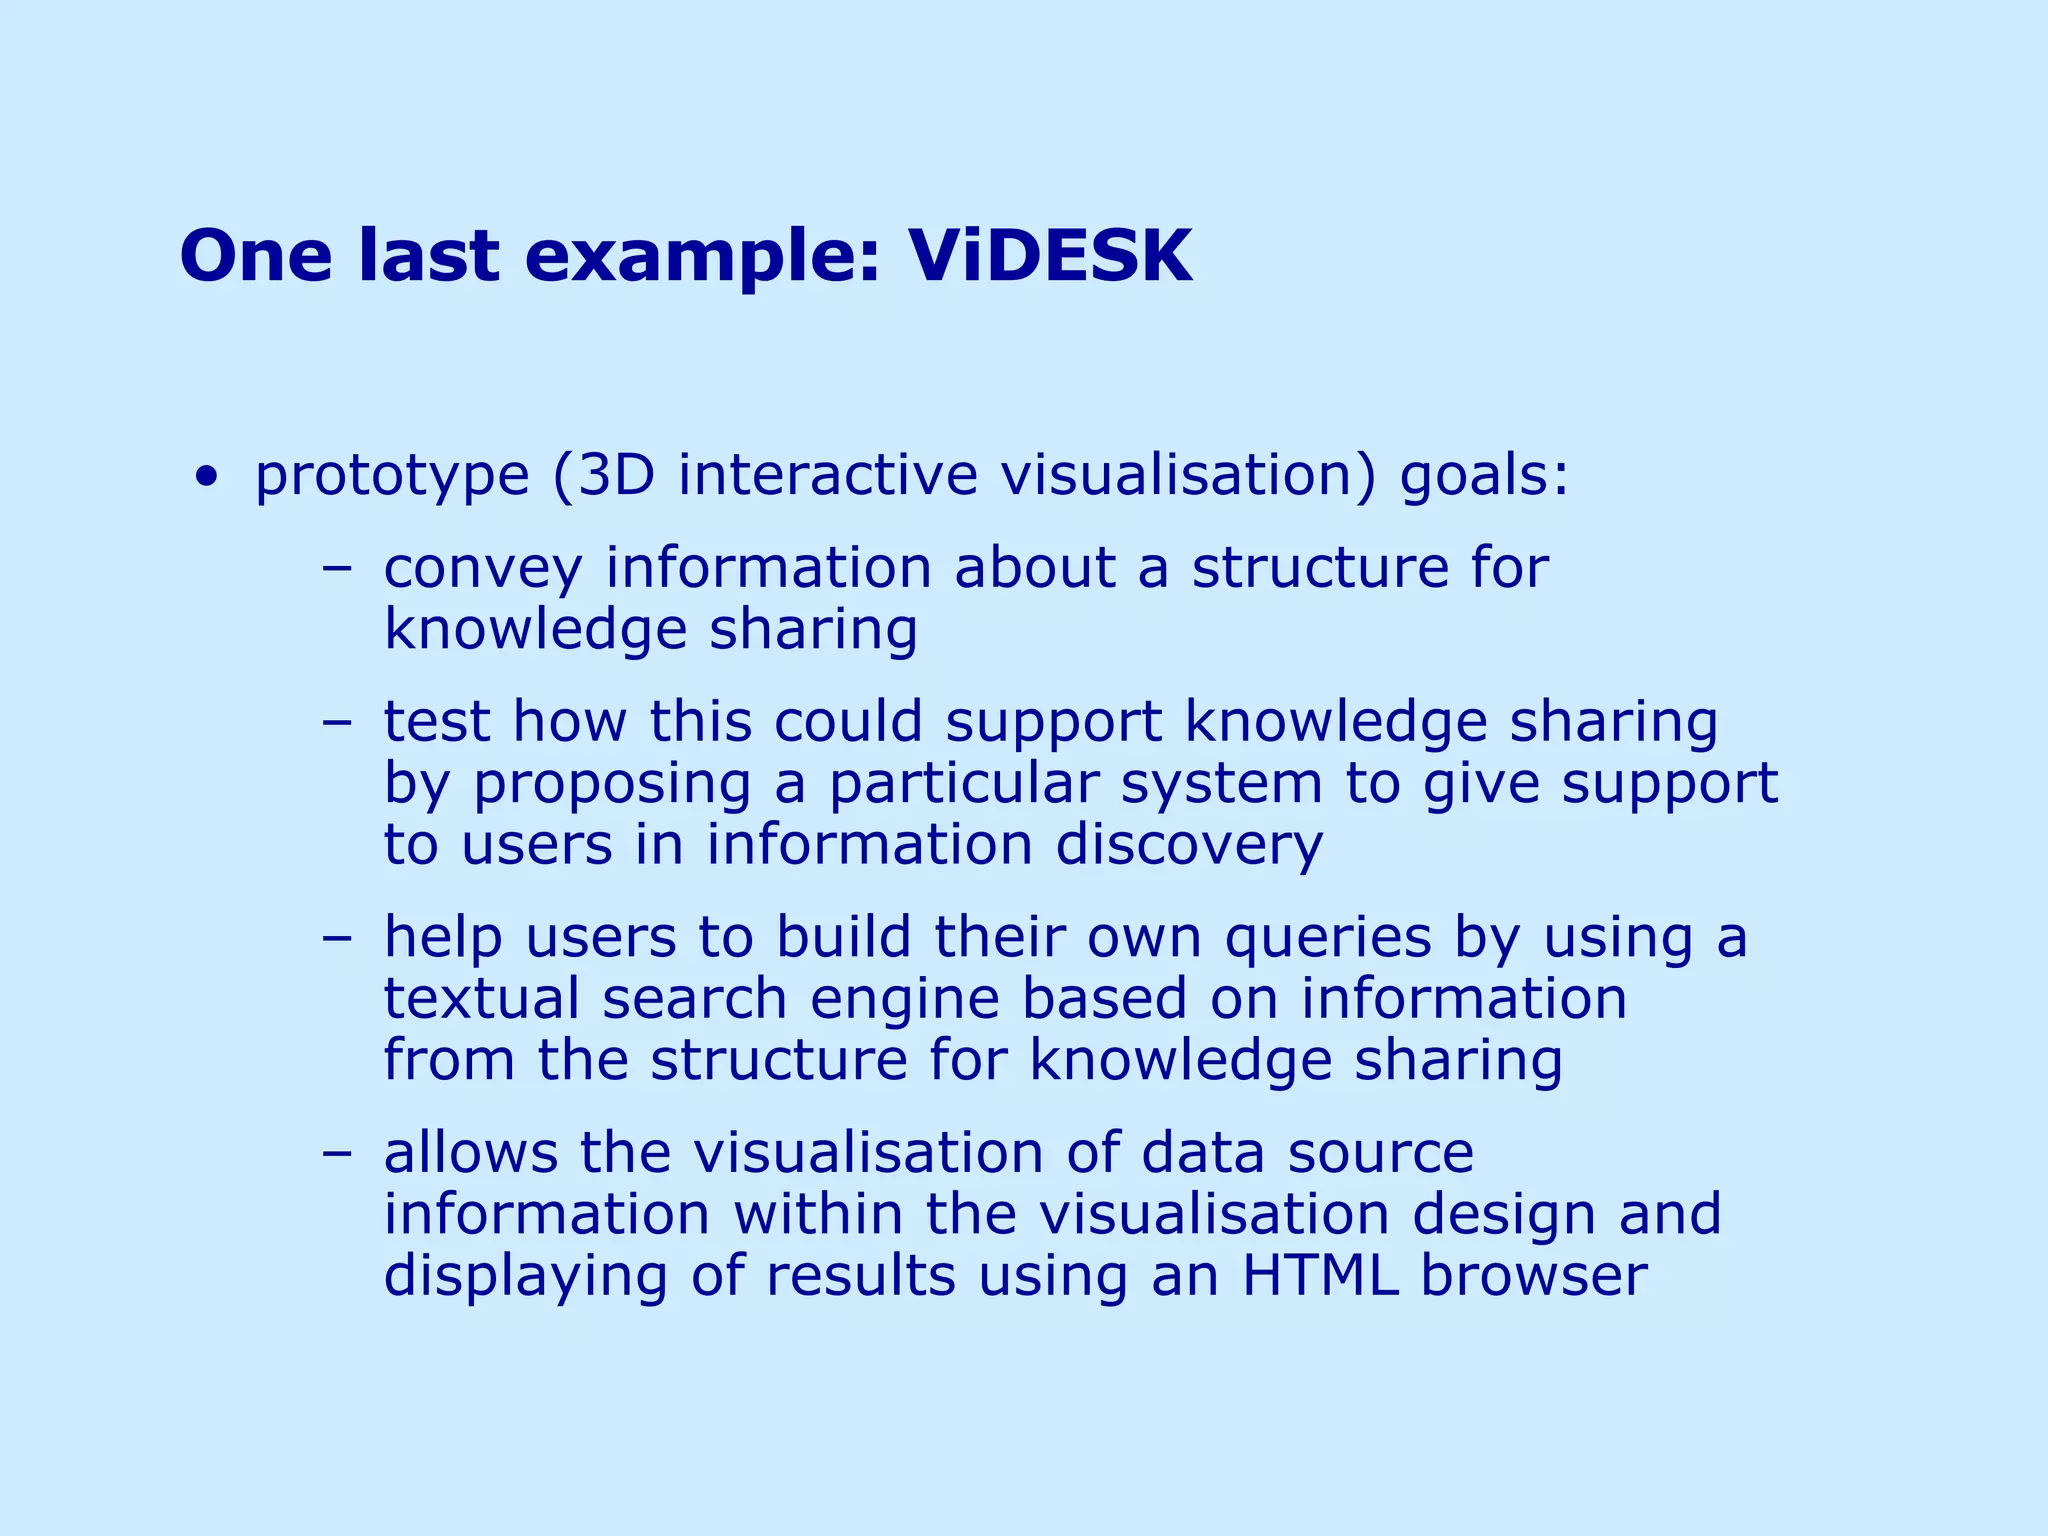
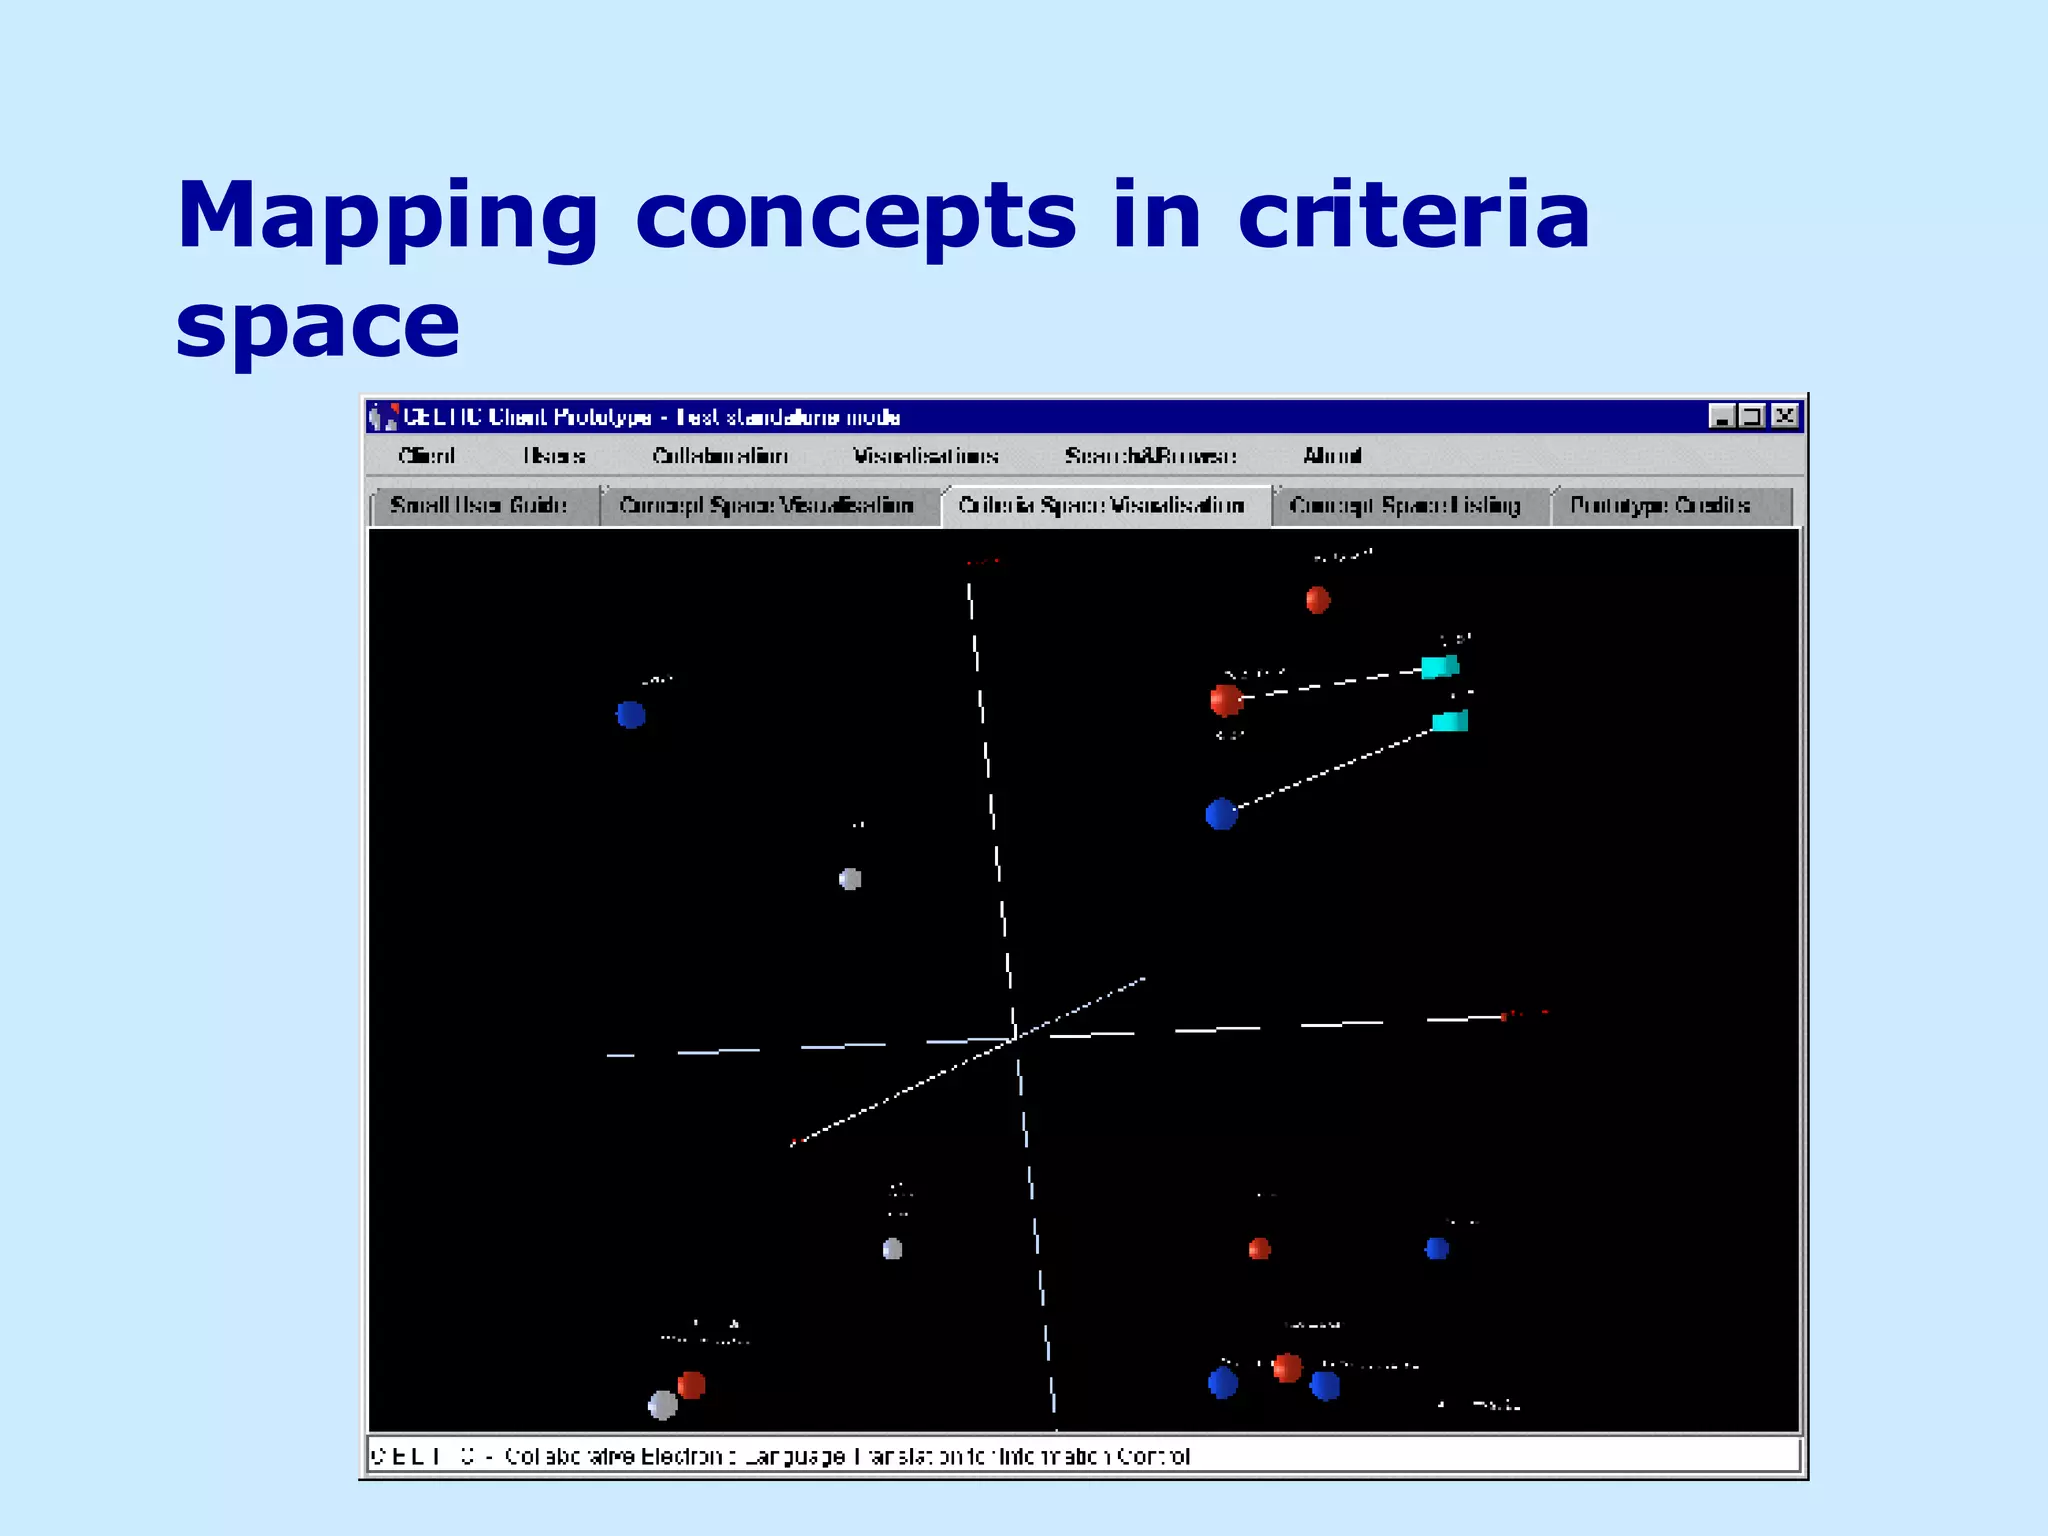
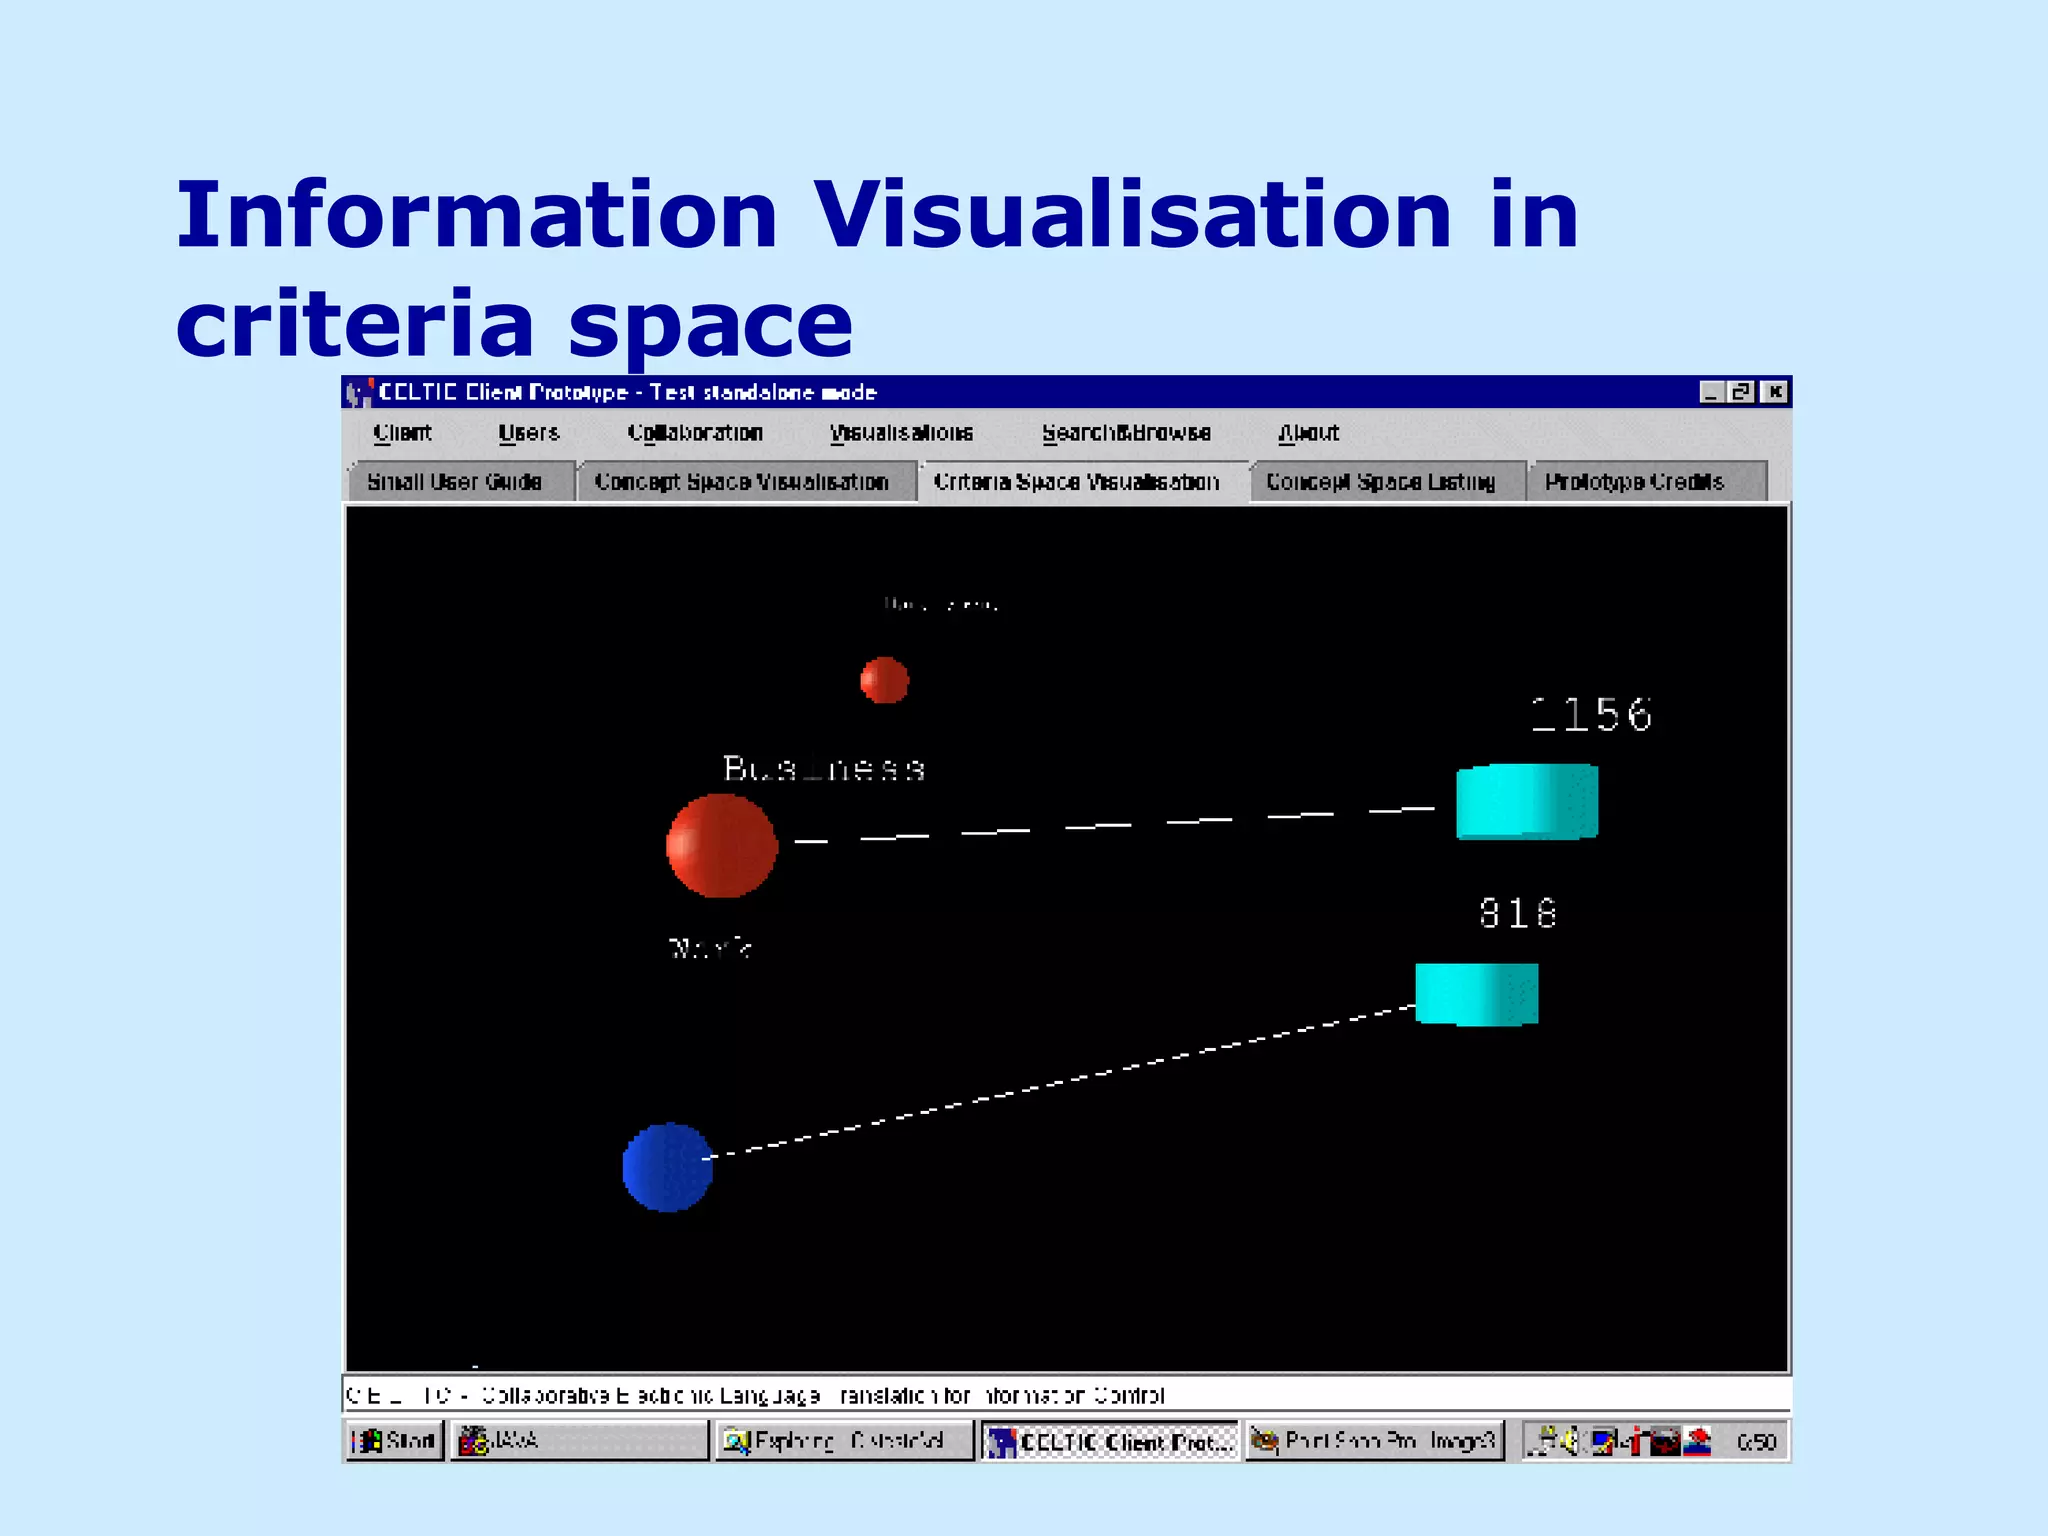
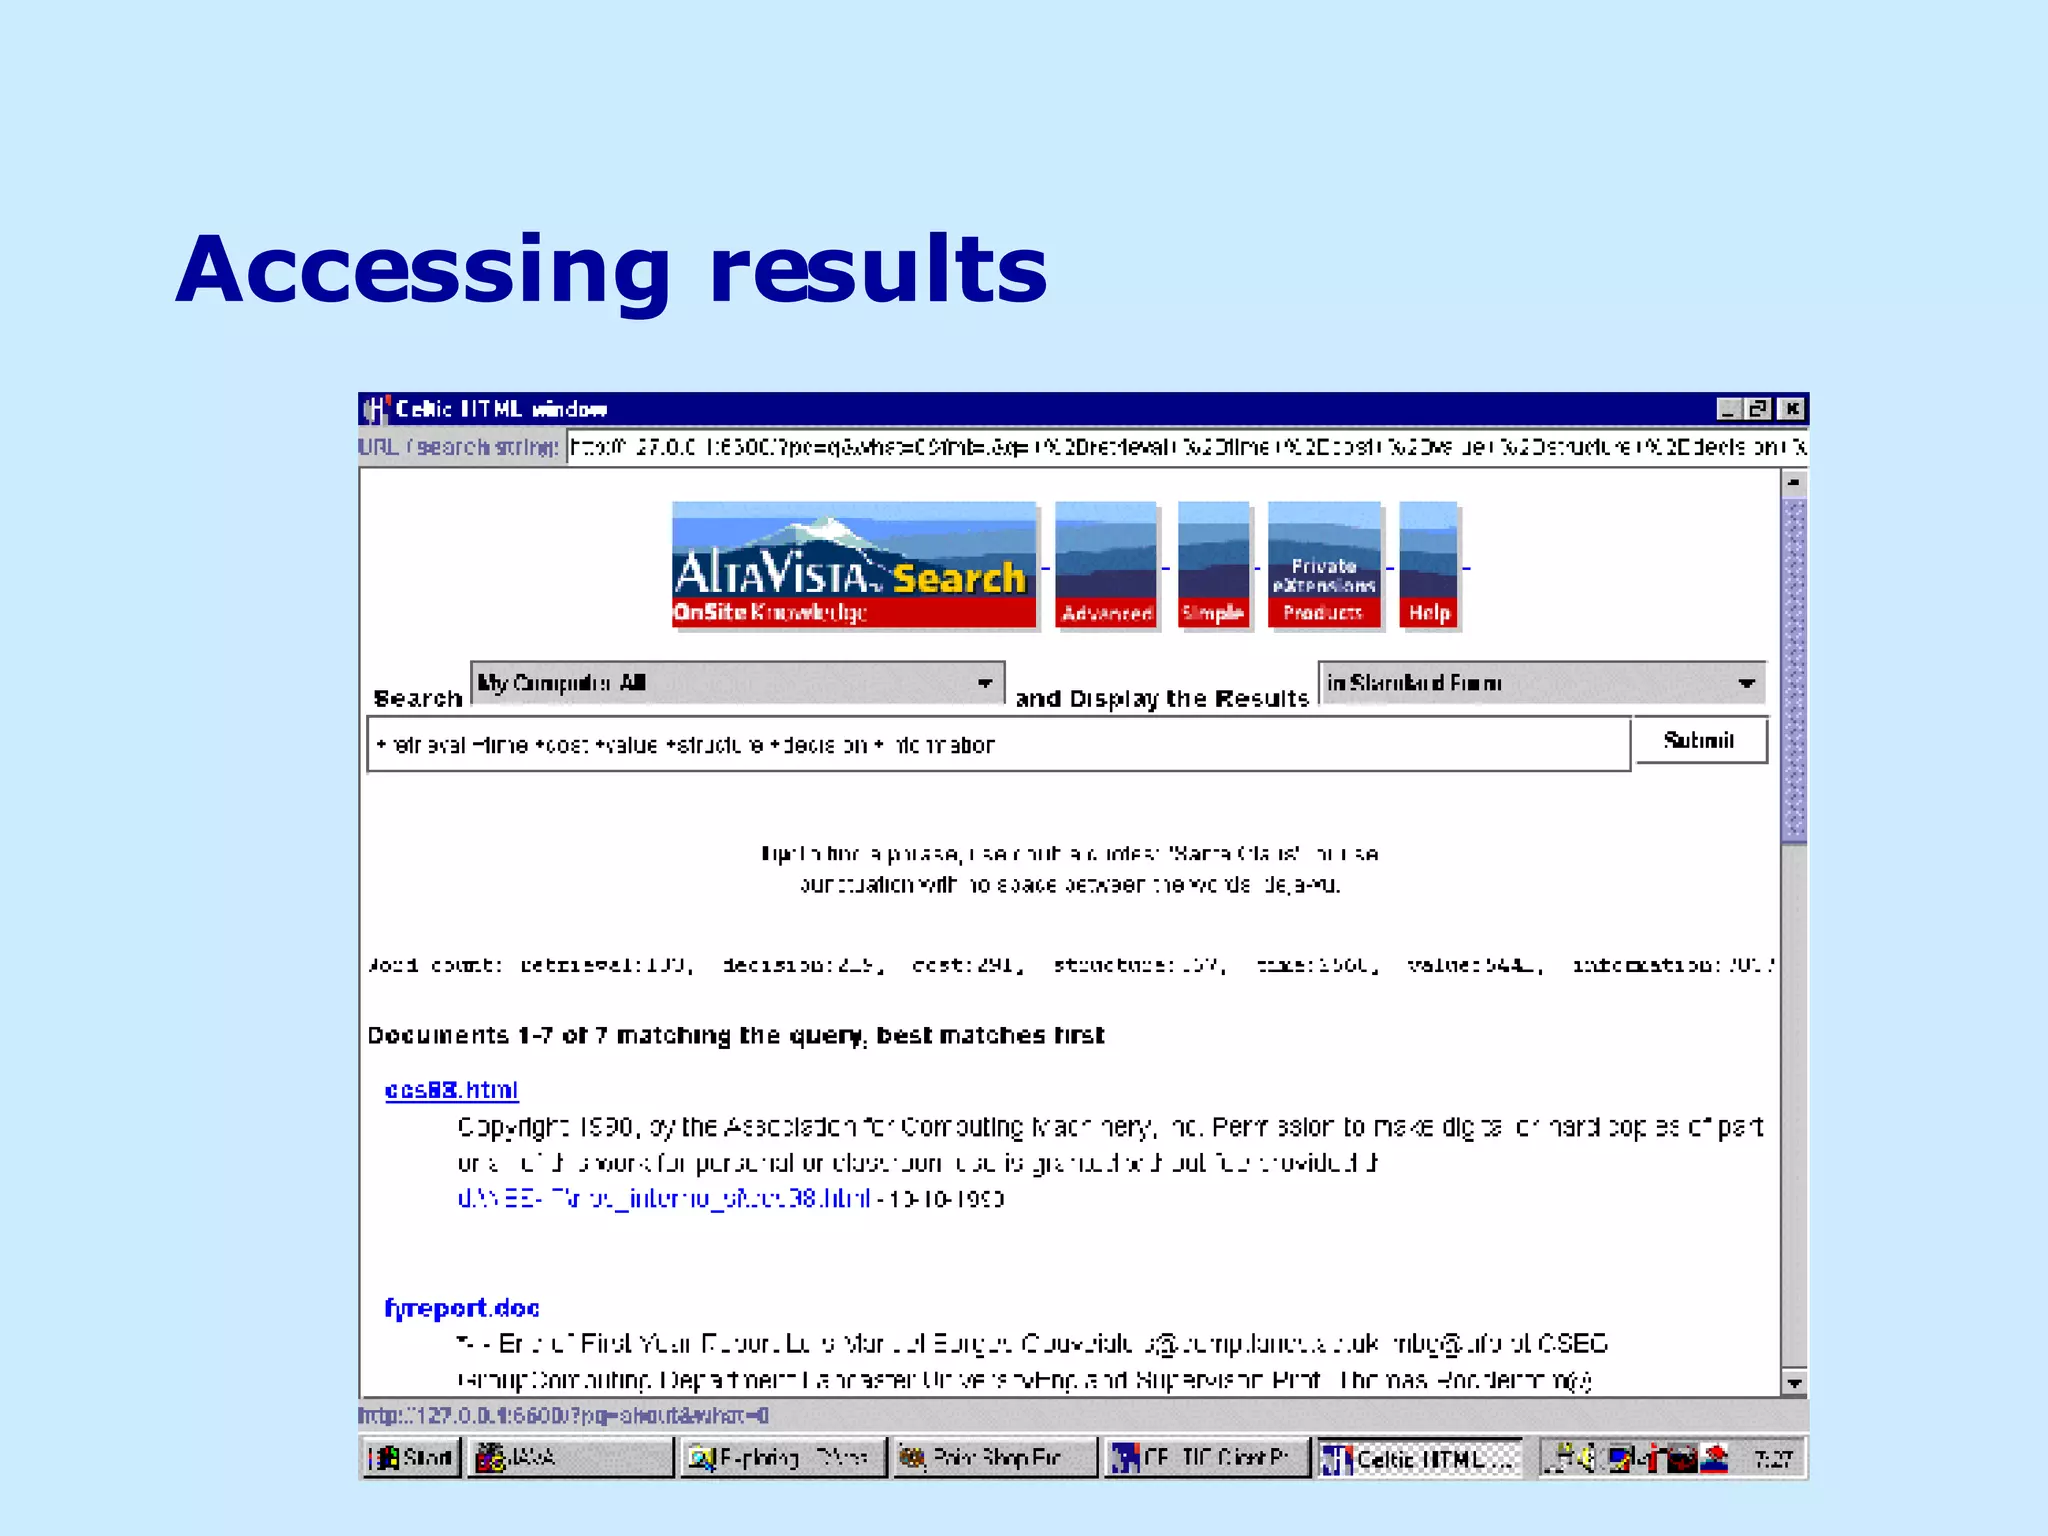
![Visualisation (task approach) an application for testing the visualisation design: information discovery: support user efforts to find relevant information within a given knowledge domain [ Li-Jen and Gaines, 1998 ] setting up a context, a query generation tool and an Information Visualisation [ Card et al., 1999 ]; providing context and information about a particular data source for analysis and comparison. based on a given context shared as a 3D interactive visualisation, users can be assisted to retrieve information and analyse it ― information discovery [ Baeza-Yates and Ribeiro-Neto, 1990 ]](https://image.slidesharecdn.com/iceis-04-1193499331731230-3/75/Using-visuals-to-convey-information-13-2048.jpg)

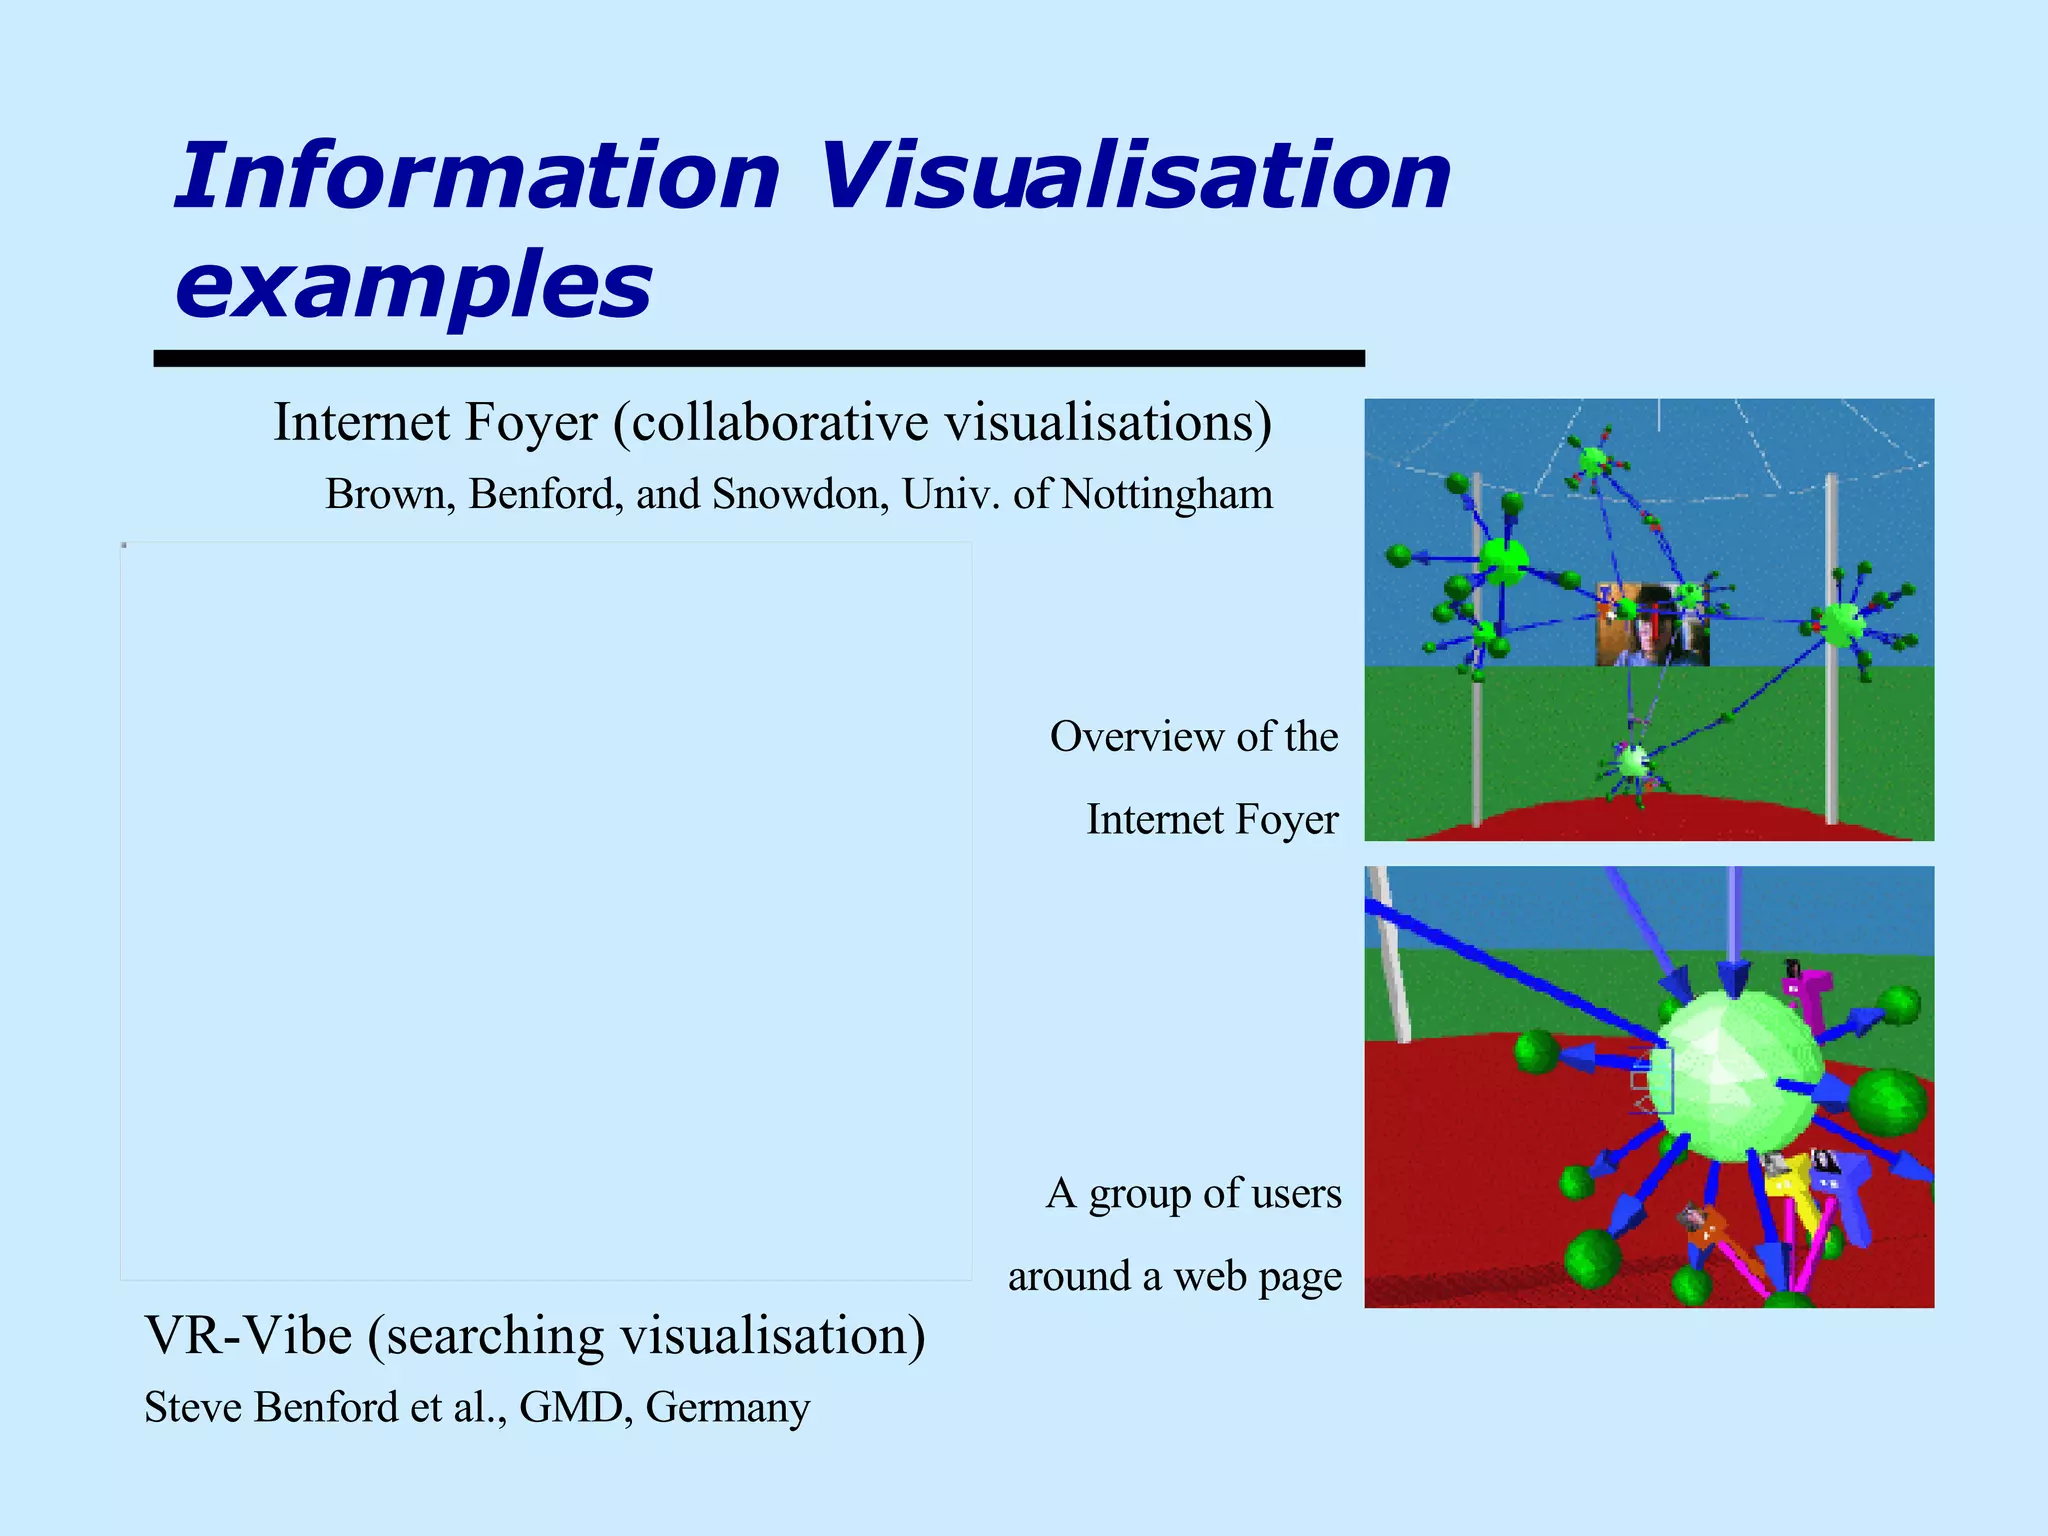
The document discusses using visualizations to convey information more effectively than text alone. It provides examples of different visualization techniques, such as semantic maps, virtual reality, ubiquitous computing, and 3D interactive visualizations. The author argues that visualizations can improve interfaces by leveraging human perception and more clearly conveying information to support tasks like knowledge sharing and information discovery.


