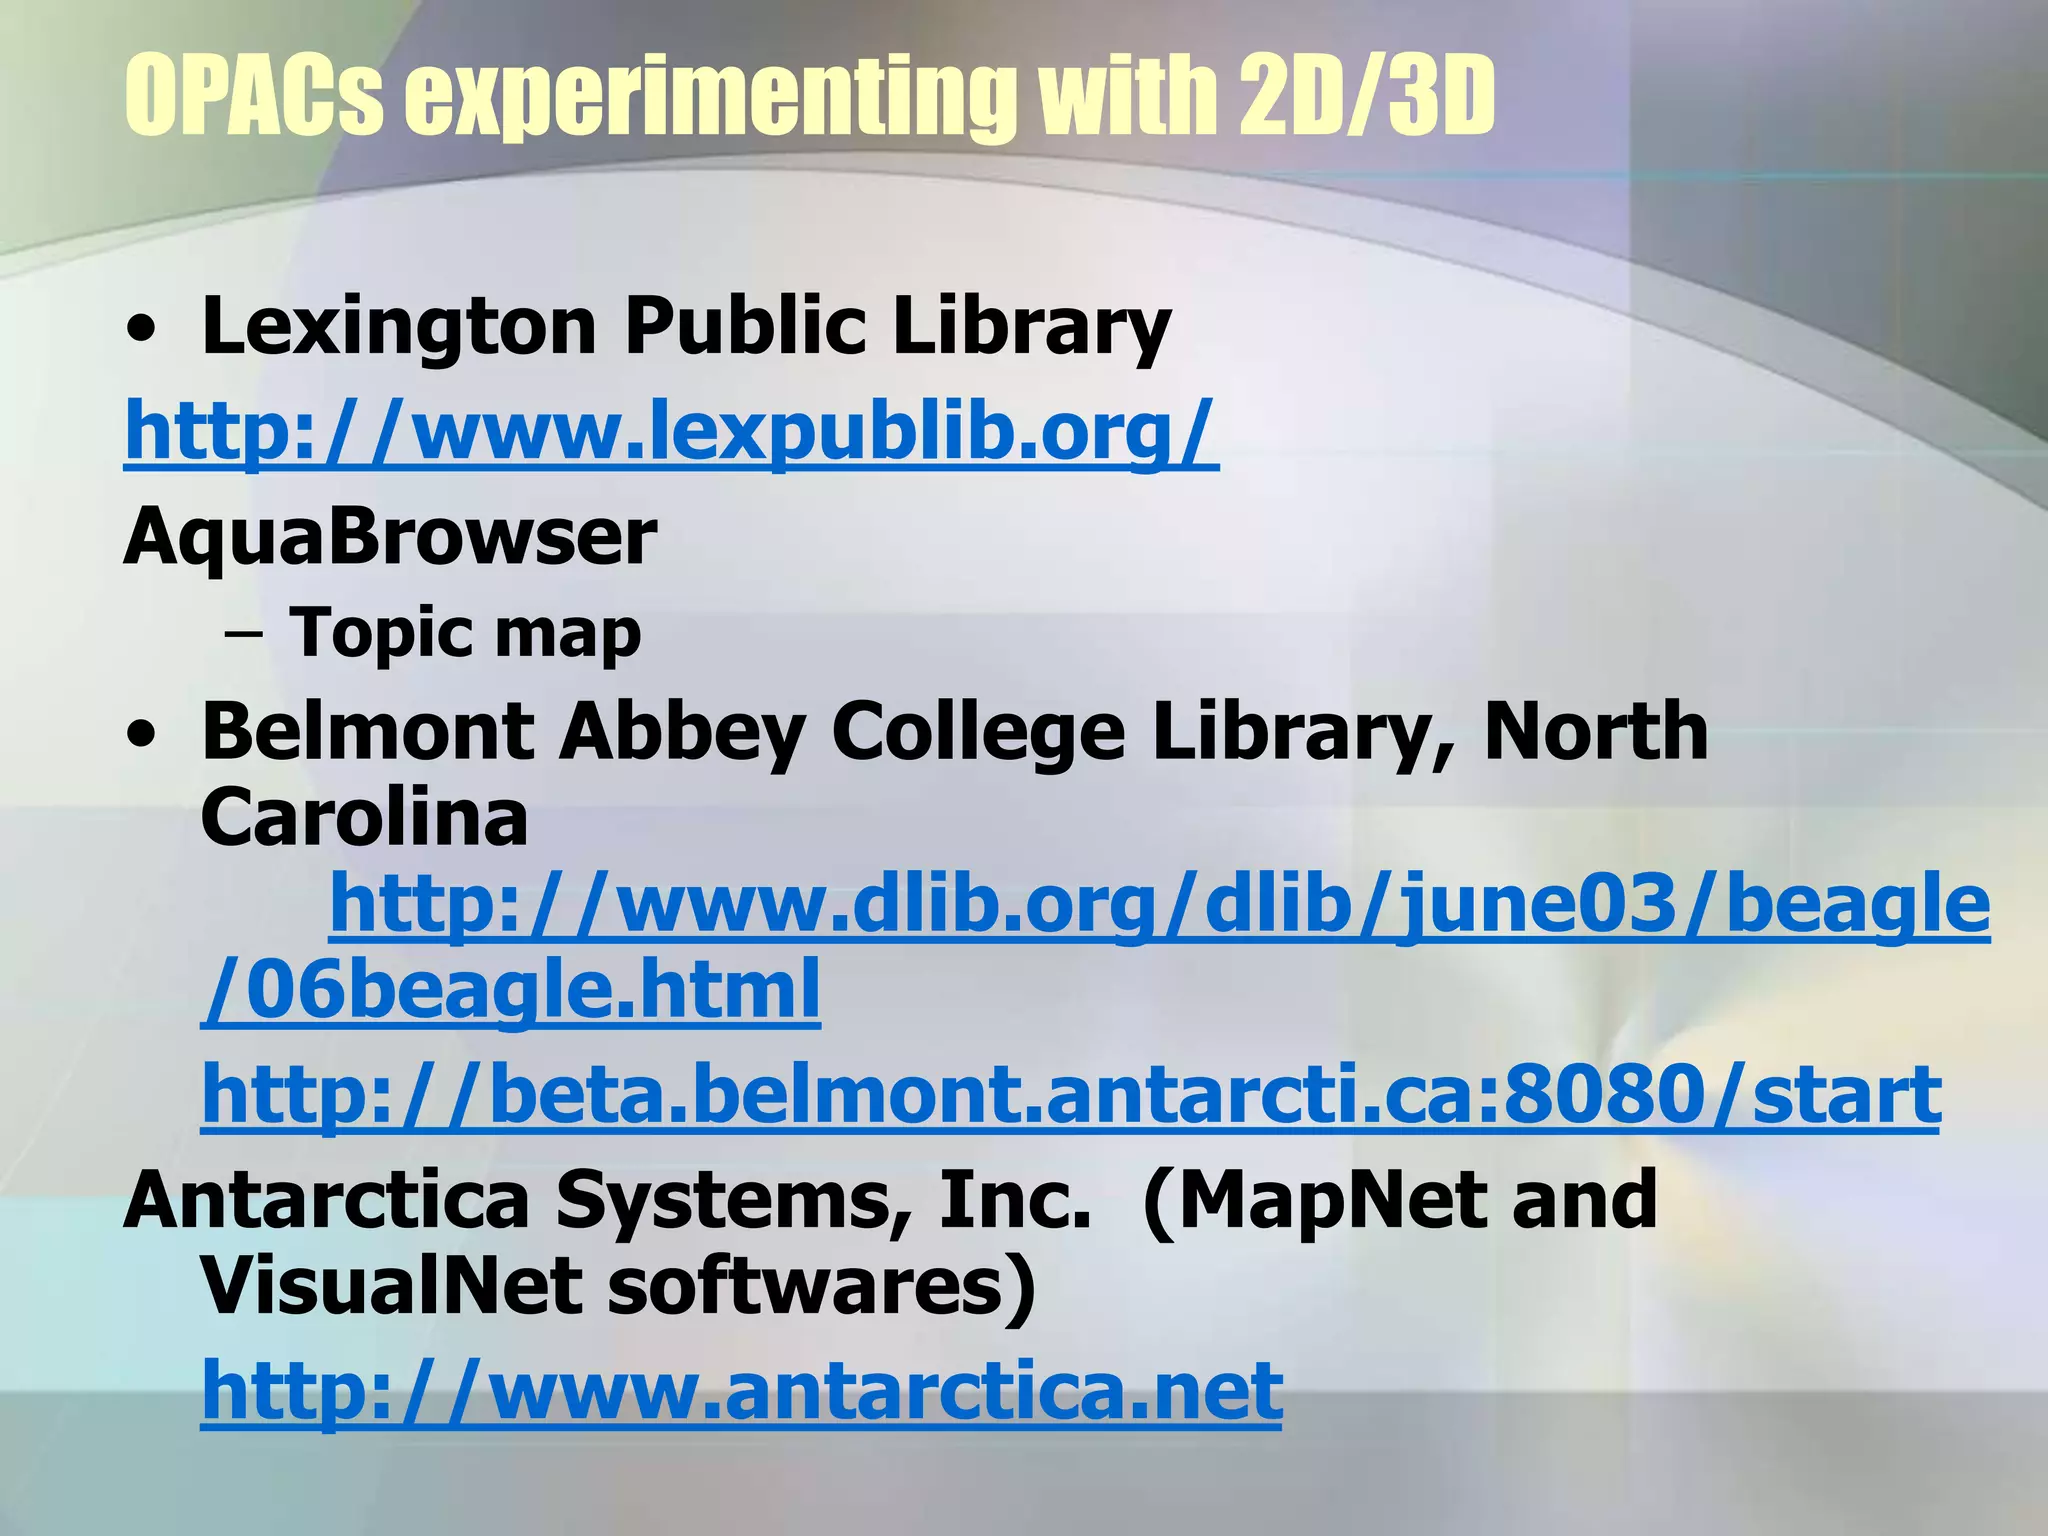
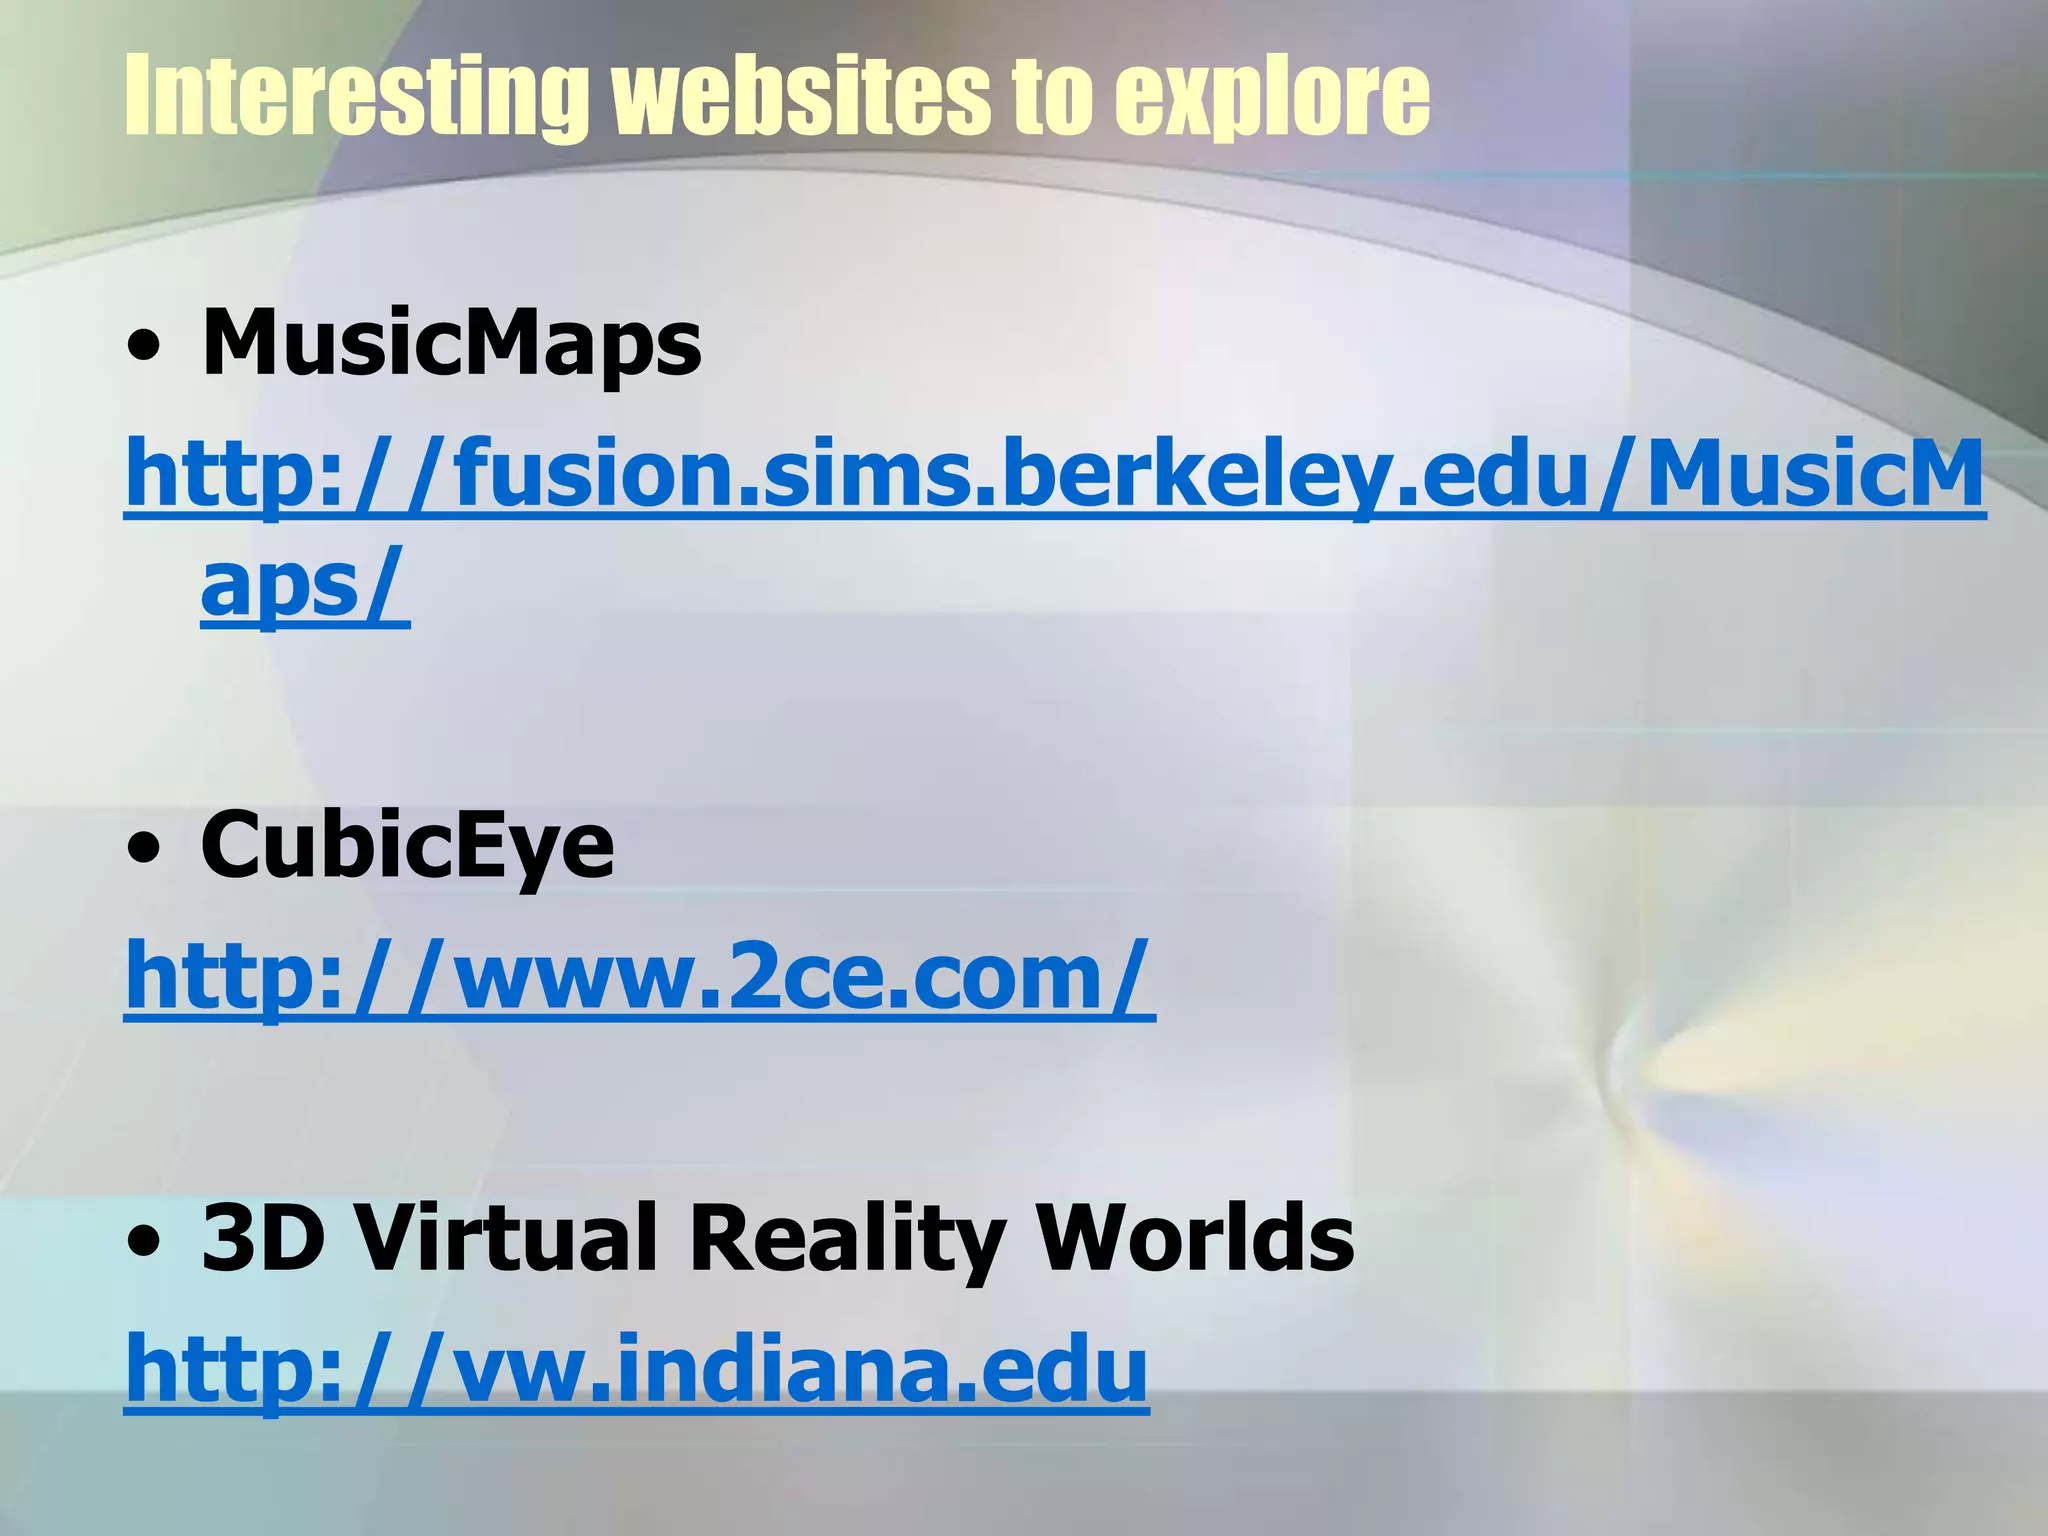
3D Information Visualization:
An Introduction and Practical Applications
Brad Eden, Ph.D.
Head, Web and Digitization
Services
University of Nevada, Las Vegas
Libraries
beden@ccmail.nevada.edu
What is Information Visualization?
• “The use of computer-supported,
interactive, visual representations of
abstract data to amplify cognition.”
From Readings in Information
Visualization: Using Vision to Think.
Edited by S. Card, J. Mackinlay, and B.
Shneiderman. San Francisco: Morgan
Kaufmann, 1999. p. 6
Other definitions from the literature…
• “The process of analyzing and
transforming nonspatial data into an
effective visual form”
• “A highly efficient way for the mind to
directly perceive data and discover
knowledge and insight from it”
• “The visual appearance of data objects
and their relationships”
• “The transformation of abstract data to
a visual representation, which is rapidly
understood by the user”
Why is it important?
• Human beings are tremendously influenced
by sensory perceptions…
• The way that we learn, grow, understand,
and adapt is based on our ability to view,
perceive, and conceptualize thoughts and
ideas…
• The power to visualize and graphically
represent results, ideas, solutions, and
problems in multiple dimensions, as well as
to manipulate data and virtually collaborate
with others, is the next big revolution in
technology.
“Tell me and I’ll forget…
Show me and I may remember…
Involve me and I’ll understand.”
Ancient Chinese proverb
Who is doing it right now?
• Your users everyday
– Students
• Virtual collaborative gaming
• Collaborative spaces on the Internet
• On their Gameboys and home entertainment systems
– Faculty
• In the sciences (David Rumsey Map Collection at
http://www.davidrumsey.com/GIS/3d.htm)
• In medicine (Visible Human Project at
http://www.nlm.nih.gov/research/visible/visible_huma
n.html)
• In history
(http://www.visionarywebsites.com/portfolio_3d.htm#
2)
Areas of study already established in visualization…
• Data visualization
• Geographic visualization
• Scientific visualization
• Software visualization
Dimensional types of information visualization
• Temporal
• One-dimensional (1D)
• Two-dimensional (2D)
• Three-dimensional (3D)
• Multi-dimensional (MultiD)
• Tree
• Network
• Workspace
See Olive: On-line Library of Information
Visualization Environments at
http://www.otal.umd.edu/Olive/
3D information visualization presentation techniques
• Benediktine space
• Cityscapes
• Cluster maps
• Concept mapping
• Fish-eye views
• Graphs
• Landscapes
• Networks
• Perspective walls
• Rooms
• Spheres
• Topic maps
• Trees
Programming languages for 3D
• Virtual Reality Modeling Language
(VRML)/eXtensible 3D (X3D)
http://www.web3d.org/
• Scalable Vector Graphics (SVG)
http://www.w3.org/TR/SVG/
• Many other ones, by gamers and
techies
An Atlas of Cyberspaces
http://www.cybergeography.org/atlas/atlas.html
Provides examples of graphic
representations of cyberspaces like the
Internet, the World Wide Web, and
other digital environments. Divided
into topics such as historical,
geographical, MUDS and virtual worlds,
weather maps, conceptual, surfmaps,
website maps, artistic, cables and
satellites, topology, census, etc.
Resources
The Geography of Cyberspaces Directory
http://www.cybergeography.org/vis_infospaces.html
Information Visualization website
http://iv.homeunix.org/
OPACs experimenting with 2D/3D
• Lexington Public Library
http://www.lexpublib.org/
AquaBrowser
– Topic map
• Belmont Abbey College Library, North
Carolina
http://www.dlib.org/dlib/june03/beagle
/06beagle.html
http://beta.belmont.antarcti.ca:8080/start
Antarctica Systems, Inc. (MapNet and
VisualNet softwares)
http://www.antarctica.net
Stanford Grokker
http://www-
sul.stanford.edu/about_sulair/special_
projects/stanford_grokker.html
Available only to Stanford faculty,
students, and staff
Interesting websites to explore
• MusicMaps
http://fusion.sims.berkeley.edu/MusicM
aps/
• CubicEye
http://www.2ce.com/
• 3D Virtual Reality Worlds
http://vw.indiana.edu
More interesting websites
• 3D Insects
http://www.ento.vt.edu/~sharov/3d/3d
insect.html
• For more information, see 3D
Information Visualization Techniques:
2D and 3D Information Visualization
Resources, Applications, and Future
(Library Technology Report, Jan./Feb.
2005)
Innovative Projects in the Humanities
• Library Technology Report, July/August 2005
• 10 x 10: 100 Words and Pictures That Define the
Time
http://www.tenbyten.org/10x10.html
• Theban Mapping Project
http://www.thebanmappingproject.com/
• Virtual Vaudeville
http://www.virtualvaudeville.com/
• The Lost Museum
http://www.lostmuseum.cuny.edu/intro.html
Companies and software
ActiveWorlds ($6.95 per month)
http://www.activeworlds.com/#
Grokker (free 30-day trial)
http://www.groxis.com/service/grok
VisualNet
http://www.antarctica.net/products/visualnet.shtml
Pacific Northwest National Laboratory (PNNL)
http://www.pnl.gov/infoviz/
Galaxies, ThemeView™, Starlight, OmniViz Pro™, and IN-SPIRE™
Anacubis (free 10-day trial)
http://www.anacubis.com
Aquabrowser
http://www.medialab.nl/
Inxight
http://www.inxight.com/about/
SmartDiscovery™, VizServer™, Categorizer™, LinguistX®, Star Tree™, Summarizer™,
Table Lens®, and Thing Finder™
Vivisimo
http://vivisimo.com/
http://clusty.com/
Visual Thesaurus and ThinkMap (free 5-click demo)
http://www.visualthesaurus.com
http://www.thinkmap.com
xrefer Research Mapper (free 30-day trial)
http://www.xrefer.com/research/
See also Judy Luther and Maureen Kelly, and
Donald Beagle. “Visualize This.” Library
Journal. March 1, 2005, p. 34-37.
Bernard Frischer. “The Ultimate Internet Café:
Reflections of a Practicing Digital Humanist
about Designing a Future for the Research
Library in the Digital Age.” Library As Place:
Rethinking Roles, Rethinking Space. CLIR,
February 2005, p. 41-81.
http://www.clir.org/pubs/reports/pub129/pub1
29.pdf
Bernard Frischer. “From CVR to CVRO: The Past,
Present, and Future of Cultural Virtual Reality.”
http://www.cvrlab.org/research/images/CVR%
20to%20CVRO.pdf
From CVR to CVRO:
If the ten-year rule of thumb holds
true, personal computer enthusiasts by
the millions a decade from now will be
interacting directly with virtual worlds
through their desktop reality engines.
Howard Rheingold (1991)
Also from CVR to CVRO:
All men by nature desire to know. An
indication of this is the delight we take in our
senses; for even apart from their usefulness
they are loved for themselves; and above all
others the sense of sight. For not only with a
view to action, but even when we are not going
to do anything, we prefer seeing (one might
say) to everything else. The reason is that this,
most of all the senses, makes us know and
brings to light many differences between
things.
Aristotle, Metaphysics 980a (ca. 330 B.C.)
Questions?
beden@ccmail.nevada.edu

30_Eden.ppt

  • 1.
    3D Information Visualization: AnIntroduction and Practical Applications Brad Eden, Ph.D. Head, Web and Digitization Services University of Nevada, Las Vegas Libraries beden@ccmail.nevada.edu
  • 2.
    What is InformationVisualization? • “The use of computer-supported, interactive, visual representations of abstract data to amplify cognition.” From Readings in Information Visualization: Using Vision to Think. Edited by S. Card, J. Mackinlay, and B. Shneiderman. San Francisco: Morgan Kaufmann, 1999. p. 6
  • 3.
    Other definitions fromthe literature… • “The process of analyzing and transforming nonspatial data into an effective visual form” • “A highly efficient way for the mind to directly perceive data and discover knowledge and insight from it” • “The visual appearance of data objects and their relationships” • “The transformation of abstract data to a visual representation, which is rapidly understood by the user”
  • 4.
    Why is itimportant? • Human beings are tremendously influenced by sensory perceptions… • The way that we learn, grow, understand, and adapt is based on our ability to view, perceive, and conceptualize thoughts and ideas… • The power to visualize and graphically represent results, ideas, solutions, and problems in multiple dimensions, as well as to manipulate data and virtually collaborate with others, is the next big revolution in technology.
  • 5.
    “Tell me andI’ll forget… Show me and I may remember… Involve me and I’ll understand.” Ancient Chinese proverb
  • 6.
    Who is doingit right now? • Your users everyday – Students • Virtual collaborative gaming • Collaborative spaces on the Internet • On their Gameboys and home entertainment systems – Faculty • In the sciences (David Rumsey Map Collection at http://www.davidrumsey.com/GIS/3d.htm) • In medicine (Visible Human Project at http://www.nlm.nih.gov/research/visible/visible_huma n.html) • In history (http://www.visionarywebsites.com/portfolio_3d.htm# 2)
  • 7.
    Areas of studyalready established in visualization… • Data visualization • Geographic visualization • Scientific visualization • Software visualization
  • 8.
    Dimensional types ofinformation visualization • Temporal • One-dimensional (1D) • Two-dimensional (2D) • Three-dimensional (3D) • Multi-dimensional (MultiD) • Tree • Network • Workspace See Olive: On-line Library of Information Visualization Environments at http://www.otal.umd.edu/Olive/
  • 9.
    3D information visualizationpresentation techniques • Benediktine space • Cityscapes • Cluster maps • Concept mapping • Fish-eye views • Graphs • Landscapes • Networks • Perspective walls • Rooms • Spheres • Topic maps • Trees
  • 10.
    Programming languages for3D • Virtual Reality Modeling Language (VRML)/eXtensible 3D (X3D) http://www.web3d.org/ • Scalable Vector Graphics (SVG) http://www.w3.org/TR/SVG/ • Many other ones, by gamers and techies
  • 11.
    An Atlas ofCyberspaces http://www.cybergeography.org/atlas/atlas.html Provides examples of graphic representations of cyberspaces like the Internet, the World Wide Web, and other digital environments. Divided into topics such as historical, geographical, MUDS and virtual worlds, weather maps, conceptual, surfmaps, website maps, artistic, cables and satellites, topology, census, etc.
  • 12.
    Resources The Geography ofCyberspaces Directory http://www.cybergeography.org/vis_infospaces.html Information Visualization website http://iv.homeunix.org/
  • 13.
    OPACs experimenting with2D/3D • Lexington Public Library http://www.lexpublib.org/ AquaBrowser – Topic map • Belmont Abbey College Library, North Carolina http://www.dlib.org/dlib/june03/beagle /06beagle.html http://beta.belmont.antarcti.ca:8080/start Antarctica Systems, Inc. (MapNet and VisualNet softwares) http://www.antarctica.net
  • 14.
  • 15.
    Interesting websites toexplore • MusicMaps http://fusion.sims.berkeley.edu/MusicM aps/ • CubicEye http://www.2ce.com/ • 3D Virtual Reality Worlds http://vw.indiana.edu
  • 16.
    More interesting websites •3D Insects http://www.ento.vt.edu/~sharov/3d/3d insect.html • For more information, see 3D Information Visualization Techniques: 2D and 3D Information Visualization Resources, Applications, and Future (Library Technology Report, Jan./Feb. 2005)
  • 17.
    Innovative Projects inthe Humanities • Library Technology Report, July/August 2005 • 10 x 10: 100 Words and Pictures That Define the Time http://www.tenbyten.org/10x10.html • Theban Mapping Project http://www.thebanmappingproject.com/ • Virtual Vaudeville http://www.virtualvaudeville.com/ • The Lost Museum http://www.lostmuseum.cuny.edu/intro.html
  • 18.
    Companies and software ActiveWorlds($6.95 per month) http://www.activeworlds.com/# Grokker (free 30-day trial) http://www.groxis.com/service/grok VisualNet http://www.antarctica.net/products/visualnet.shtml Pacific Northwest National Laboratory (PNNL) http://www.pnl.gov/infoviz/ Galaxies, ThemeView™, Starlight, OmniViz Pro™, and IN-SPIRE™ Anacubis (free 10-day trial) http://www.anacubis.com Aquabrowser http://www.medialab.nl/ Inxight http://www.inxight.com/about/ SmartDiscovery™, VizServer™, Categorizer™, LinguistX®, Star Tree™, Summarizer™, Table Lens®, and Thing Finder™ Vivisimo http://vivisimo.com/ http://clusty.com/ Visual Thesaurus and ThinkMap (free 5-click demo) http://www.visualthesaurus.com http://www.thinkmap.com xrefer Research Mapper (free 30-day trial) http://www.xrefer.com/research/
  • 19.
    See also JudyLuther and Maureen Kelly, and Donald Beagle. “Visualize This.” Library Journal. March 1, 2005, p. 34-37. Bernard Frischer. “The Ultimate Internet Café: Reflections of a Practicing Digital Humanist about Designing a Future for the Research Library in the Digital Age.” Library As Place: Rethinking Roles, Rethinking Space. CLIR, February 2005, p. 41-81. http://www.clir.org/pubs/reports/pub129/pub1 29.pdf Bernard Frischer. “From CVR to CVRO: The Past, Present, and Future of Cultural Virtual Reality.” http://www.cvrlab.org/research/images/CVR% 20to%20CVRO.pdf
  • 20.
    From CVR toCVRO: If the ten-year rule of thumb holds true, personal computer enthusiasts by the millions a decade from now will be interacting directly with virtual worlds through their desktop reality engines. Howard Rheingold (1991)
  • 21.
    Also from CVRto CVRO: All men by nature desire to know. An indication of this is the delight we take in our senses; for even apart from their usefulness they are loved for themselves; and above all others the sense of sight. For not only with a view to action, but even when we are not going to do anything, we prefer seeing (one might say) to everything else. The reason is that this, most of all the senses, makes us know and brings to light many differences between things. Aristotle, Metaphysics 980a (ca. 330 B.C.)
  • 22.