Download as PDF, PPTX

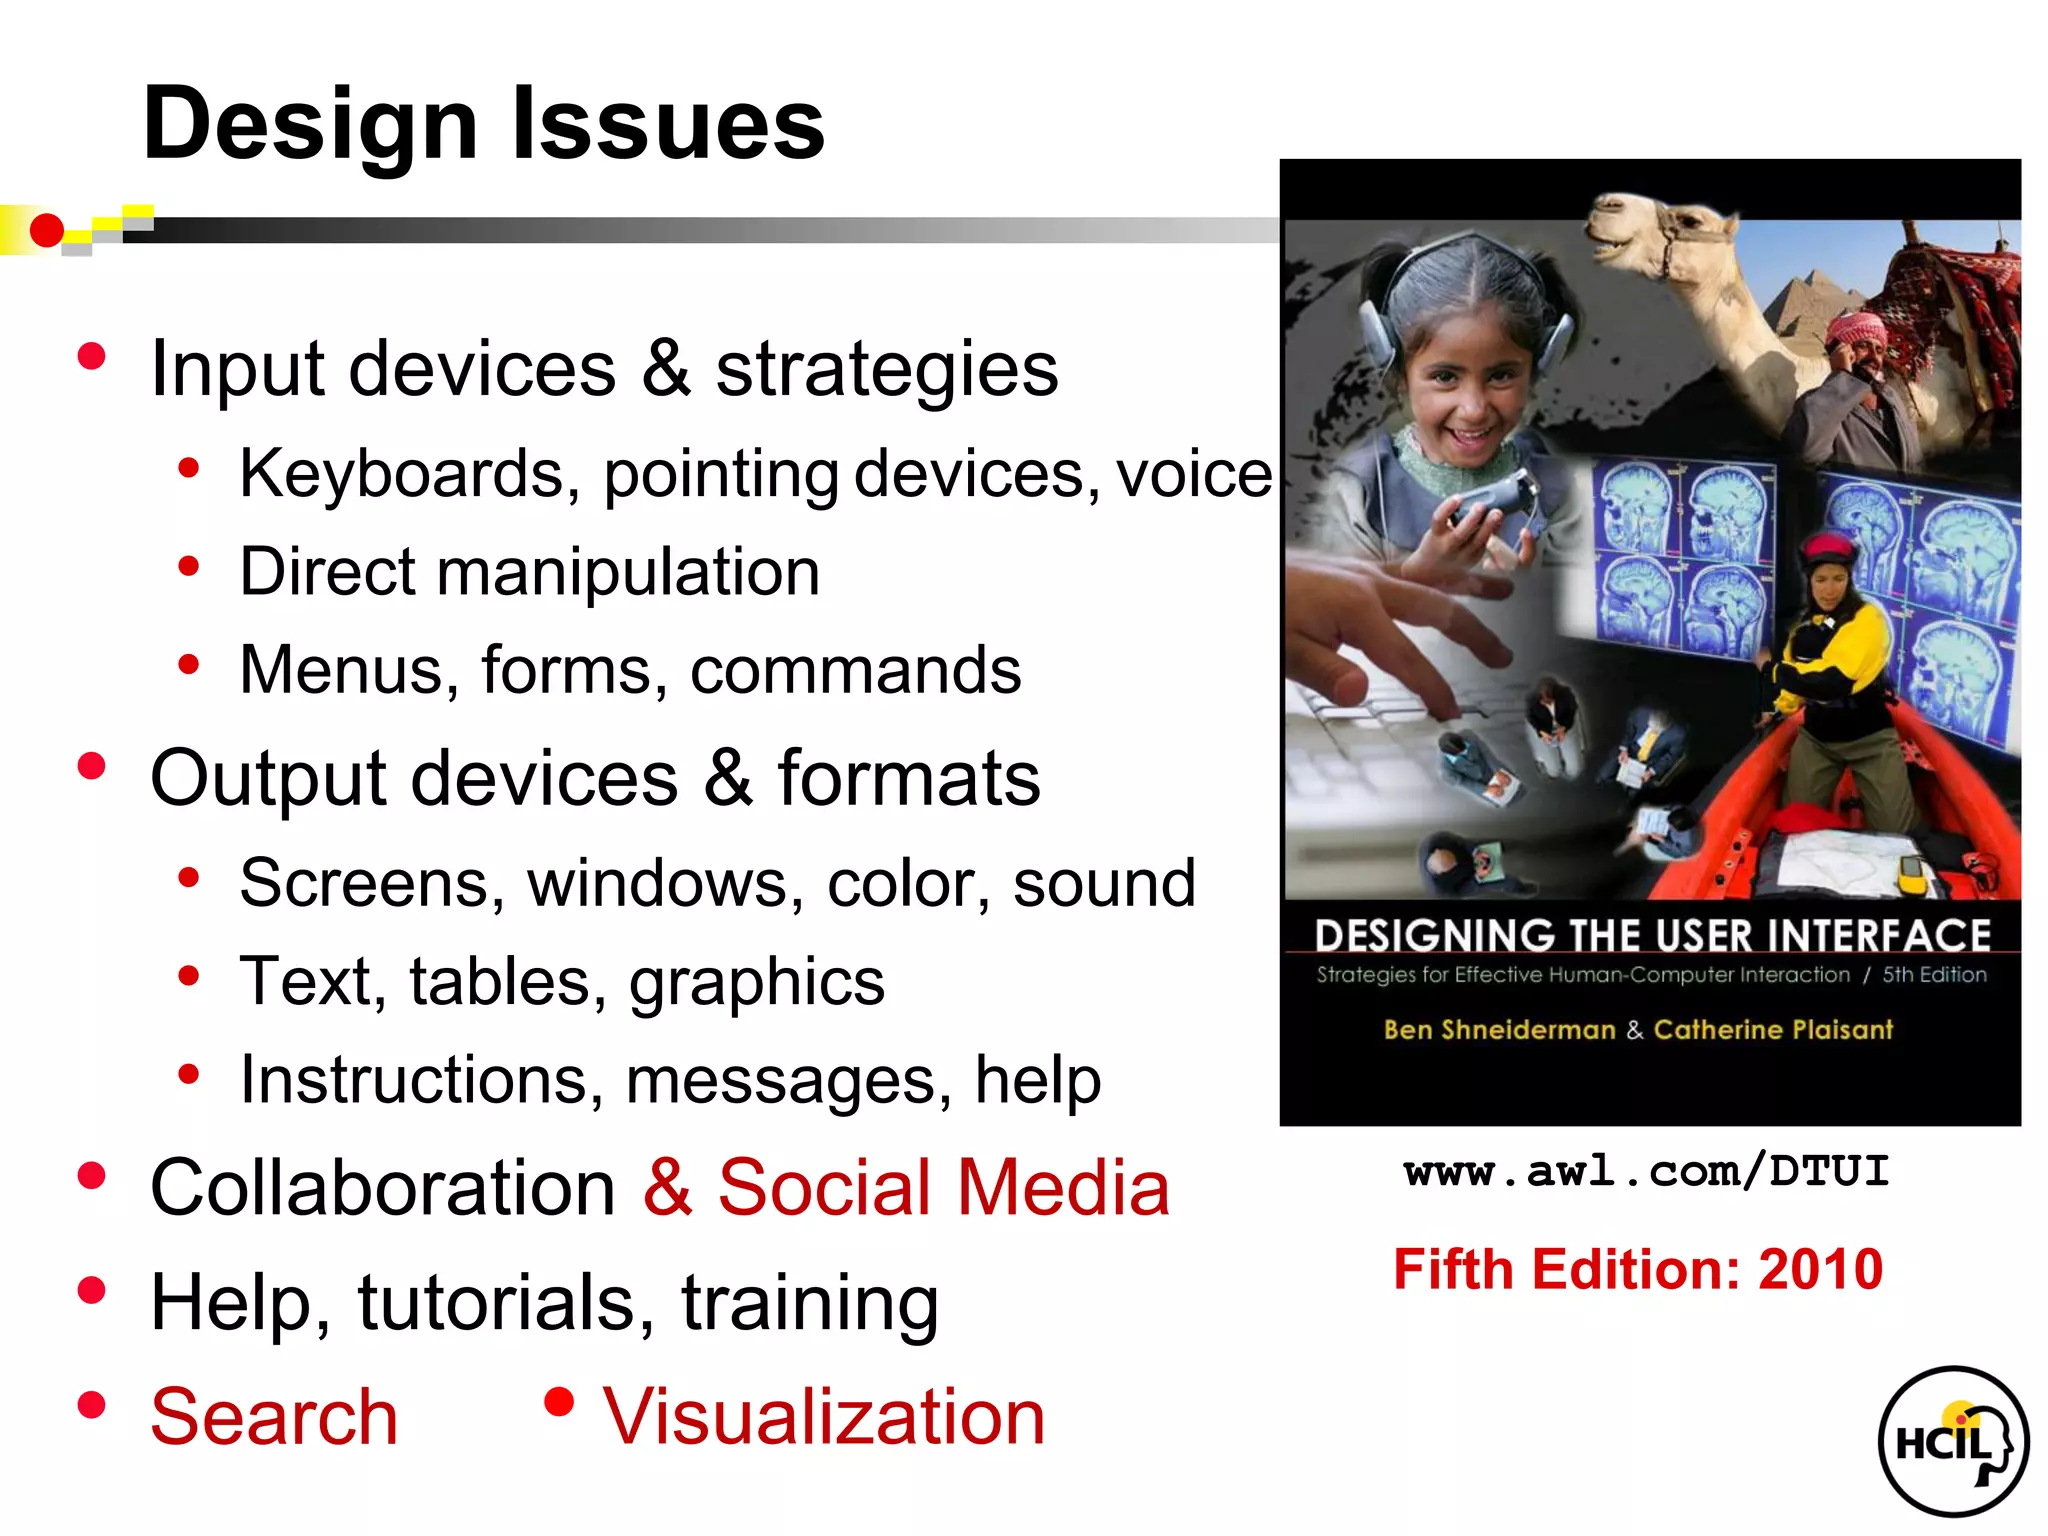
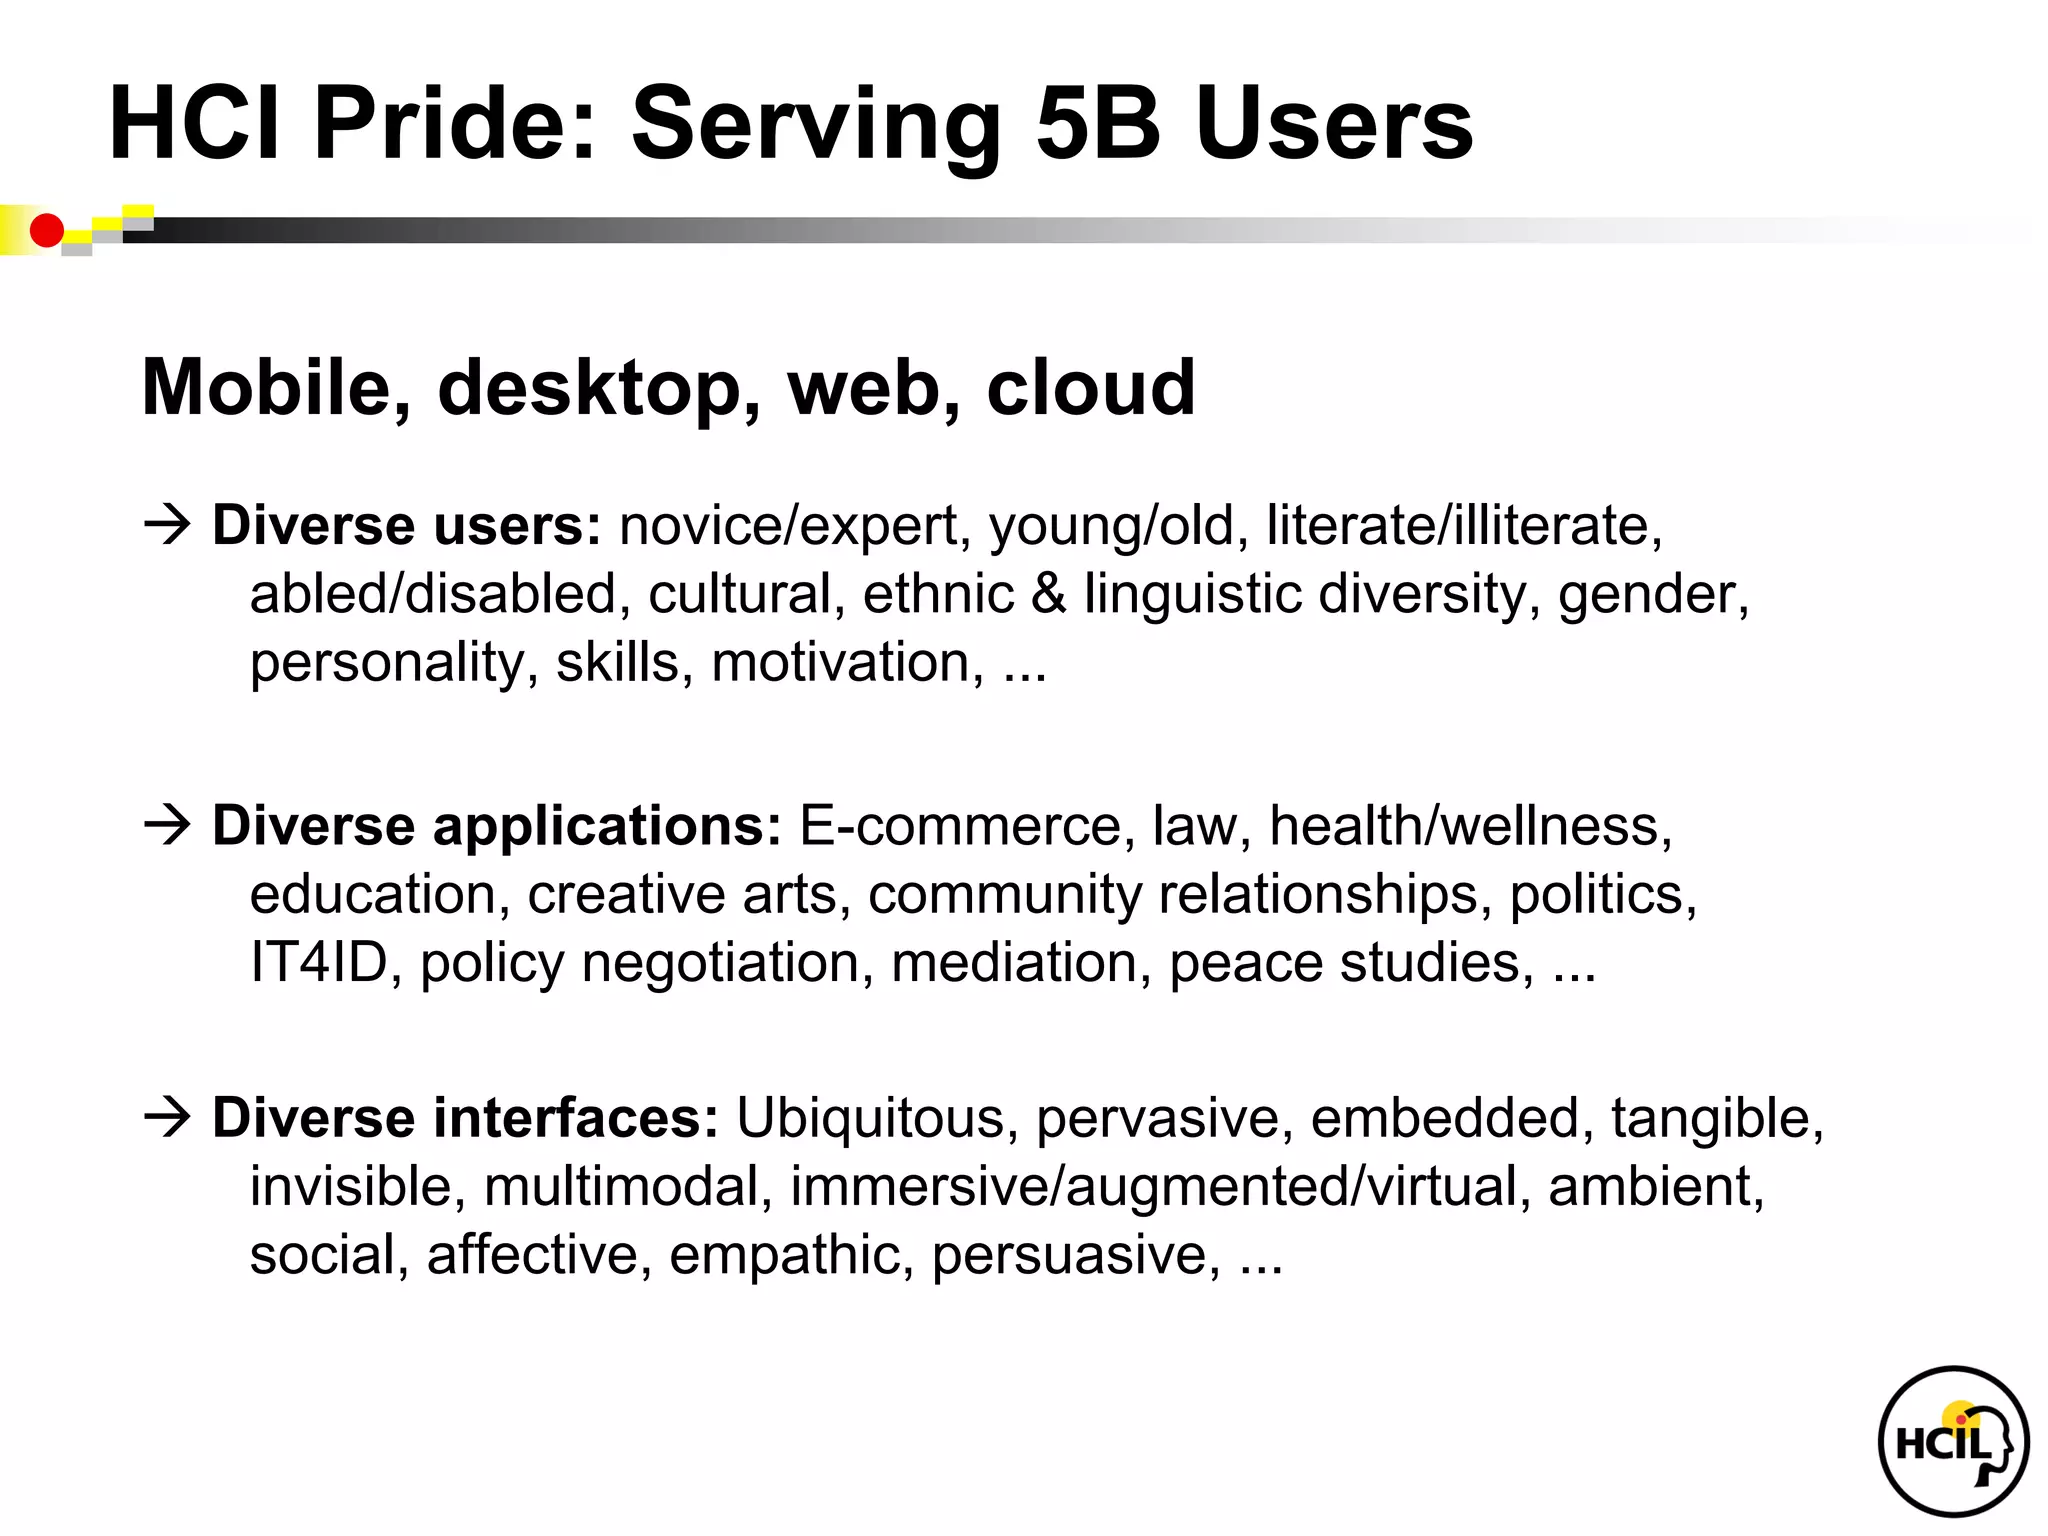
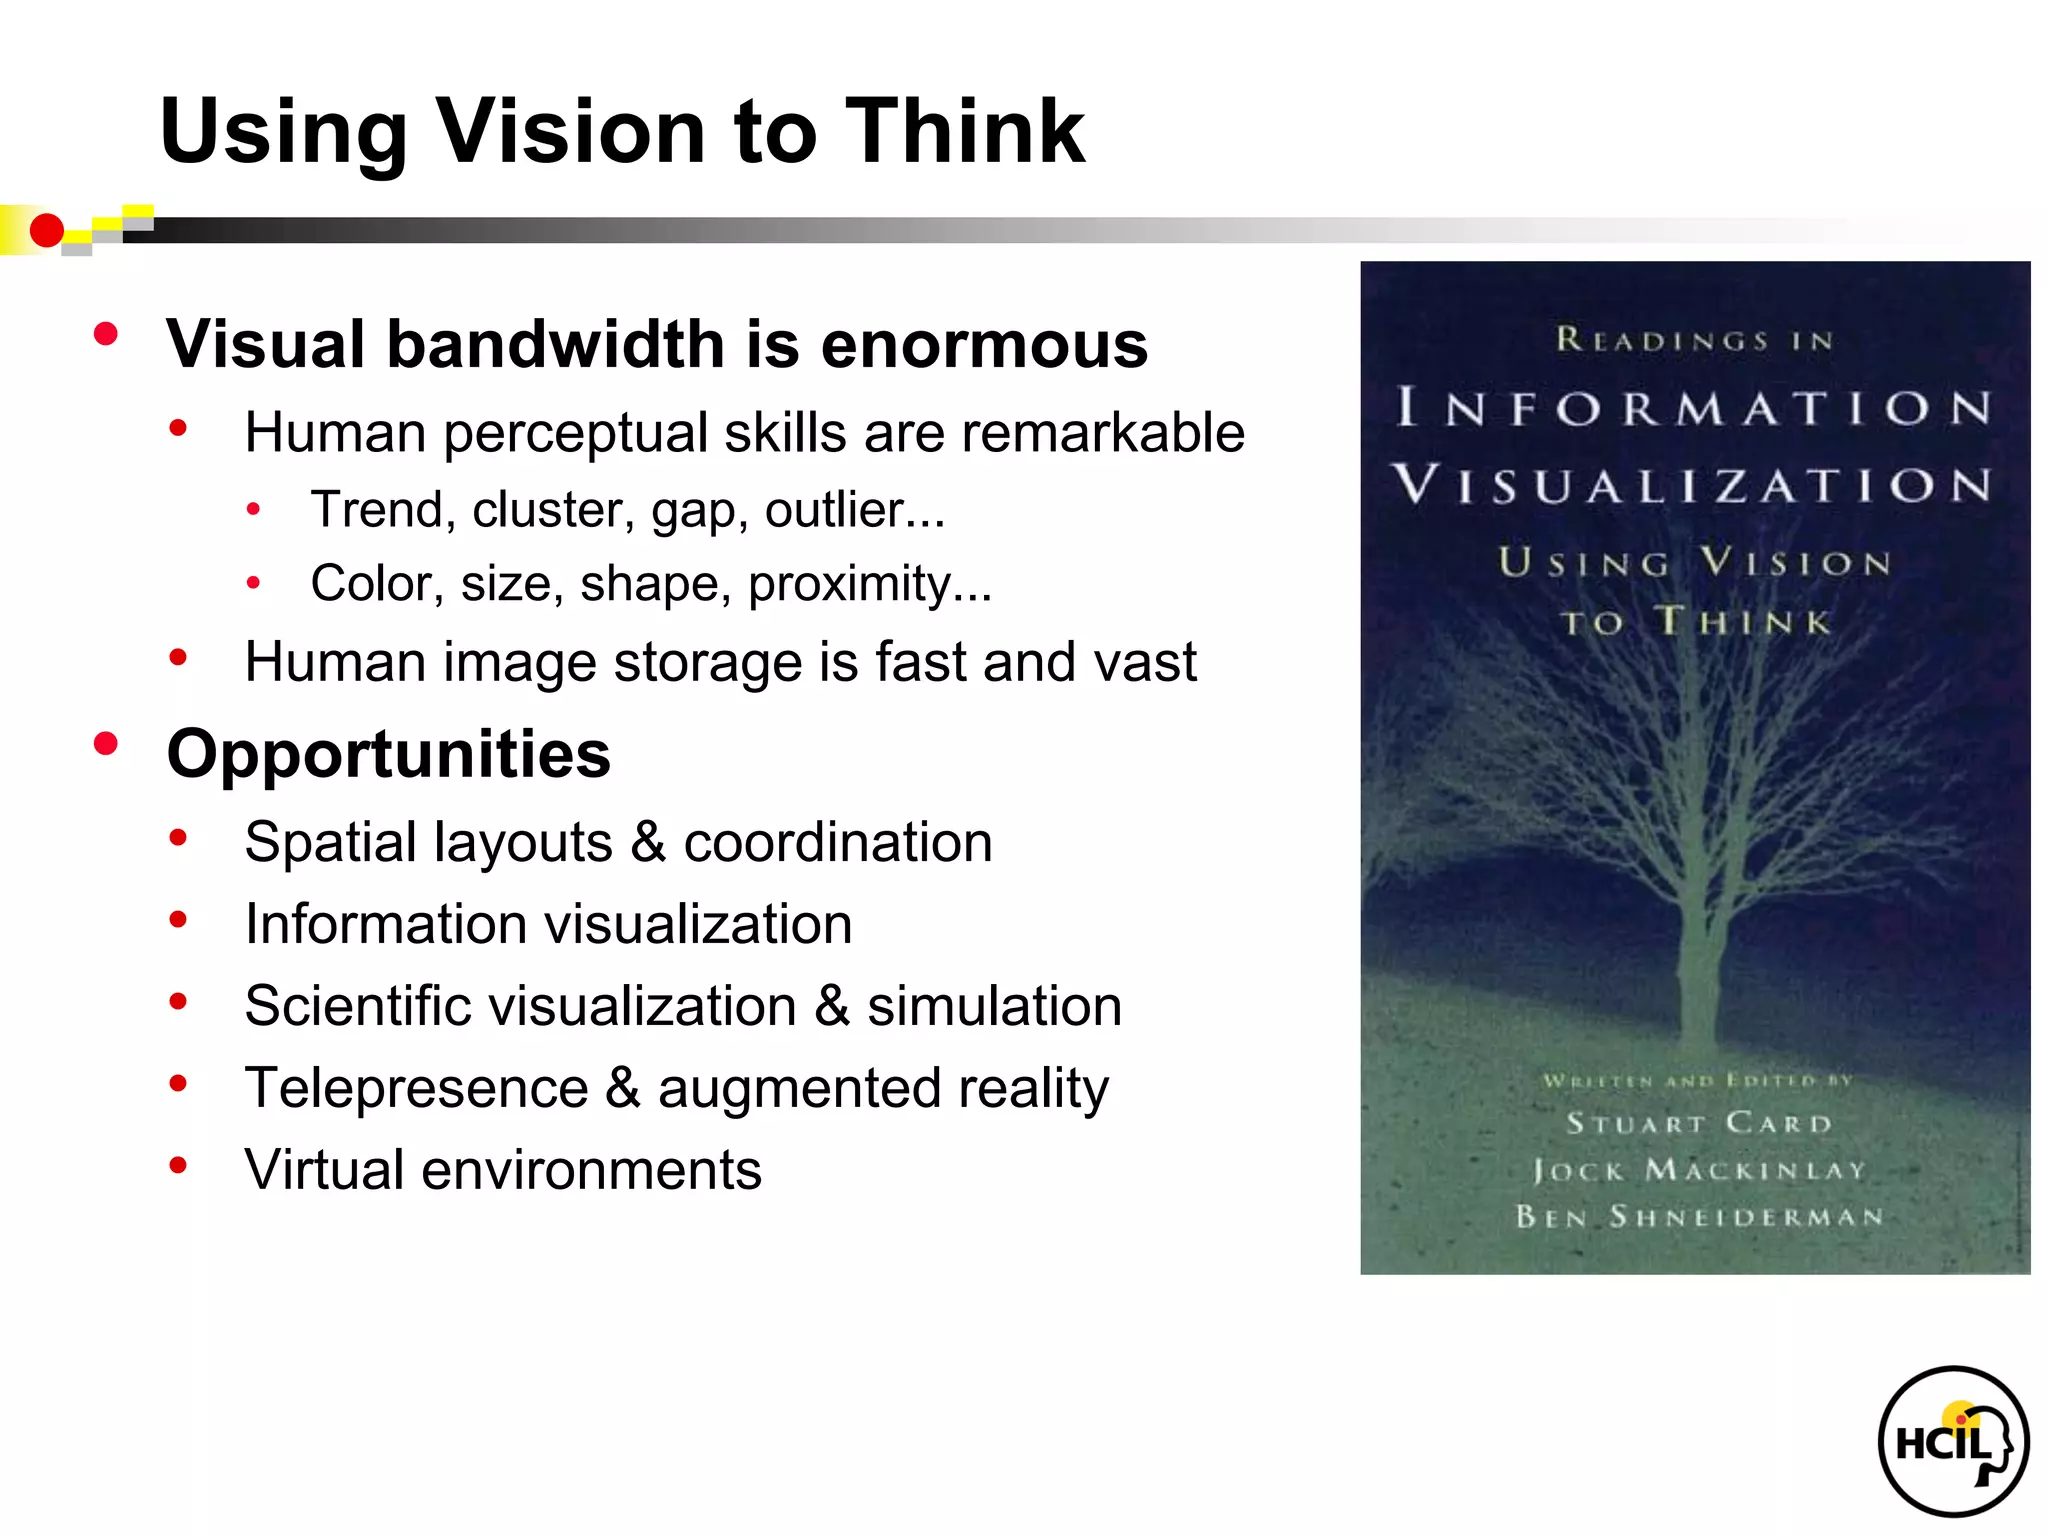


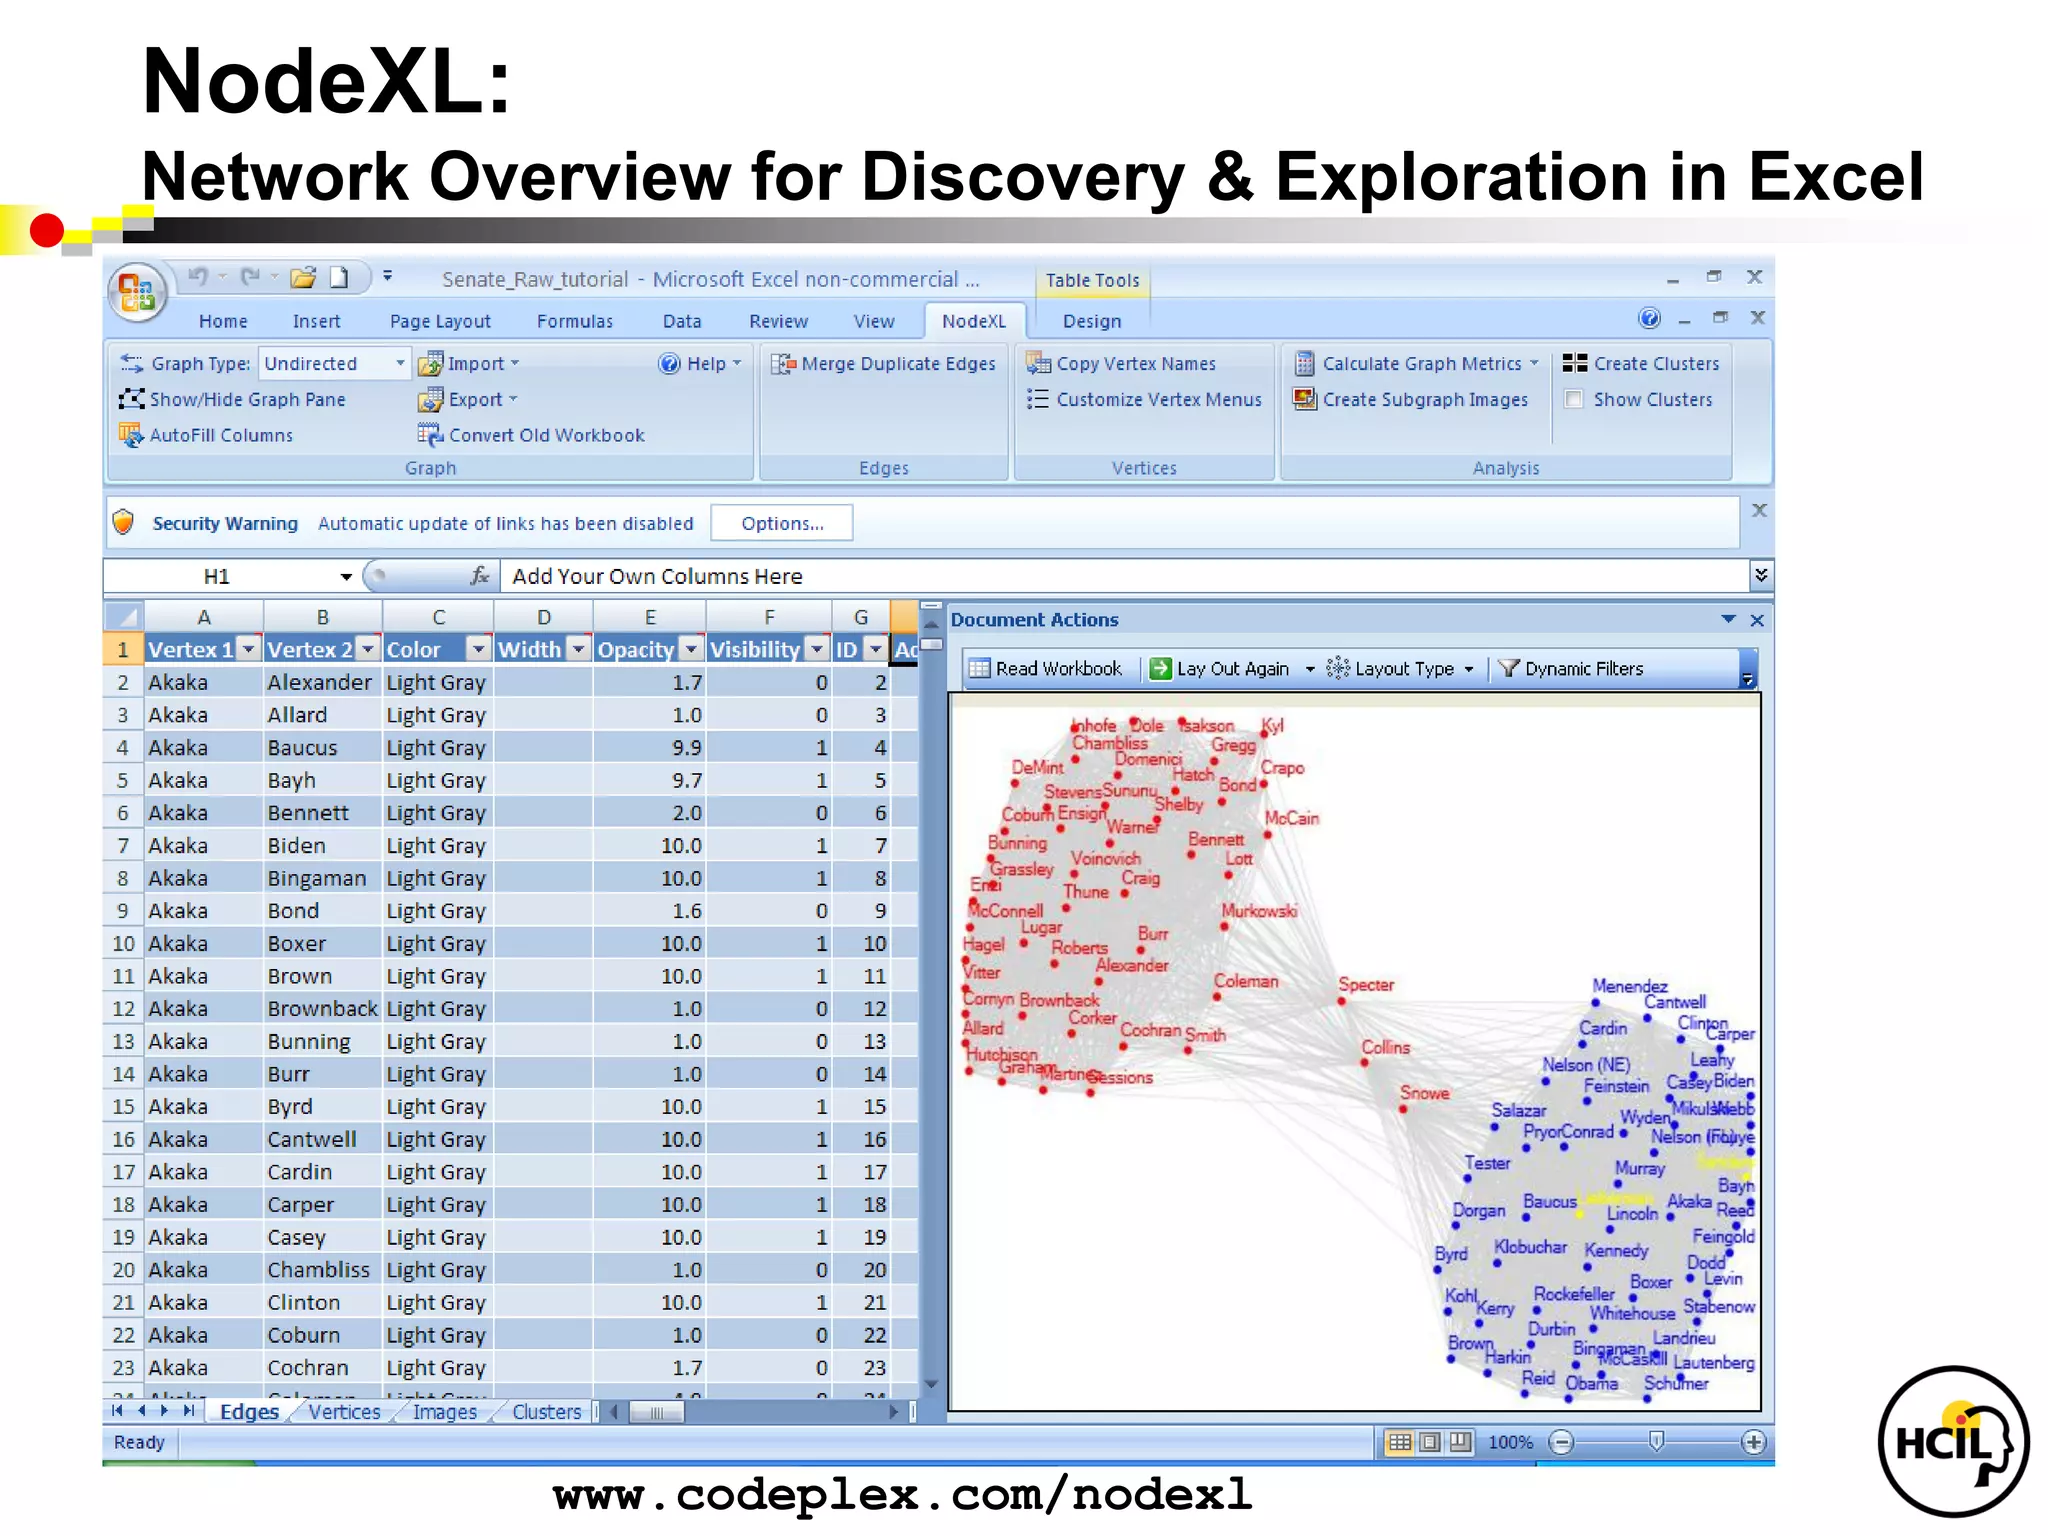
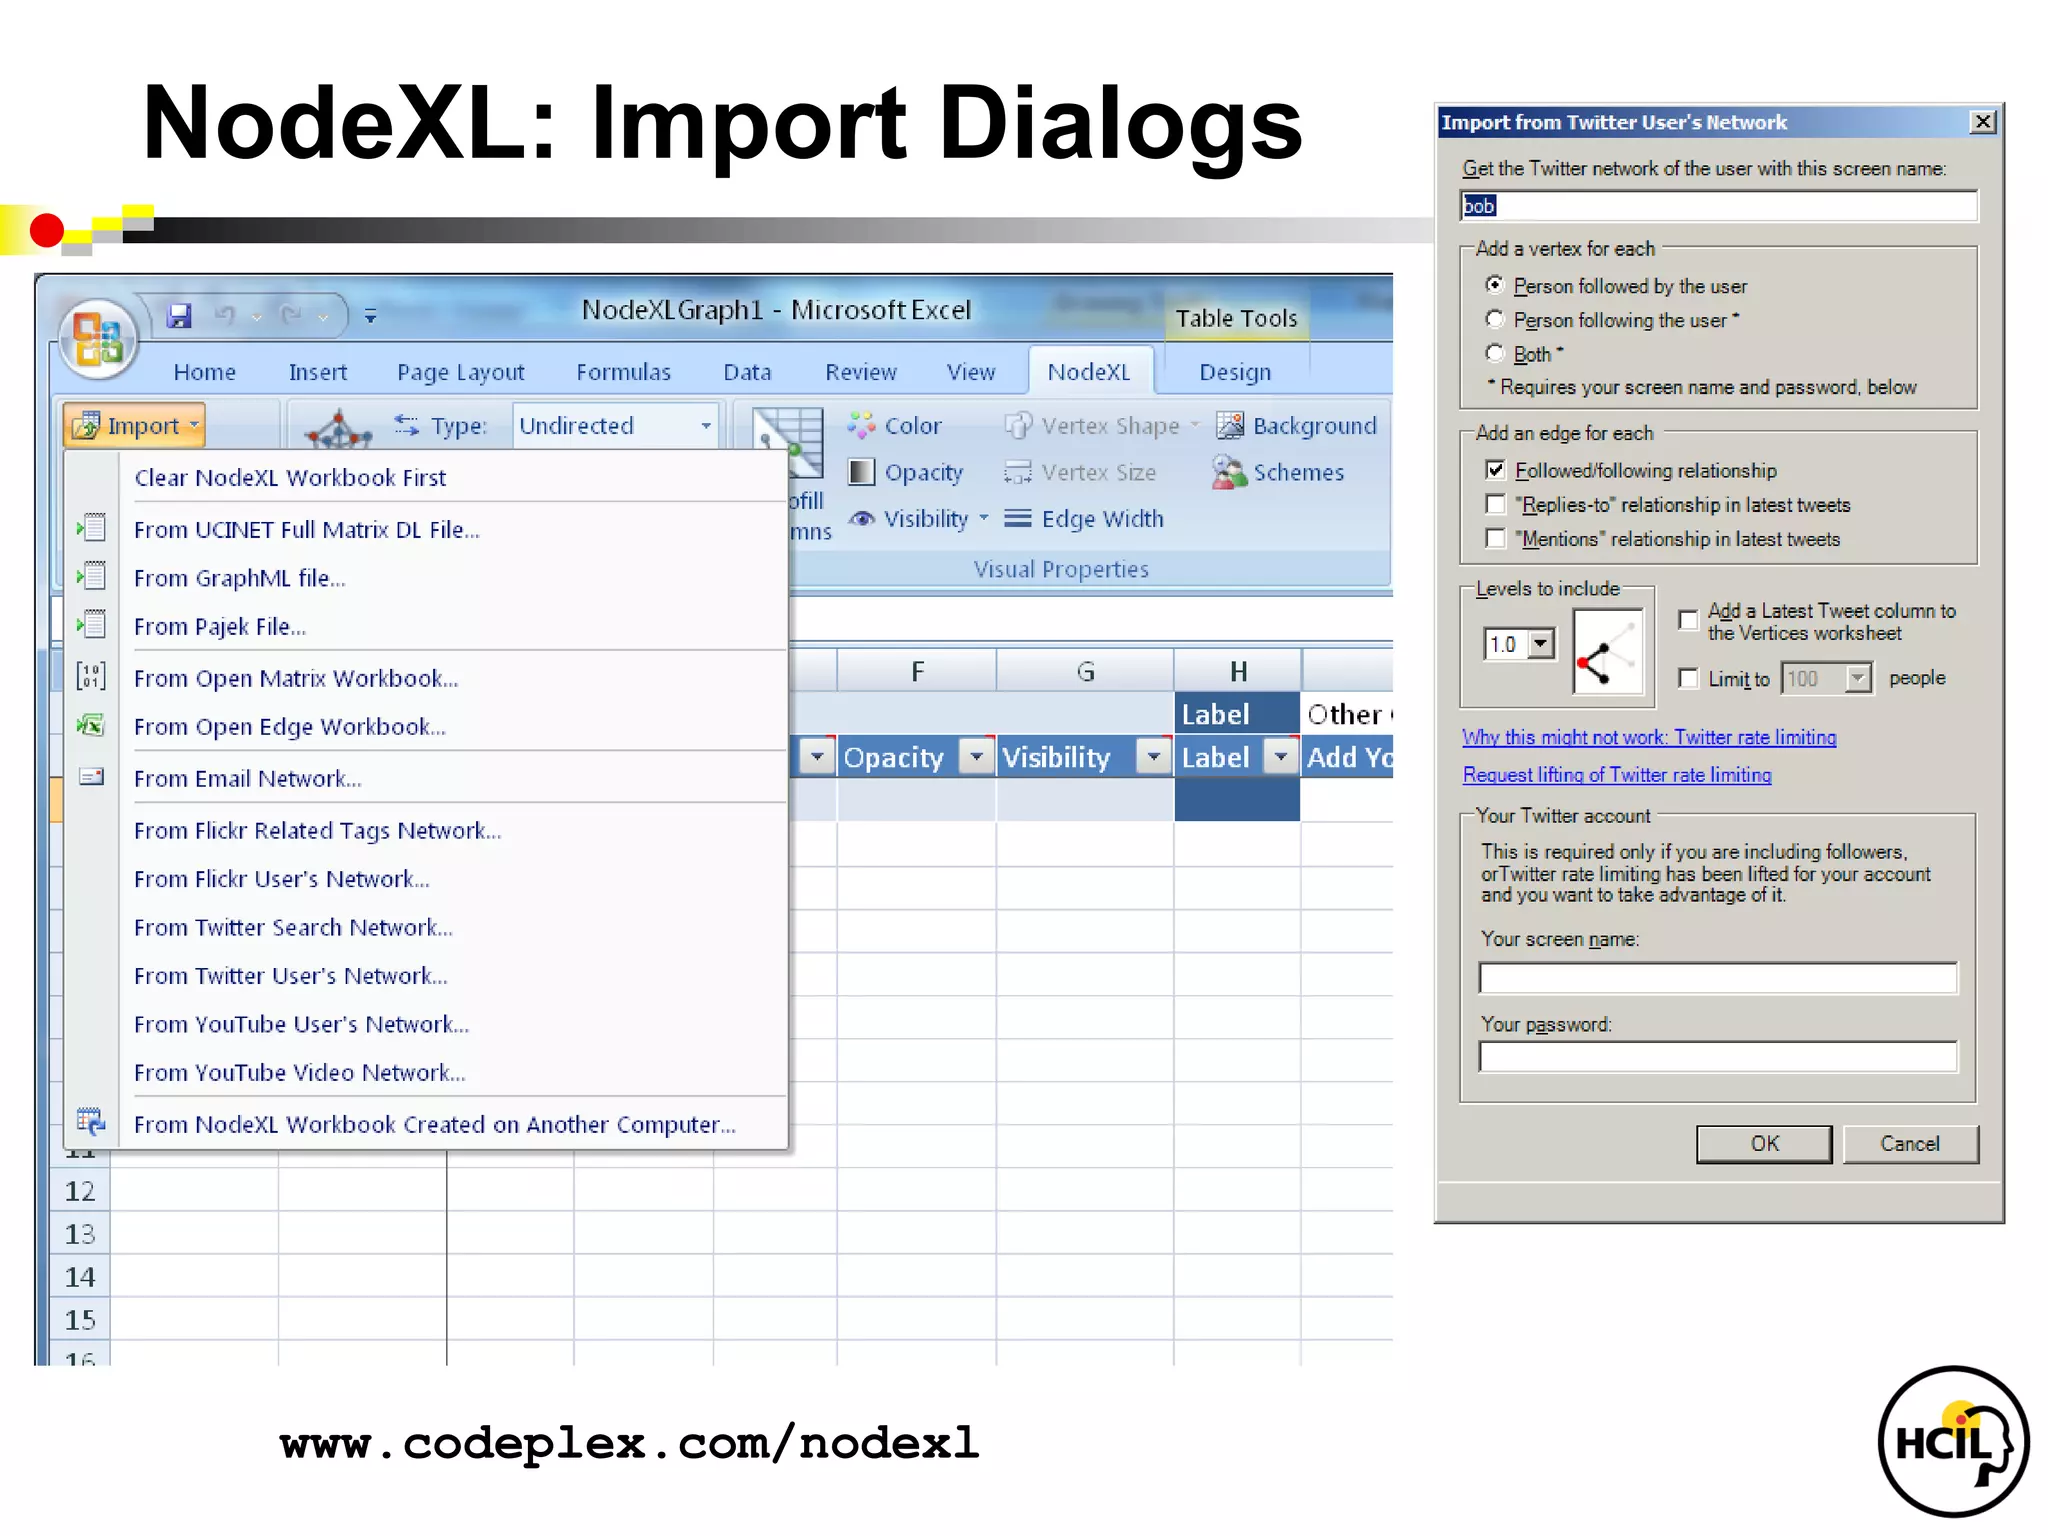
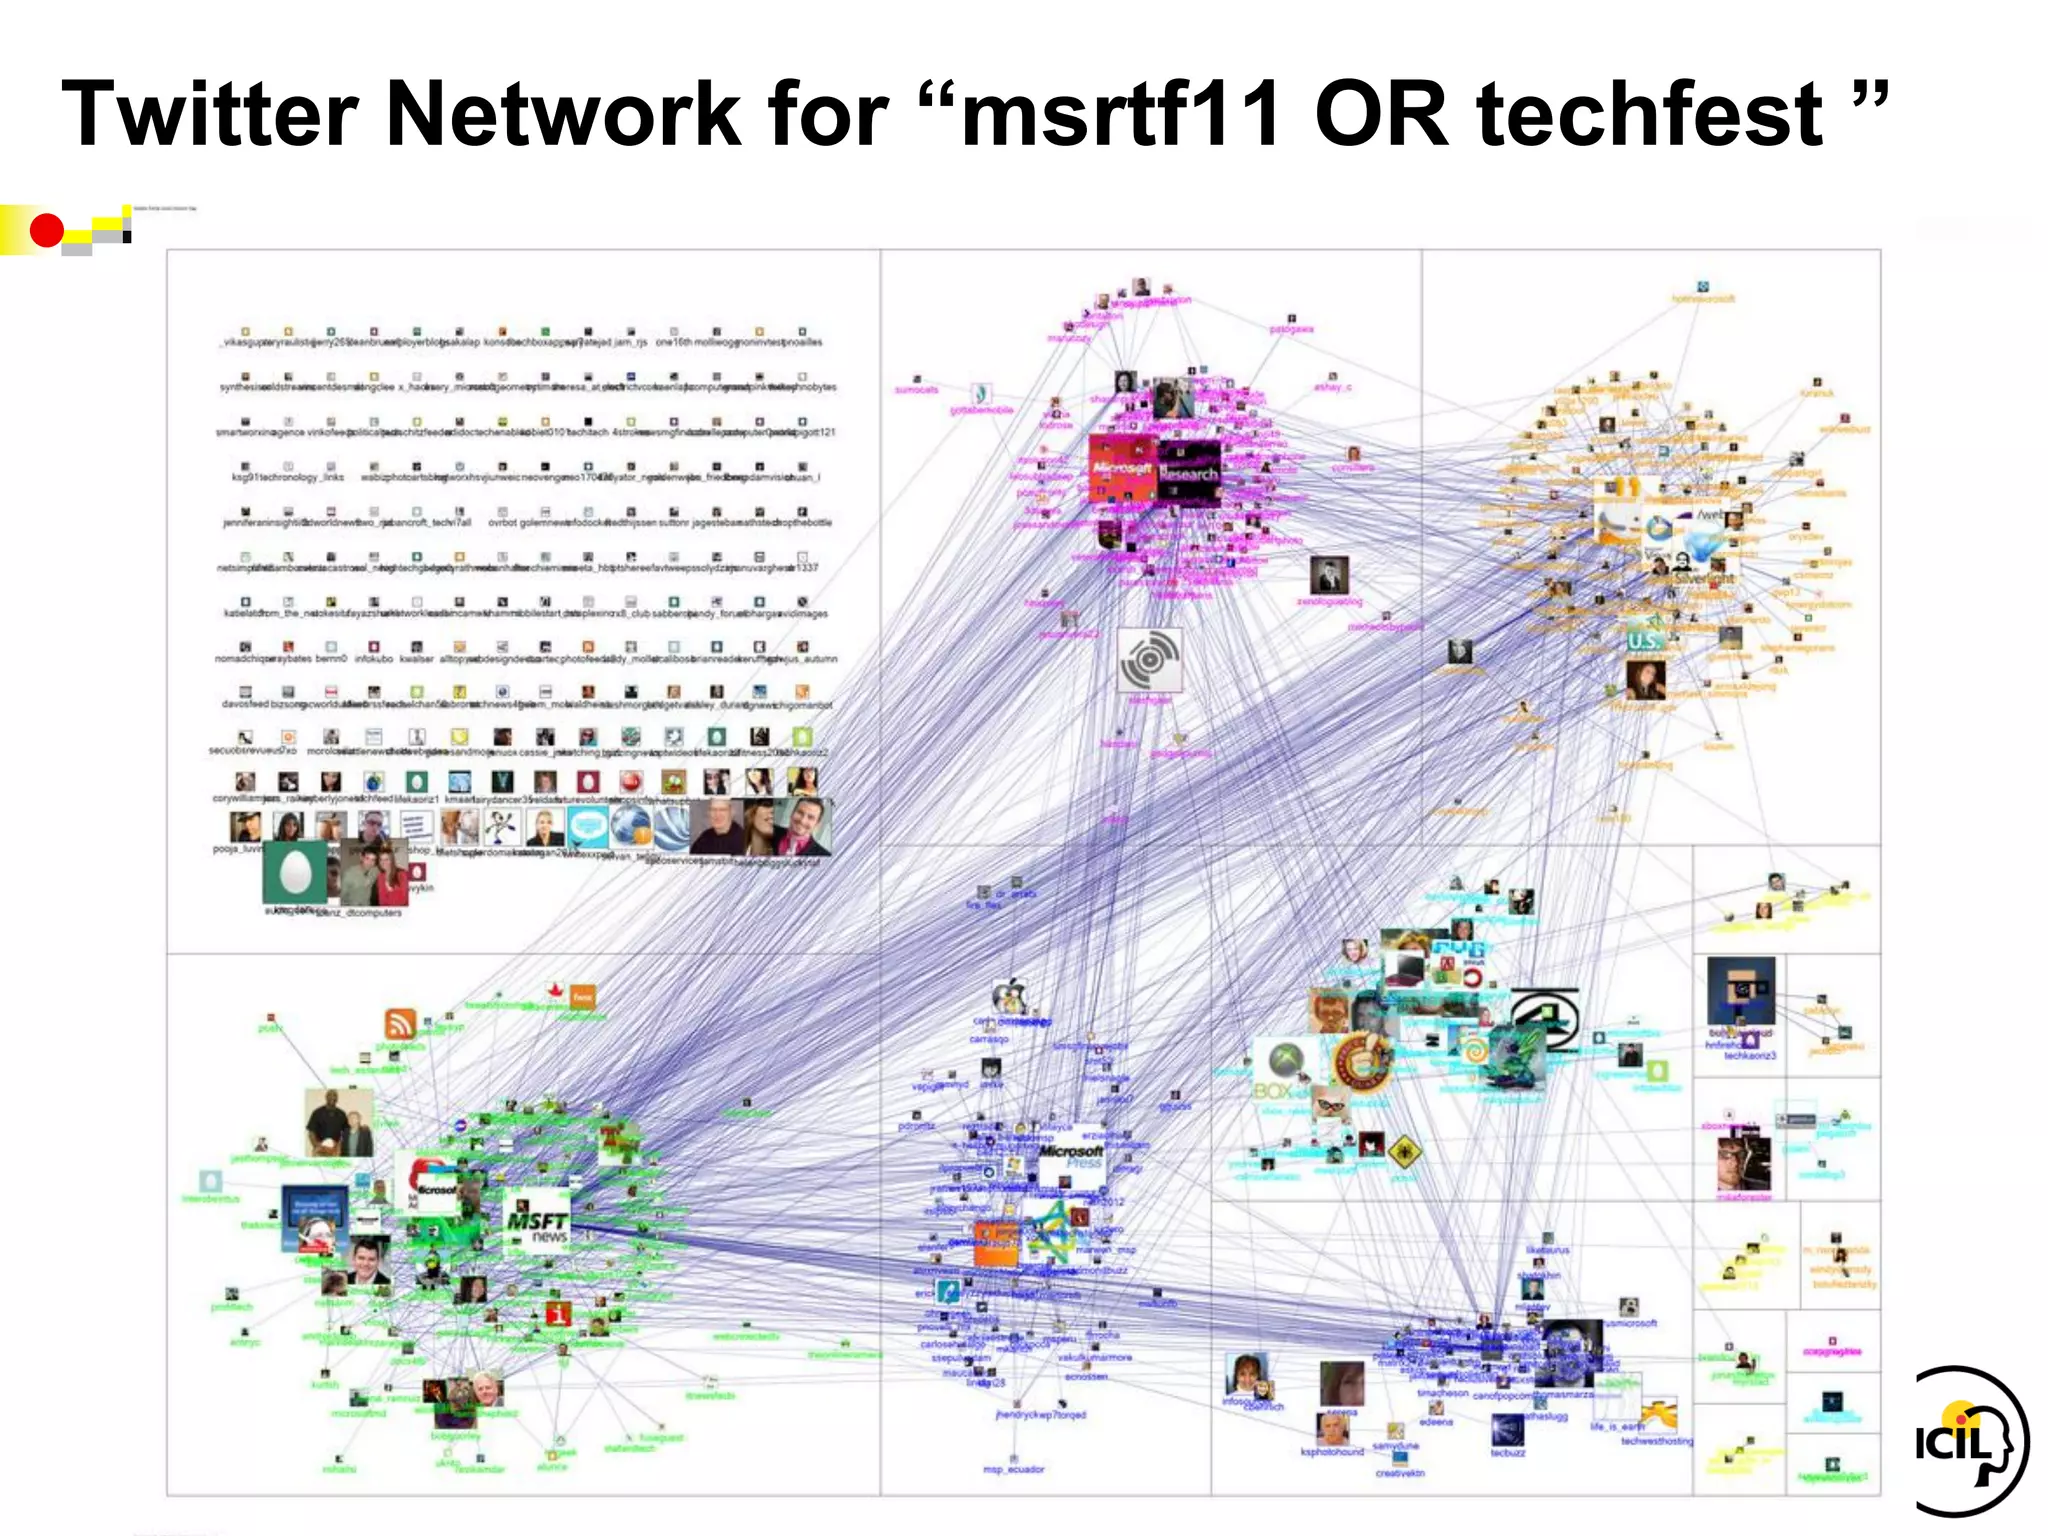
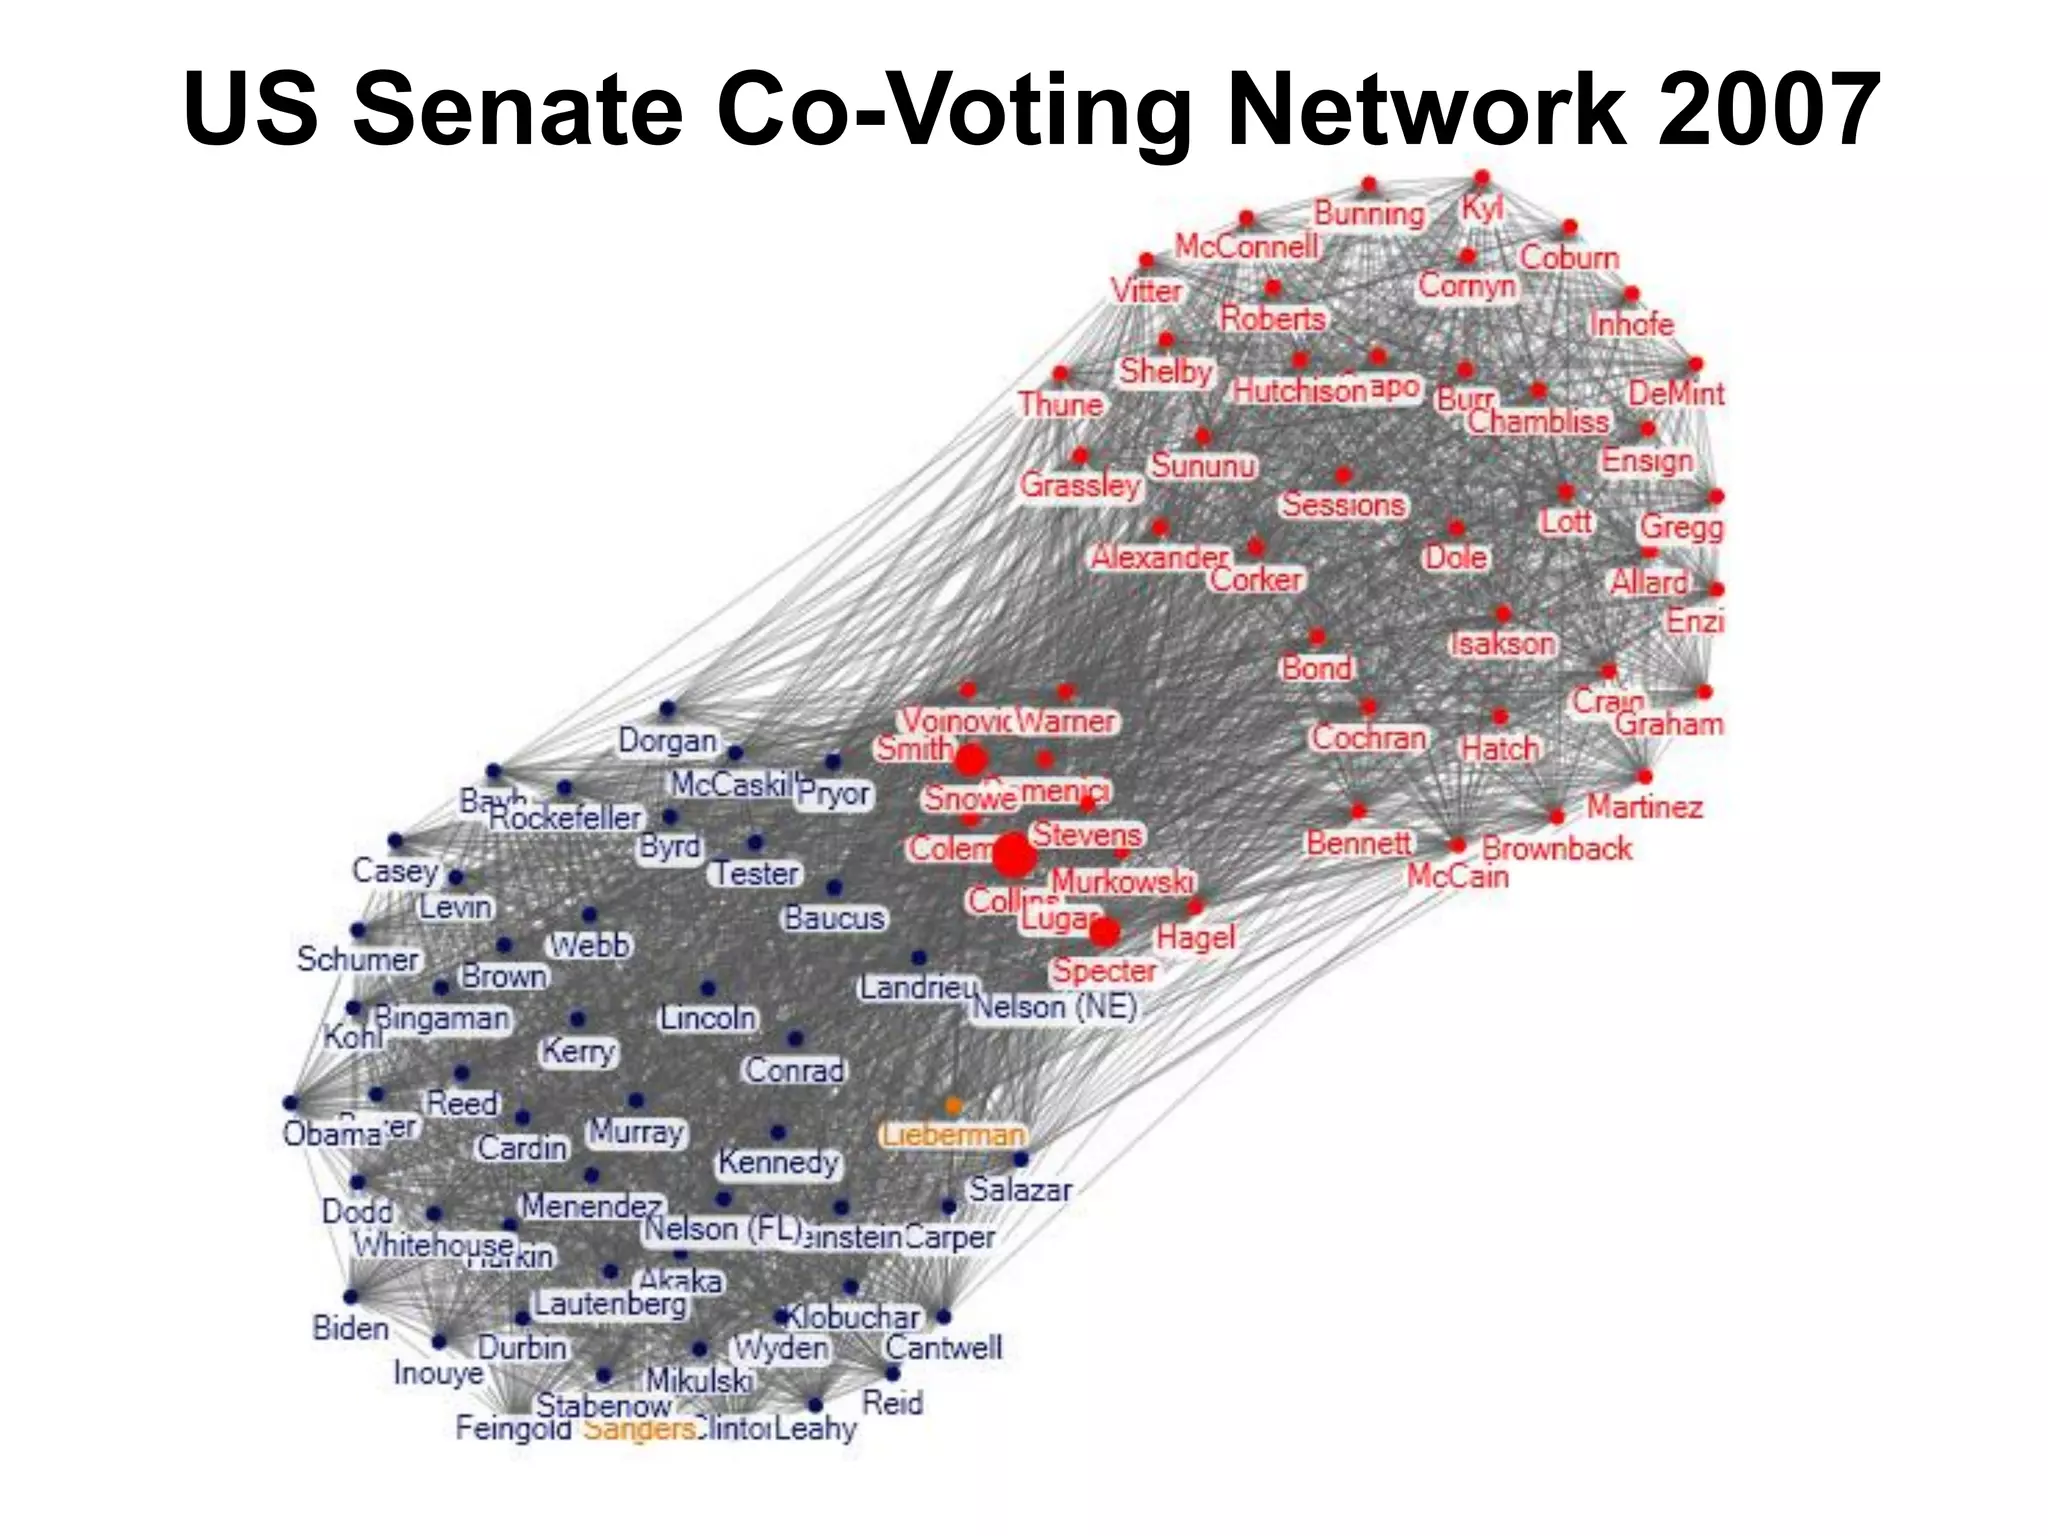
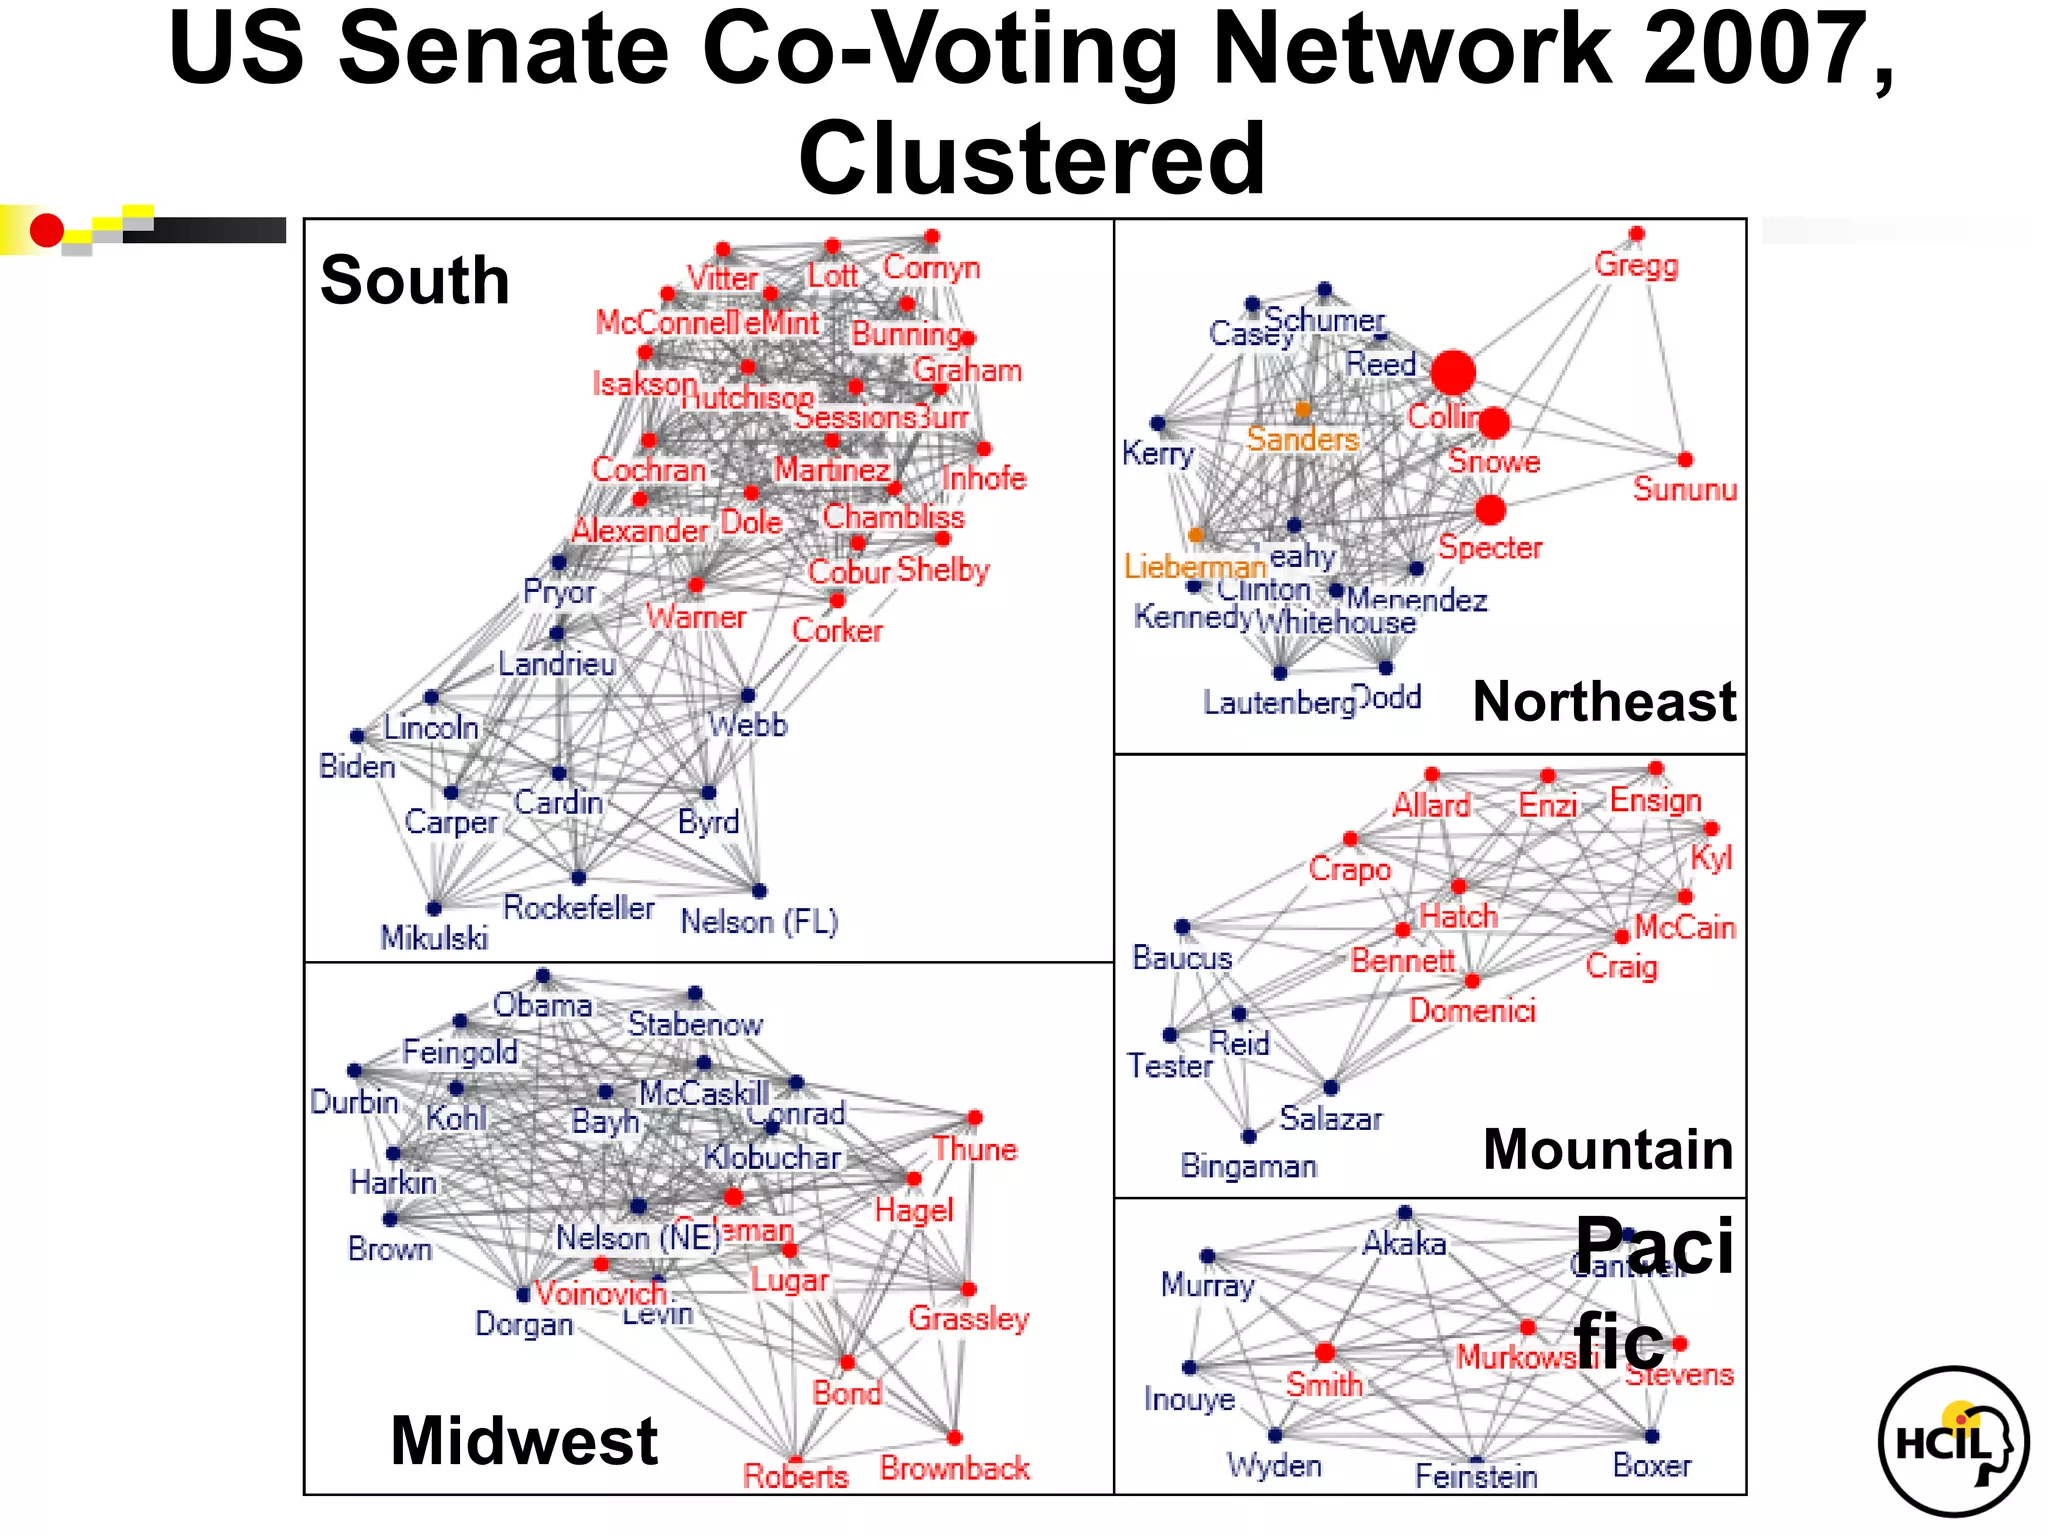
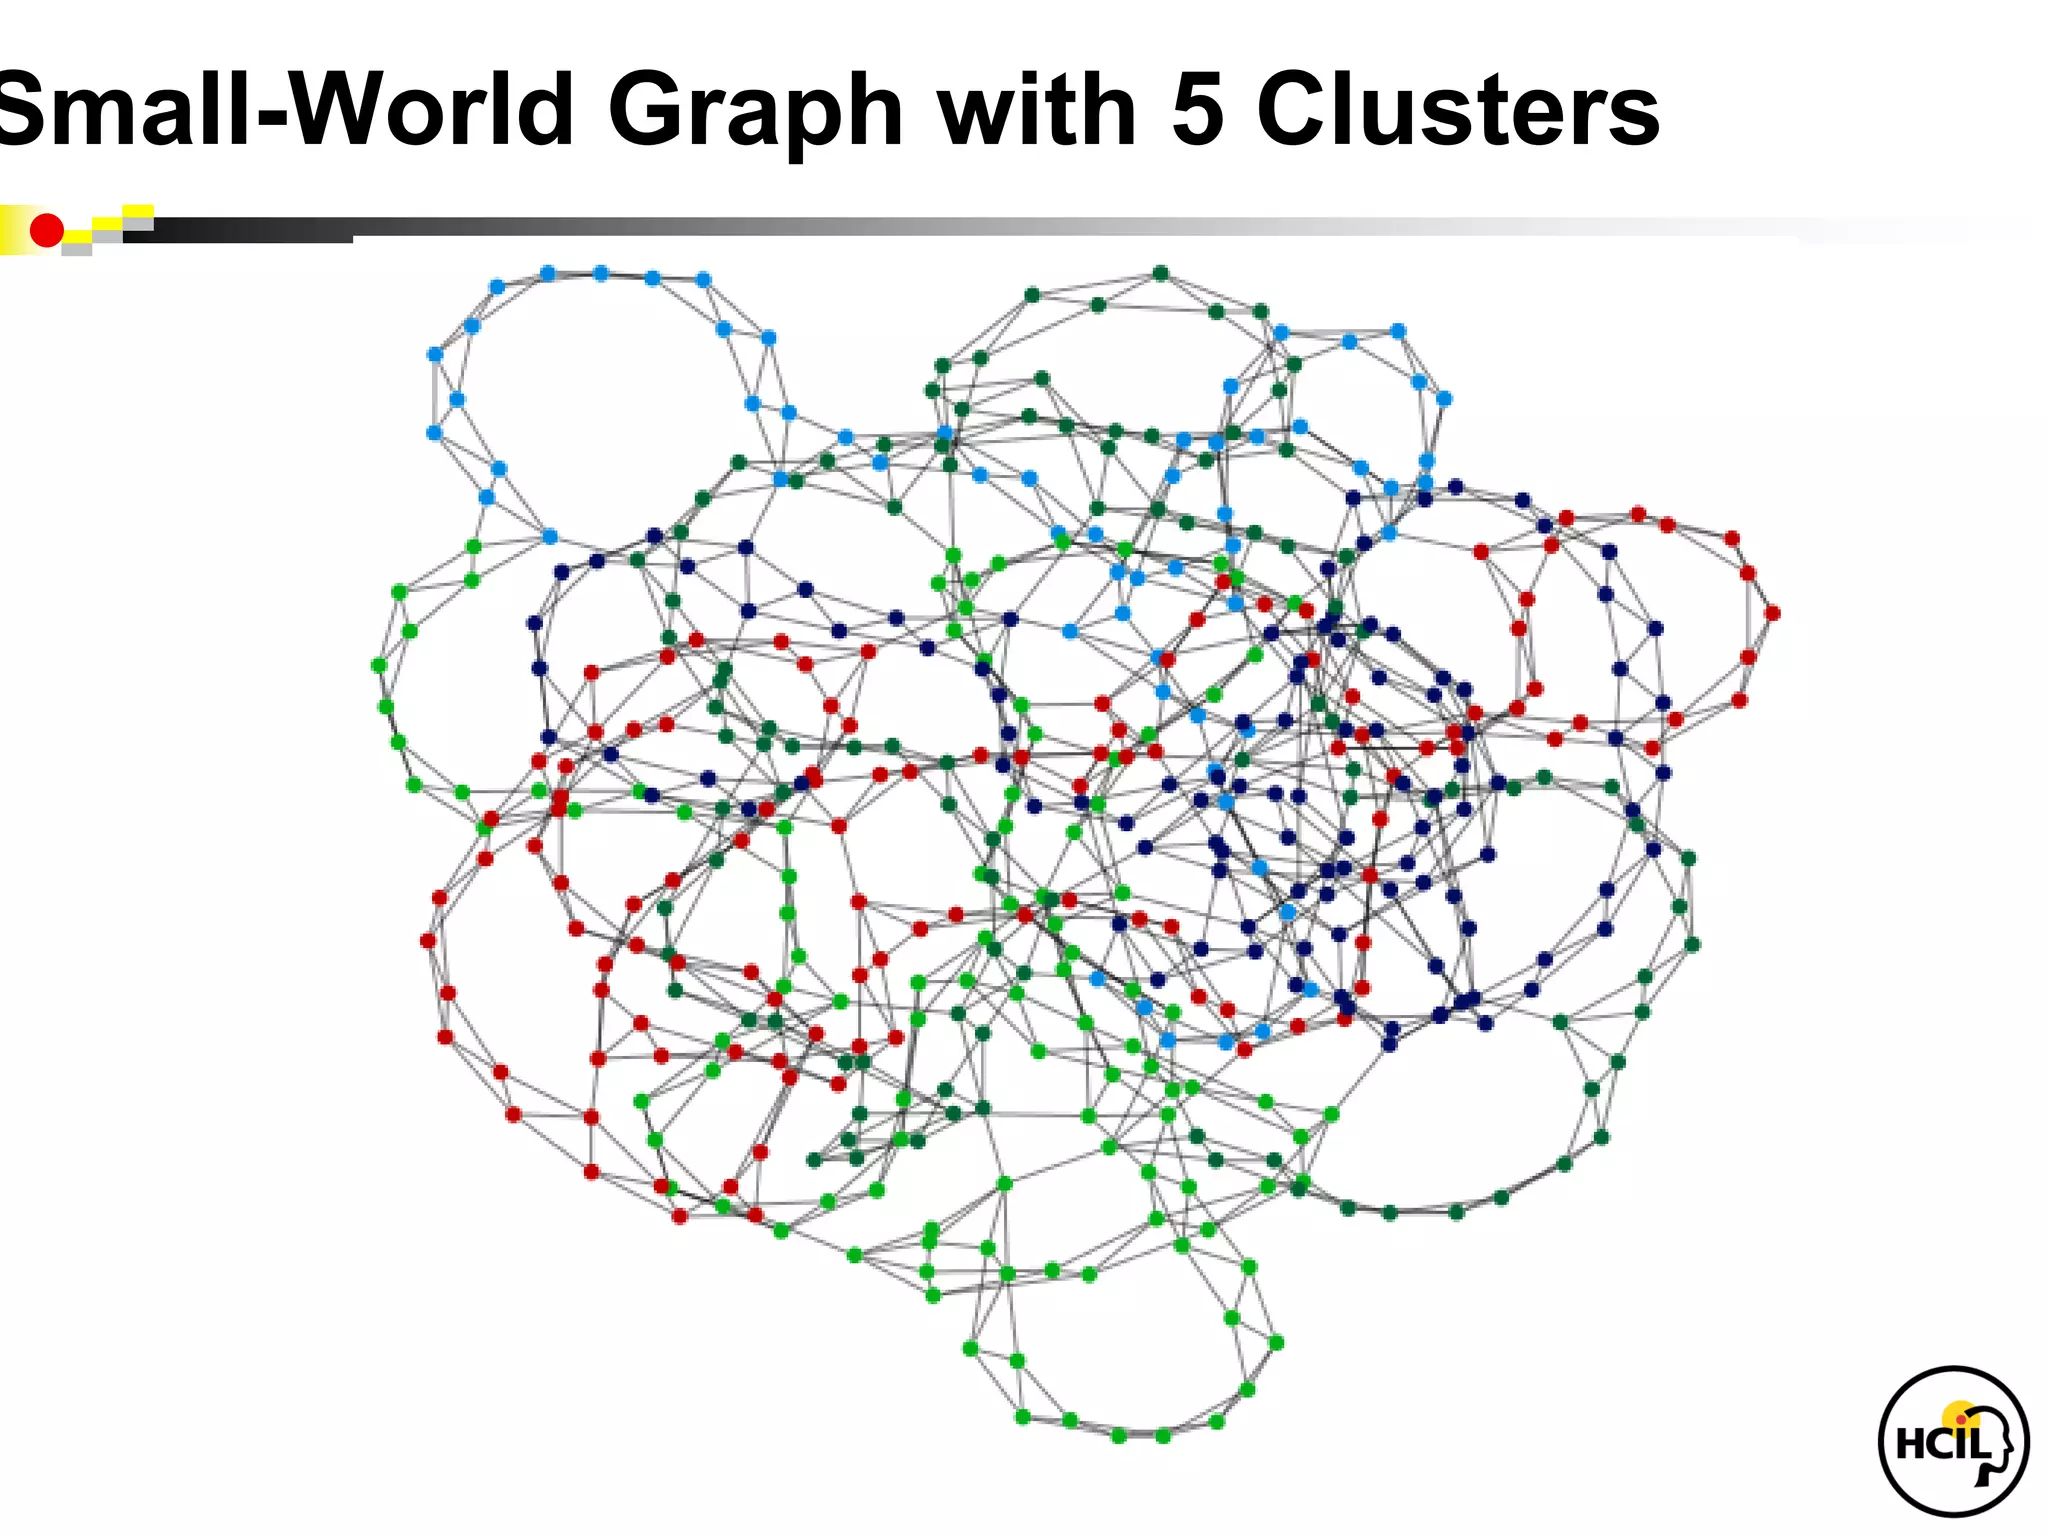
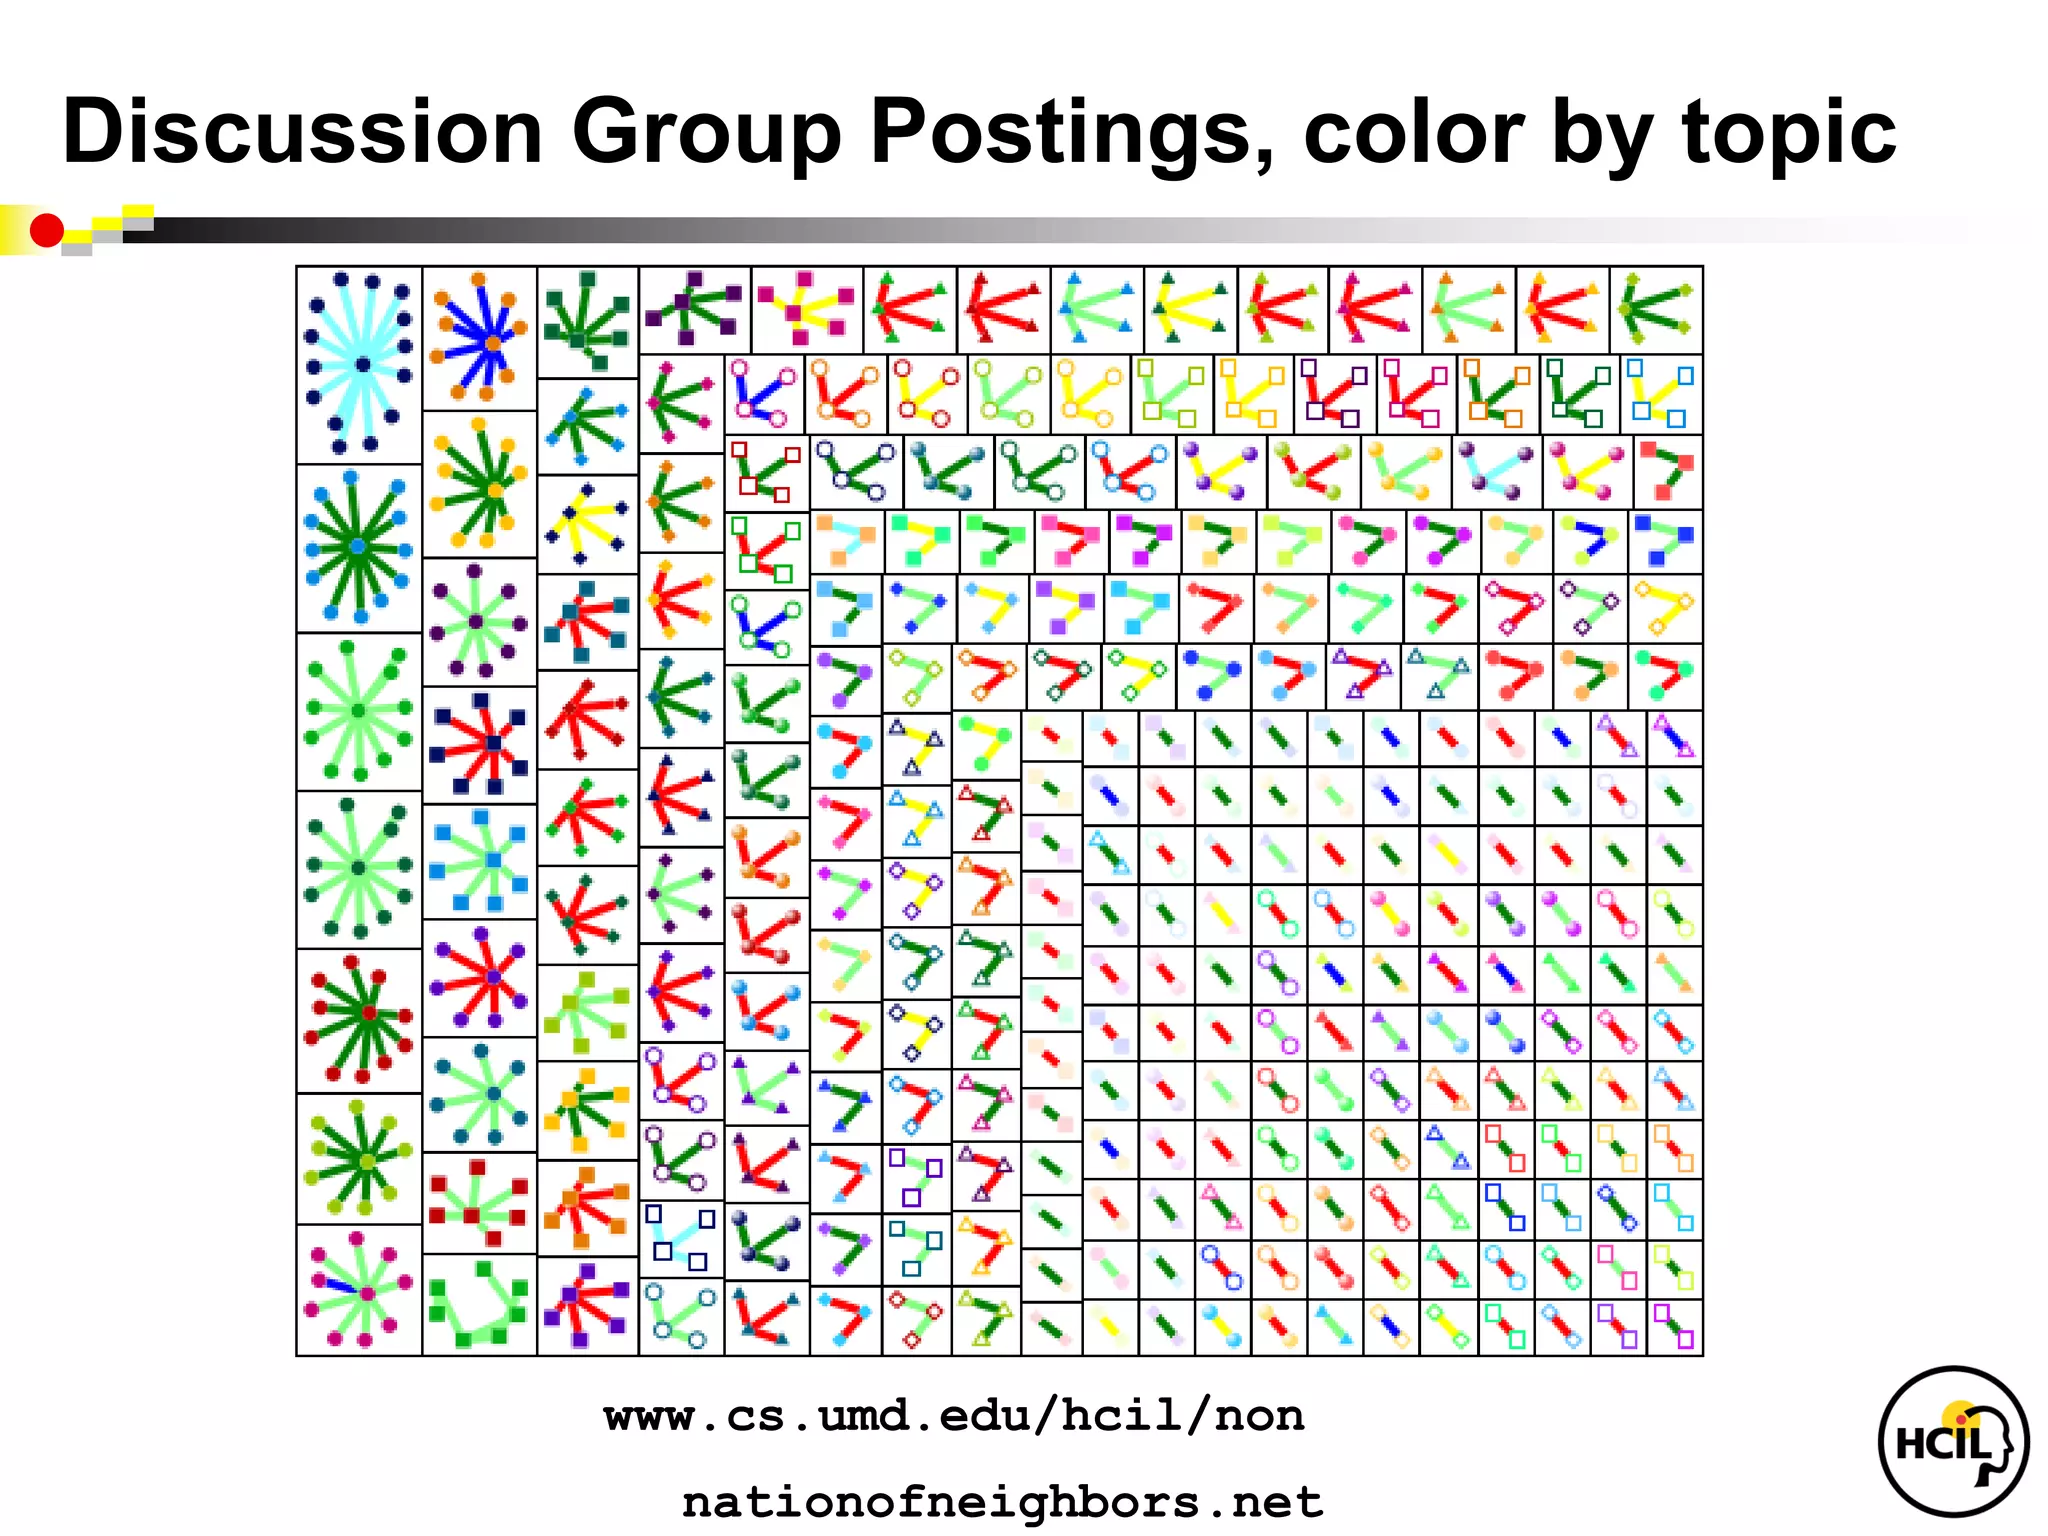
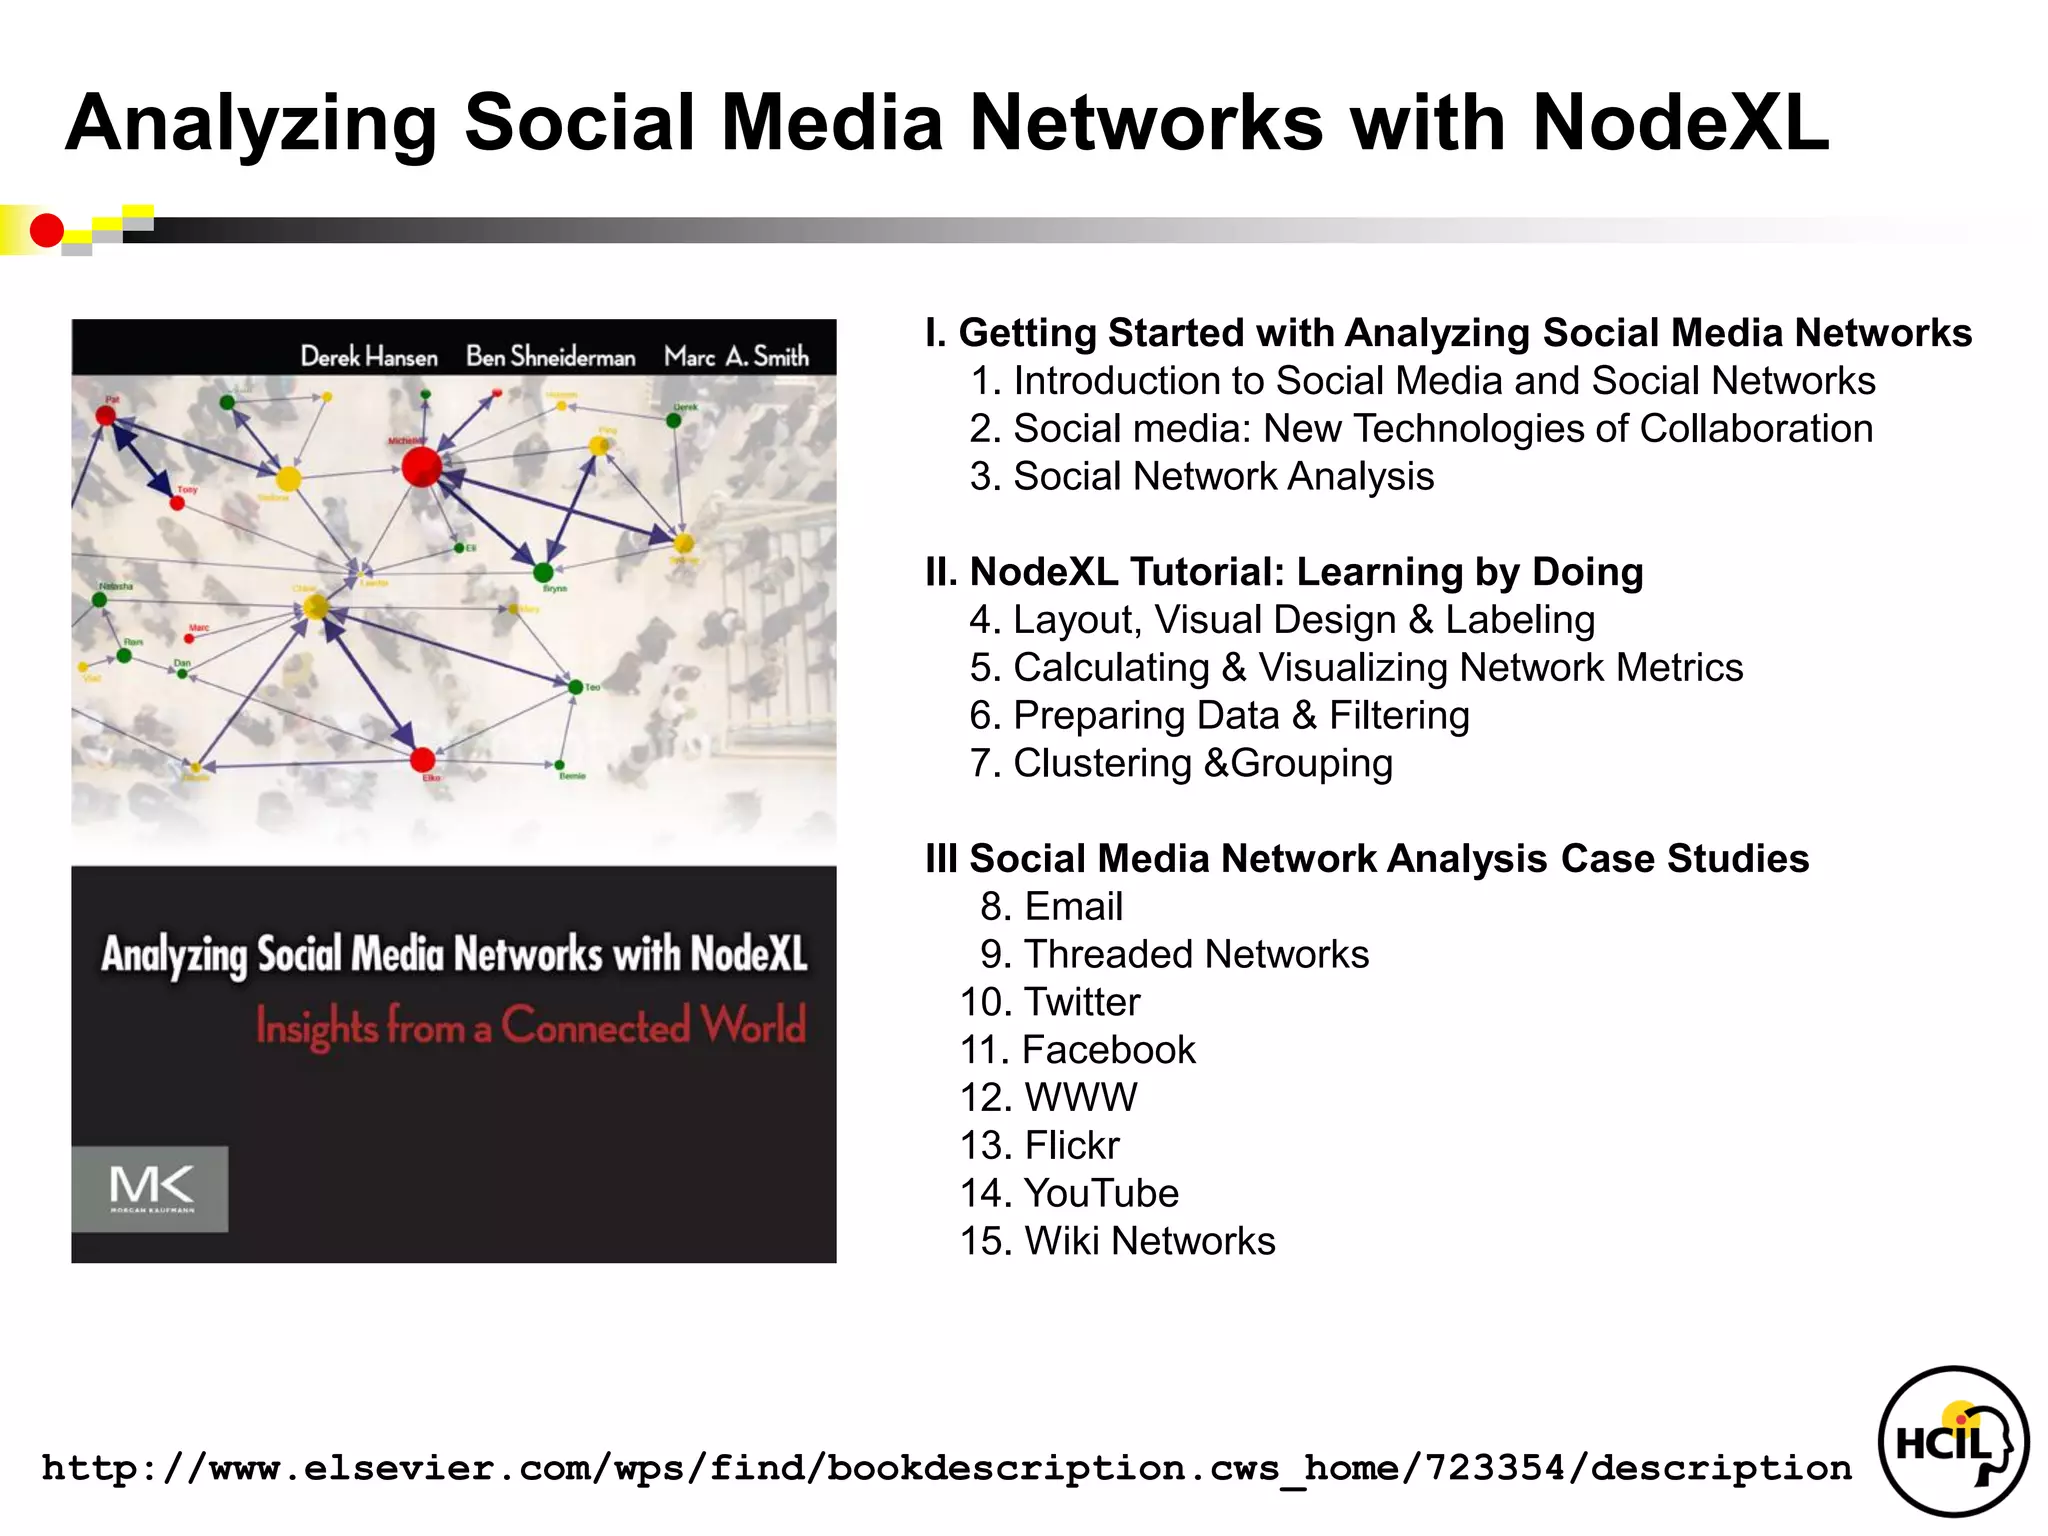

The document outlines the principles and applications of information visualization in social network analysis, highlighting the interdisciplinary nature of the field and the diverse user base. It discusses design considerations, data types, and methods for effective visualization, as well as specific tools like NodeXL for analyzing social media networks. It also emphasizes the importance of visual perception and the various contexts in which visualizations can be applied across different sectors.


![Coded Agents – with UiPath SDK + LangGraph [Virtual Hands-on Workshop]](https://cdn.slidesharecdn.com/ss_thumbnails/codedagentsdeck-251215155422-5497c599-thumbnail.jpg?width=640&height=640&fit=bounds)


