Download as PDF, PPTX

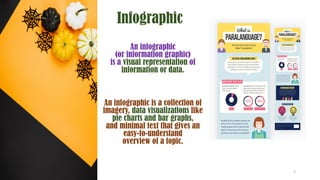
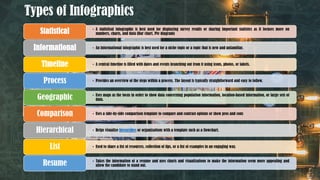
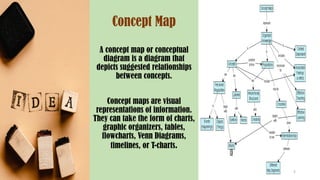
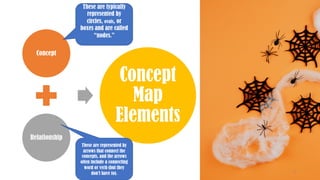
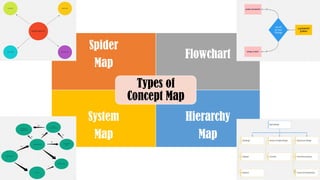
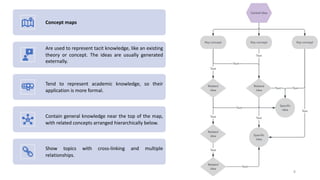
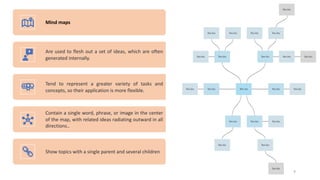


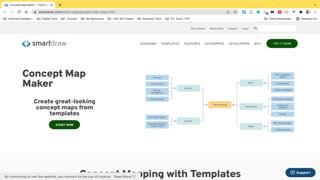
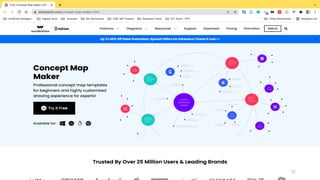
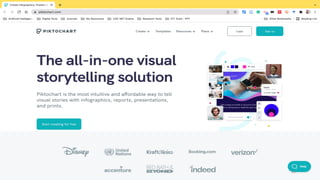

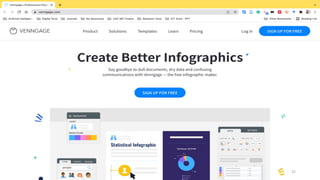


The document discusses infographics as visual representations of information, outlining various types such as statistical, informational, timeline, process, geographic, comparison, hierarchical, and resume infographics. It also introduces concept maps, which depict relationships between concepts using nodes and connections, and highlights the differences between concept maps and mind maps in terms of structure and purpose. Overall, it emphasizes the value of these tools in organizing and presenting information effectively.