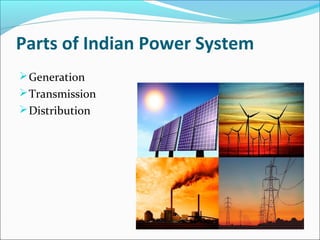
The document provides an overview of the Indian power system, including its generation, transmission, and distribution. Some key points:
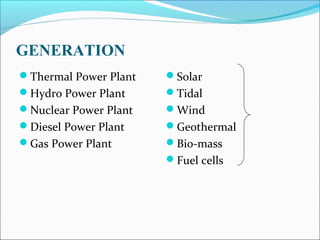
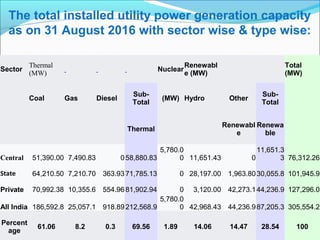
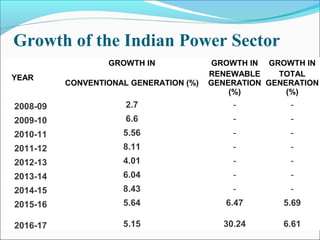
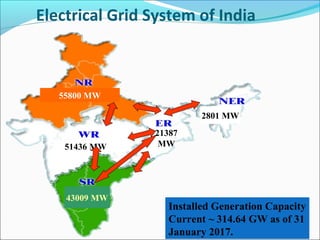
- India's peak power demand is around 159 GW with total installed capacity of 314.64 GW as of 2017. Thermal sources account for 69% of installed capacity.
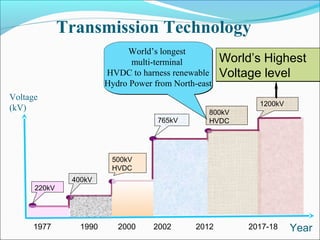
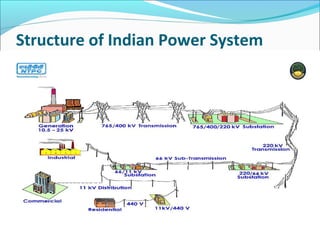
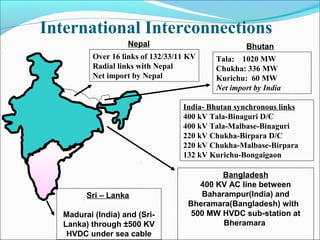
- The transmission system includes 765 kV, 400 kV, 220 kV, 132kV lines to transfer power across regions. A national grid was established to optimize resource utilization.
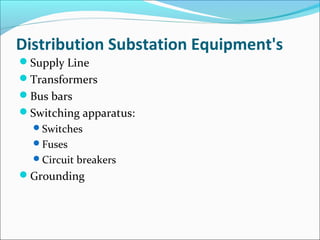
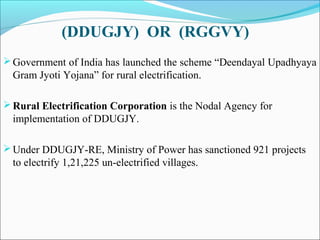
- Distribution systems distribute power at lower voltages like 66 kV and 33 kV to end consumers. Rural electrification programs aim to expand access across India.