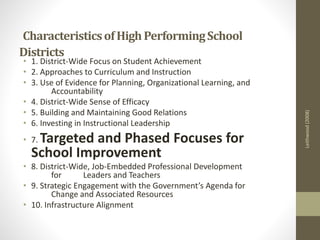
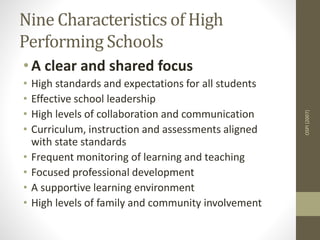
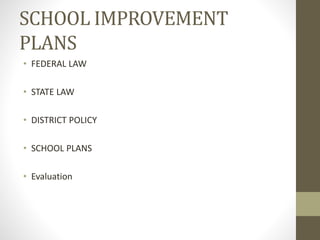
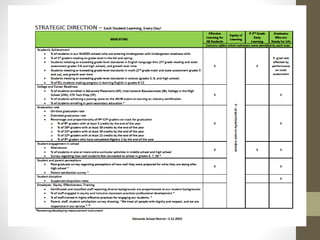
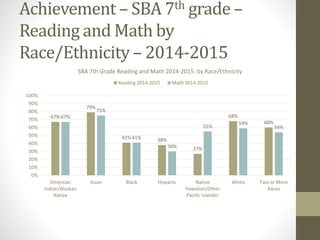
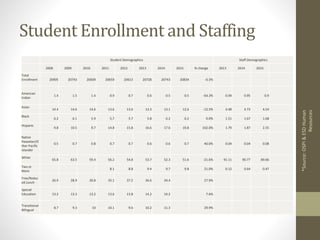
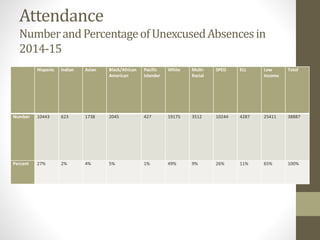
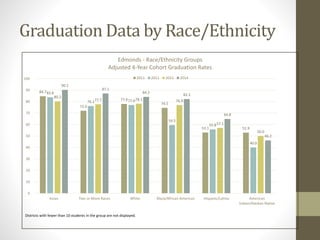
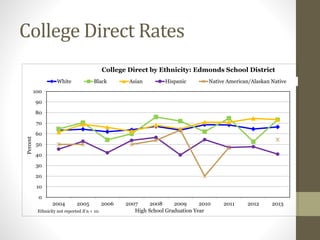
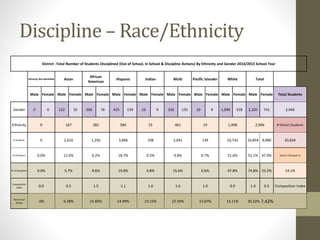
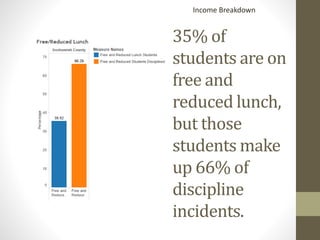
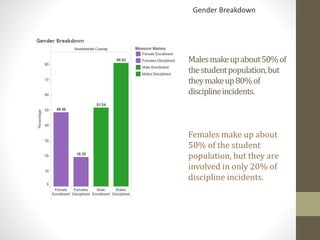
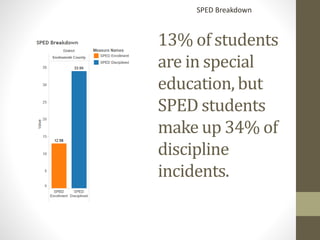
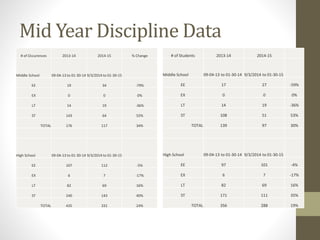
This document discusses using data to drive school improvement planning. It provides context on federal, state, and district requirements for school improvement plans. It highlights characteristics of high-performing schools and districts. The document also includes sample school data on achievement, attendance, graduation rates, discipline incidents, and mid-year discipline data comparisons. School improvement plans are intended to promote continuous improvement in student achievement.
Based on ERS research and experience, this presentation presents four strategies for urban districts that offer the most promise for systemic and sustainable impact to improve instruction.
Proposal by TAF (Technology Access Foundation) to scale our award winning TAF Academy 6th-12th grade STEM school by partnering with existing public schools in transforming them into schools where students can reach a high level of personal achievement
Charter schools currently serve 3 million students in more than 7,000 schools across 44 states and Washington, D.C. And their reach continues to grow: Since 2005, the number of charter schools in the U.S. has nearly doubled, and the number of charter students has nearly tripled.
Despite being an enduring presence in the nation’s education space, charter schools remain a topic of ongoing debate. The State of the Charter Sector provides the latest available information on charter schools across the country, including updated data on growth, performance, and geographic trends. It also includes analyses of the challenges that charter schools face and how the sector is trying to address them.
This comprehensive slide deck updates our 2015 State of the Charter School Movement, and together, these resources serve as a fact base to cut through the rhetoric that often accompanies conversations about charter schools.
The goal of this analysis is not to persuade, but to inform. As the charter sector continues to grow and improve, it needs a rigorous, evidence-based debate around its weaknesses and strengths. Accurate information is crucial for thoughtful policymaking and, ultimately, to ensuring all students have access to a high-quality education.
Karthik Muralidharan on research on achieving universal quality primary educa...Twaweza
A presentation by Prof. Karthik Muralidharan on research on achieving universal quality primary education in India. This was presented at the Commission for Science and Technology (COSTECH) in Dar es Salaam, Tanzania, on June 19, 2014, to an audience of researchers.
School surveys were introduced into the Young Lives research study in 2010 in order to capture detailed information about children’s experiences of schooling, and to improve our understanding of:
- the relationships between learning outcomes, and children's home backgrounds, gender, work, schools, teachers and class and school peer-groups.
- school effectiveness, by analysing factors explaining the development of cognitive and non-cognitive skills in school, including value-added analysis of schooling and comparative analysis of school-systems.
- equity issues (including gender) in relation to learning outcomes and the evolution of inequalities within education
This presentation gives details of the 2016 Survey.
The Challenges and Opportunities in School Transportation TodayJeremy Knight
Every day, America’s fleet of roughly 480,000 school buses transports more than a third of students to and from school. This fleet is more than twice the size of all other forms of mass transit combined, including bus, rail, and airline transportation.
President Donald Trump’s nomination of philanthropist and education advocate Betsy DeVos for Secretary of Education thrust Michigan education into the national spotlight. Because DeVos doesn’t have a track record as a government official or school system leader, her work in Michigan on education issues provides some of the only information about her track record and what she might do as Secretary. Yet, DeVos’ critics and her boosters alike are making a variety of claims about Michigan that are confusing and contradictory.
To help clarify some of these questions, a new analysis from Bellwether Education Partners provides a comprehensive look at the education policy landscape in Michigan.
Closing the gap: Shared Learnings and Shared ResponsibilitySFI-slides
Mary Jean Gallagher, Chief Student Achievement Officer of Ontario, præsentation fra SFI-konferencen "Skolen og det inkluderende samfund" den 18. november 2013.
You Want Us to Do WHAT????
Dr. Becky Blink, Data-Driven Instructional Solutions, LLC. WI
Fusion 2012, the NWEA summer conference in Portland, Oregon
Do you feel like your head is spinning with all the initiatives that have fallen into the field of education? This presentation will help you FUSE it all together MAP, common core, RTI, Odyssey (content partner to NWEA). Differentiated lesson plans will be shared; a newly designed template will be unveiled to help teachers create a plan for RTI intervention. These examples can provide you and your teachers with immediate practical applications to classroom instruction.
Learning Outcome:
- Participants will leave with an understanding of how to use MAP data to differentiate their universal classroom instruction.
- Participants will leave with an understanding of how to create their own lesson plan based on MAP data.
- Participants will leave with and overall concept of how MAP, RTI, common core standards, all fit together under one umbrella.
Audience:
- New data user
- Experienced data user
- Advanced data user
- District leadership
- Curriculum and Instruction
Euclid City Schools DLT Presentation Feb 9 2009tlysiak
This presentation was conducted by the Euclid City Schools' District Leadership team. Speakers were: Superintendent, Dr. Joffrey Jones, Principal, Dr. Charlie Smialek, Teachers Airel Townes and Margo Smolic, and State Support Team members Paula Woods and Ross May. The purpose of this presentation is to provide an overview of the actions the District Leadership Team has taken while examining data and forming goals.
The Importance of School District Leadership and Data Driven Decision Making ...NAFCareerAcads
This workshop will illustrate the importance of data-driven decision making in creating pathways to academic success. Further it will share insighs as to how to build district leadership buy in and support through integrating academies into a district strategic planning process.
With a major focus on character development and single gender instruction, PROFECTUS will prepare the youth of Northwest Jacksonville to be SHARP- Self-aware, Humble, Appreciative, Respectful and Persistent.
PROFECTUS will offer a well-rounded, K-12 single-gender program for males that will hold itself and its students accountable for meeting self-imposed goals, Common Core State Standards and all standards associated with preparing students for success in college.
Similar to Improvement through the use of data 2015 (20)
Read| The latest issue of The Challenger is here! We are thrilled to announce that our school paper has qualified for the NATIONAL SCHOOLS PRESS CONFERENCE (NSPC) 2024. Thank you for your unwavering support and trust. Dive into the stories that made us stand out!
Unit 8 - Information and Communication Technology (Paper I).pdfThiyagu K
This slides describes the basic concepts of ICT, basics of Email, Emerging Technology and Digital Initiatives in Education. This presentations aligns with the UGC Paper I syllabus.
2024.06.01 Introducing a competency framework for languag learning materials ...Sandy Millin
http://sandymillin.wordpress.com/iateflwebinar2024
Published classroom materials form the basis of syllabuses, drive teacher professional development, and have a potentially huge influence on learners, teachers and education systems. All teachers also create their own materials, whether a few sentences on a blackboard, a highly-structured fully-realised online course, or anything in between. Despite this, the knowledge and skills needed to create effective language learning materials are rarely part of teacher training, and are mostly learnt by trial and error.
Knowledge and skills frameworks, generally called competency frameworks, for ELT teachers, trainers and managers have existed for a few years now. However, until I created one for my MA dissertation, there wasn’t one drawing together what we need to know and do to be able to effectively produce language learning materials.
This webinar will introduce you to my framework, highlighting the key competencies I identified from my research. It will also show how anybody involved in language teaching (any language, not just English!), teacher training, managing schools or developing language learning materials can benefit from using the framework.
The Indian economy is classified into different sectors to simplify the analysis and understanding of economic activities. For Class 10, it's essential to grasp the sectors of the Indian economy, understand their characteristics, and recognize their importance. This guide will provide detailed notes on the Sectors of the Indian Economy Class 10, using specific long-tail keywords to enhance comprehension.
For more information, visit-www.vavaclasses.com
How to Create Map Views in the Odoo 17 ERPCeline George
The map views are useful for providing a geographical representation of data. They allow users to visualize and analyze the data in a more intuitive manner.
How to Make a Field invisible in Odoo 17Celine George
It is possible to hide or invisible some fields in odoo. Commonly using “invisible” attribute in the field definition to invisible the fields. This slide will show how to make a field invisible in odoo 17.
This is a presentation by Dada Robert in a Your Skill Boost masterclass organised by the Excellence Foundation for South Sudan (EFSS) on Saturday, the 25th and Sunday, the 26th of May 2024.
He discussed the concept of quality improvement, emphasizing its applicability to various aspects of life, including personal, project, and program improvements. He defined quality as doing the right thing at the right time in the right way to achieve the best possible results and discussed the concept of the "gap" between what we know and what we do, and how this gap represents the areas we need to improve. He explained the scientific approach to quality improvement, which involves systematic performance analysis, testing and learning, and implementing change ideas. He also highlighted the importance of client focus and a team approach to quality improvement.
2. Patrick Murphy
• Assistant Superintendent Edmonds School District
• Former Executive Director of Secondary Schools in Issaquah
School District
• Middle School Principal
• High School Assistant Principal
• Junior High Assistant Principal
• Social Studies and Language Arts Teacher
Introduction – What you do and why you are considering
becoming an educational administrator?
5. Federal-Title 1— ImprovingThe Academic
AchievementOf The Disadvantaged
• PRIORITY- The State educational agency, in allocating funds to
local educational agencies under this section, shall give
priority to local educational agencies that —
• (1) serve the lowest-achieving schools;
• (2) demonstrate the greatest need for such funds; and
• (3) demonstrate the strongest commitment to ensuring that
such funds are used to enable the lowest-achieving schools to
meet the progress goals in school improvement plans under
section 1116 (b)(3)(A)(v).
6. STATE - WAC 180-16-220
• Evidence and date of annual school board approval.
•
• Evidence staff certification requirements were met.
•
• Evidence the plan is based on self-review and participation of required participants (staff,
students, families, parents, and community members).
•
• Brief summary of use of data to establish improvement.
•
• Plan promotes continuous improvement in student achievement of state learning goals and
essential academic learning requirements (EALRs).
•
• Recognition of non-academic student learning, what, and how.
•
• Plan addresses characteristics of successful schools.
•
• Plan addresses educational equity (gender, race, ethnicity, culture, language, and physical/mental
ability).
•
• Plan addresses use of technology to facilitate instruction.
•
• Plan addresses parent, family, and community involvement
7. CharacteristicsofHigh PerformingSchool
Districts
• 1. District-Wide Focus on Student Achievement
• 2. Approaches to Curriculum and Instruction
• 3. Use of Evidence for Planning, Organizational Learning, and
Accountability
• 4. District-Wide Sense of Efficacy
• 5. Building and Maintaining Good Relations
• 6. Investing in Instructional Leadership
• 7. Targeted and Phased Focuses for
School Improvement
• 8. District-Wide, Job-Embedded Professional Development
for Leaders and Teachers
• 9. Strategic Engagement with the Government’s Agenda for
Change and Associated Resources
• 10. Infrastructure Alignment
Leithwood(2008)
8. Nine Characteristics of High
Performing Schools
• A clear and shared focus
• High standards and expectations for all students
• Effective school leadership
• High levels of collaboration and communication
• Curriculum, instruction and assessments aligned
with state standards
• Frequent monitoring of learning and teaching
• Focused professional development
• A supportive learning environment
• High levels of family and community involvement
OSPI(2007)
9. Now that you Know Your Goals
•How Do You Measure
IT?
11. • Effective Learning for All
Students
Each student is engaged in
meaningful and relevant
learning, every day. We
provide comprehensive
educational programs and a
wide variety of activities that
build a solid foundation of
knowledge and skills,
encourage mindful higher-
level thinking, and inspire all
students to pursue their
interests.
• Equity of Opportunity
Each student experiences a
diverse, inclusive culture
where all people are valued.
Adults work to meet students’
individual needs and remove
institutional and social
barriers to their personal
success.
Our StrategicDirection(Our ‘True North’)
12. • P – 3rd Grade Early
Learning
Each student has a
supportive, equitable
educational foundation
and is on track to be
performing at grade level
by third grade. We work
closely with families and
community partners to
connect and align our
schools with local
resources to maximize
early learning.
• Graduates Who Are
Ready for Life
Each student is equipped
with the knowledge and
skills needed to be
resilient, participating
citizens who are
prepared to pursue and
accomplish educational,
life, and work-related
interests after high
school.
Our Strategic Direction (Our
‘True North’)
15. • Will drive and inform
board reports by
Supt. Staff
• Will drive and inform
conversations around
SIP’s between
principals and Asst.
Supts.
• Will drive and inform
the SD Work Groups
Strategic Direction Indicators
19. Hispanic Indian Asian Black/African
American
Pacific
Islander
White Multi-
Racial
SPED ELL Low
Income
Total
Number 10443 623 1738 2045 427 19175 3512 10244 4287 25411 38887
Percent 27% 2% 4% 5% 1% 49% 9% 26% 11% 65% 100%
Attendance
NumberandPercentageofUnexcusedAbsencesin
2014-15
20. 84.7
72.0
77.9
74.5
53.1 52.9
83.8
76.1 77.0
59.5
55.8
40.0
80.2
77.7 78.1 76.9
57.1
50.0
90.2
87.1
84.2
82.2
64.8
46.2
0
10
20
30
40
50
60
70
80
90
100
Asian Two or More Races White Black/African American Hispanic/Latino American
Indian/Alaskan Native
Edmonds - Race/Ethnicity Groups
Adjusted 4-Year Cohort Graduation Rates
2011 2012 2013 2014
Districts with fewer than 10 students in the group are not displayed.
Graduation Data by Race/Ethnicity
21. 0
10
20
30
40
50
60
70
80
90
100
2004 2005 2006 2007 2008 2009 2010 2011 2012 2013
Percent
High School Graduation Year
College Direct by Ethnicity: Edmonds School District
White Black Asian Hispanic Native American/Alaskan Native
Ethnicity not reported if n < 10.
College Direct Rates
22. District -Total Number of Students Disciplined (Out of School, In School & Discipline Actions) By Ethnicity and Gender 2014/2015 School Year
Ethnicity Not identified Asian
African
American
Hispanic Indian Multi Pacific Islander White Total
Male Female Male Female Male Female Male Female Male Female Male Female Male Female Male Female Male Female Total Students
Gender 0 0 132 35 206 76 425 159 16 9 326 135 10 9 1,090 318 2,205 741 2,946
Ethnicity 0 167 282 584 25 461 19 1,408 2,946 # District Students
# students 0 2,616 1,292 3,896 108 2,041 139 10,742 10,854 9,980 20,834
% of District 0.0% 12.6% 6.2% 18.7% 0.5% 9.8% 0.7% 51.6% 52.1% 47.9% District Discipine %
% of Discipline 0.0% 5.7% 9.6% 19.8% 0.8% 15.6% 0.6% 47.8% 74.8% 25.2% 14.1%
Composition
Index 0.0 0.5 1.5 1.1 1.6 1.6 1.0 0.9 1.4 0.5 Composition Index
Percent of
Group 0% 6.38% 21.83% 14.99% 23.15% 22.59% 13.67% 13.11% 20.32% 7.42%
Discipline – Race/Ethnicity
23. 35% of
students are on
free and
reduced lunch,
but those
students make
up 66% of
discipline
incidents.
Income Breakdown
25. 13% of students
are in special
education, but
SPED students
make up 34% of
discipline
incidents.
SPED Breakdown
26. • GUIDING PRINCIPLE 2: CLEAR, APPROPRIATE, AND CONSISTENT EXPECTATIONS AND
CONSEQUENCES
• Schools that have discipline policies or codes of conduct with clear, appropriate, and consistently
applied expectations and consequences will help students improve behavior, increase
engagement, and boost achievement.
• 1. Each secondary school should have a designated space and staff resource to implement an In-
school suspension program to replace currently assigned out of school suspensions. In those
instances of non-violent transgressions, or ones that do not pose a safety risk to staff or students,
in-school suspension should be the preferred alternative to out of school.
• 2. The school district should produce a “district” student handbook that lists consistent definitions
of behavior violations and expected consequences. The district handbook will be a key measure in
ensuring equity of application of discipline across schools.
• 3. After school detention and community service should be a first option for non-violent, non-
safety behavior violations. They should be educational in nature and help students feel more
connected to their school and community. Parents should always be notified prior to such
assignment to help better ensure attendance and prevent greater consequences.
• 4. Truancy and attendance related violations should never result in suspension.
• 5. Suspension should be recognized as the disciplinary measure “of last resort” and should only be
used in cases of safety matters or substantial disruption to the educational environment.
EdmondsSchoolDistrict
AlternativestoSuspensionCommittee
FINALRECCOMENDATIONS
27. Mid Year Discipline Data
# of Occurences 2013-14 2014-15 % Change
Middle School 09-04-13 to 01-30-14 9/3/2014 to 01-30-15
EE 19 34 -79%
EX 0 0 0%
LT 14 19 -36%
ST 143 64 55%
TOTAL 176 117 34%
High School 09-04-13 to 01-30-14 9/3/2014 to 01-30-15
EE 107 112 -5%
EX 6 7 -17%
LT 82 69 16%
ST 240 143 40%
TOTAL 435 331 24%
# of Students 2013-14 2014-15
Middle School 09-04-13 to 01-30-14 9/3/2014 to 01-30-15
EE 17 27 -59%
EX 0 0 0%
LT 14 19 -36%
ST 108 51 53%
TOTAL 139 97 30%
High School 09-04-13 to 01-30-14 9/3/2014 to 01-30-15
EE 97 101 -4%
EX 6 7 -17%
LT 82 69 16%
ST 171 111 35%
TOTAL 356 288 19%
28. Edmonds 7010 - School Improvement
Plans for Principals and Instructional
Managers
• It is the policy of the Edmonds School District to require each school to
develop and adopt a school improvement plan that includes an annual
review process. Each school shall submit its plan to the Edmonds School
Board by October 1 of each year for initial approval and annual review.
• Each school improvement plan shall reflect the use of student
performance data and shall promote a positive impact on student
learning. (A positive impact on student learning means promoting the
continuous achievement of the state learning goals and essential
academic learning requirements, and the achievement of nonacademic
growth in areas like public speaking, leadership, interpersonal
relationship skills, team work, self-confidence and resiliency, so that
students can meet the goals of Washington's basic education system: to
become responsible citizens, to contribute to their own economic well-
being and that of their families and communities, and to enjoy
productive and satisfying lives.)
• Each school improvement plan shall be based on a building self-review
that includes the active participation and input of building staff,
students, parents, and community members.
29. Puyallup Policy 2010
• School Improvement Planning
•
School improvement planning is the process schools use to ensure
that all students are achieving at high levels. All schools can become
better environments so that more students are successful. Annual
yearly progress of public schools is essential in providing increased
student performance and quality results. Innovative and research-
based programs, coupled with staff development, focused and
aligned resources, and public participation in planning, are critical
factors in improving schools.
• The Comprehensive School Improvement Plan developed by each
team shall be reviewed by the building principal before being
submitted to their Executive Directors of Elementary Education or
Secondary Education. If the principal does not approve the plan, he
or she shall work with the CSIP Team until consensus is achieved.
The Executive Directors may refer a plan back to the CSIP Team with
recommendations for change. When approved, the plan shall be
monitored and reviewed on an ongoing basis by the principal in
collaboration with staff. The plan will also be reviewed periodically
with the Executive Directors and other members of the K-12
Education Department.
30. Edmonds Template
Does it meet or have the potential to meet the state criteria
(WAC)?
Will this result in improved student learning?
31. Principal Evaluation-AWSP
Framework
• Criterion 3 | Planning with Data
Leading the development,
implementation and evaluation of
a data-driven plan for increasing
student achievement, including
the use of multiple student data
elements.
32. Planning with Data
3.1Recognizes and seeks out multiple data sources
3.2 Analyzes and interprets multiple data sources to inform school-
level improvement efforts
3.3Implements data driven plan for improved teaching and learning
3.4Assists staff to use data to guide, modify and improve classroom
teaching and student learning
3.5Provides evidence of student growth that results from the school
improvement planning process*
*Student Growth Scoring Area
33. 3.1Recognizes and seeks out
multiple data sources
• Systematically collects valid and reliable data from at least
three sources to be used in problem solving and decision
making; builds capacity of staff to recognize information as
data by providing examples of using data throughout the
building and in staff meetings; systematically gathers data on
grades, attendance, behavior and other variables to inform
efforts
34. 3.2 Analyzes and interprets multiple
data sources to inform school-level
improvement efforts
Analysis includes multiple years of data, including state, district,
school and formal and informal classroom assessments;
interprets available data to make informed decisions about
strengths and areas of need; provides teacher teams with
previous year’s data and asks them to assess students’ current
needs .
35. 3.3Implements data driven plan for
improved teaching and learning
• Provides leadership such that plan is clearly articulated and
includes action steps and progress monitoring strategies, and
strategies in the plan are directly aligned with the data
analysis process and are research based; leads ongoing review
of progress and results to make timely adjustments to the
plan; data insights are regularly the subject of faculty
meetings and professional development sessions
36. 3.4 Assists staff to use data to guide,
modify and improve classroomteaching
and student learning
Regularly assists staff to use multiple types of data to reflect on
effectiveness of lessons, guide lesson and assessment
development, differentiate instruction (highly achieving as well
as non-proficient) and to determine whether re-teaching,
practice or moving forward with instruction is appropriate at
both the group and individual level; strategies result in clear
relationship between the actions of teachers and the impact on
student achievement
37. 3.5Providesevidenceof student growth
that resultsfrom the school improvement
planning process*
School improvement planning process results in measurable
improvement in student academic growth
38. School Improvement
• It’s a process, not an event
• Should not be an exercise in compliance
• We don’t finish the “SIP” so we can get back to the “real
work”. It IS the work.
• It can’t just sit on a shelf
• If anyone asks you what your school is all about and you do
not reference your school improvement plan, something is not
right.
• It should tie together all the work you are doing in school – to
dispel this idea that there are too many initiatives and they
are not connected