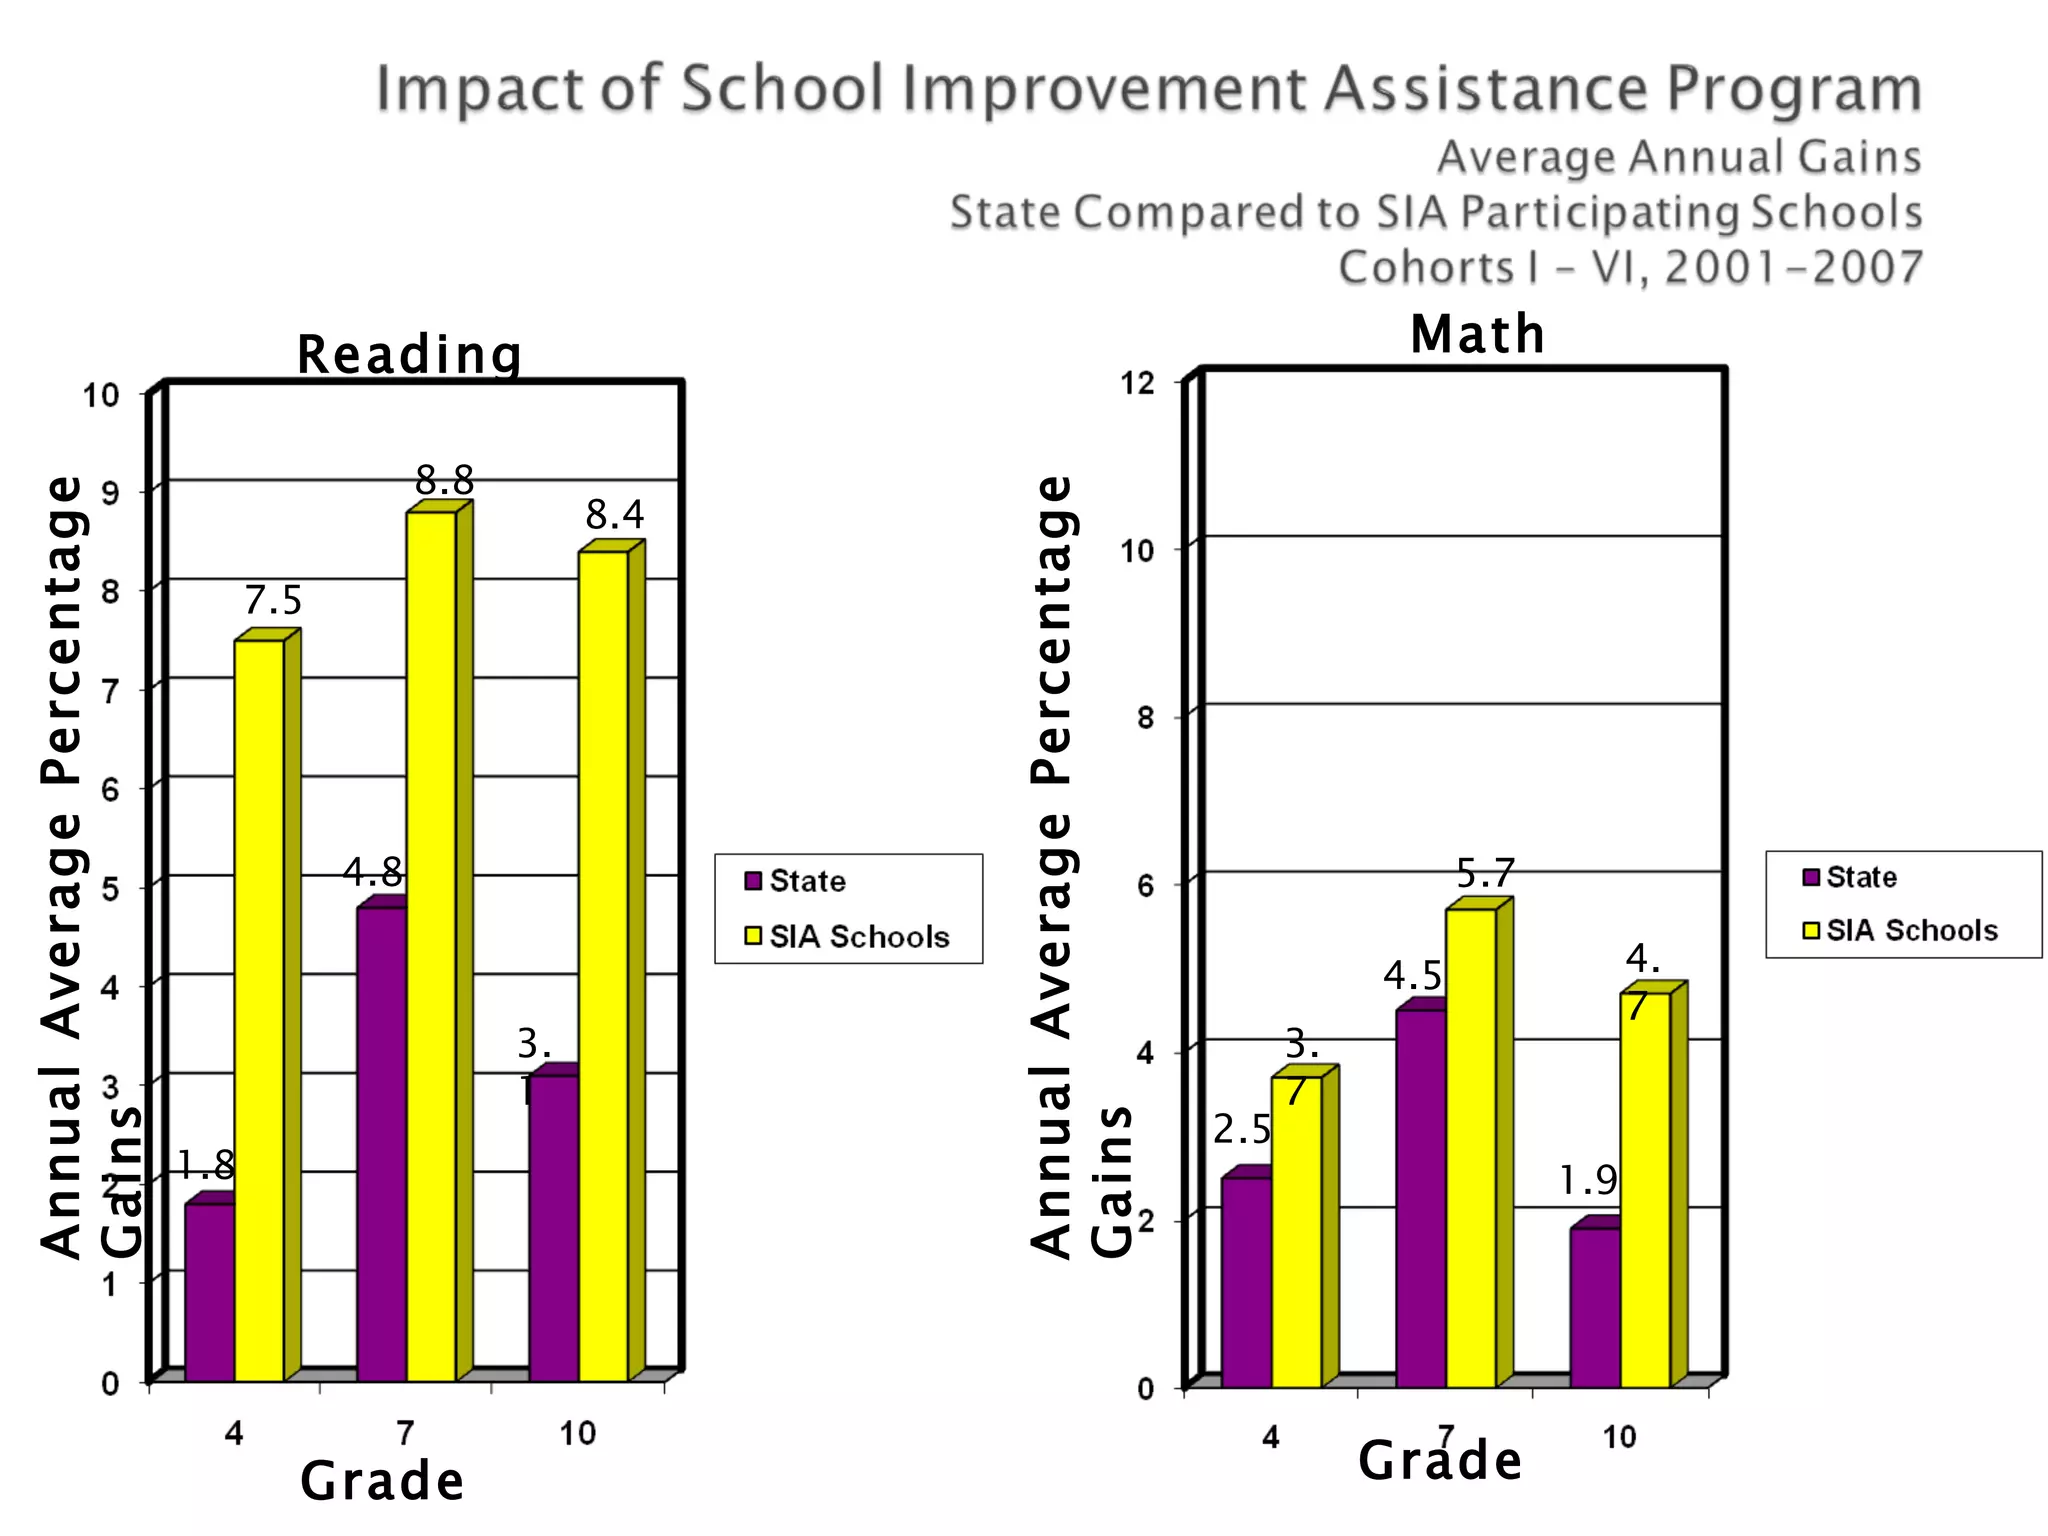
School Improvement
... isthe single most important business
of the school. It is the process schools
use to ensure that all students are
achieving at high levels.
School Improvement Planning Process Guide
http://www.k12.wa.us/SchoolImprovement/Resou
rces/default.aspx
Where the SIA-SIPprogram/process did
not result in improved student learning,
sustained over time, what might be some
reasons for the lack of positive change?
7.
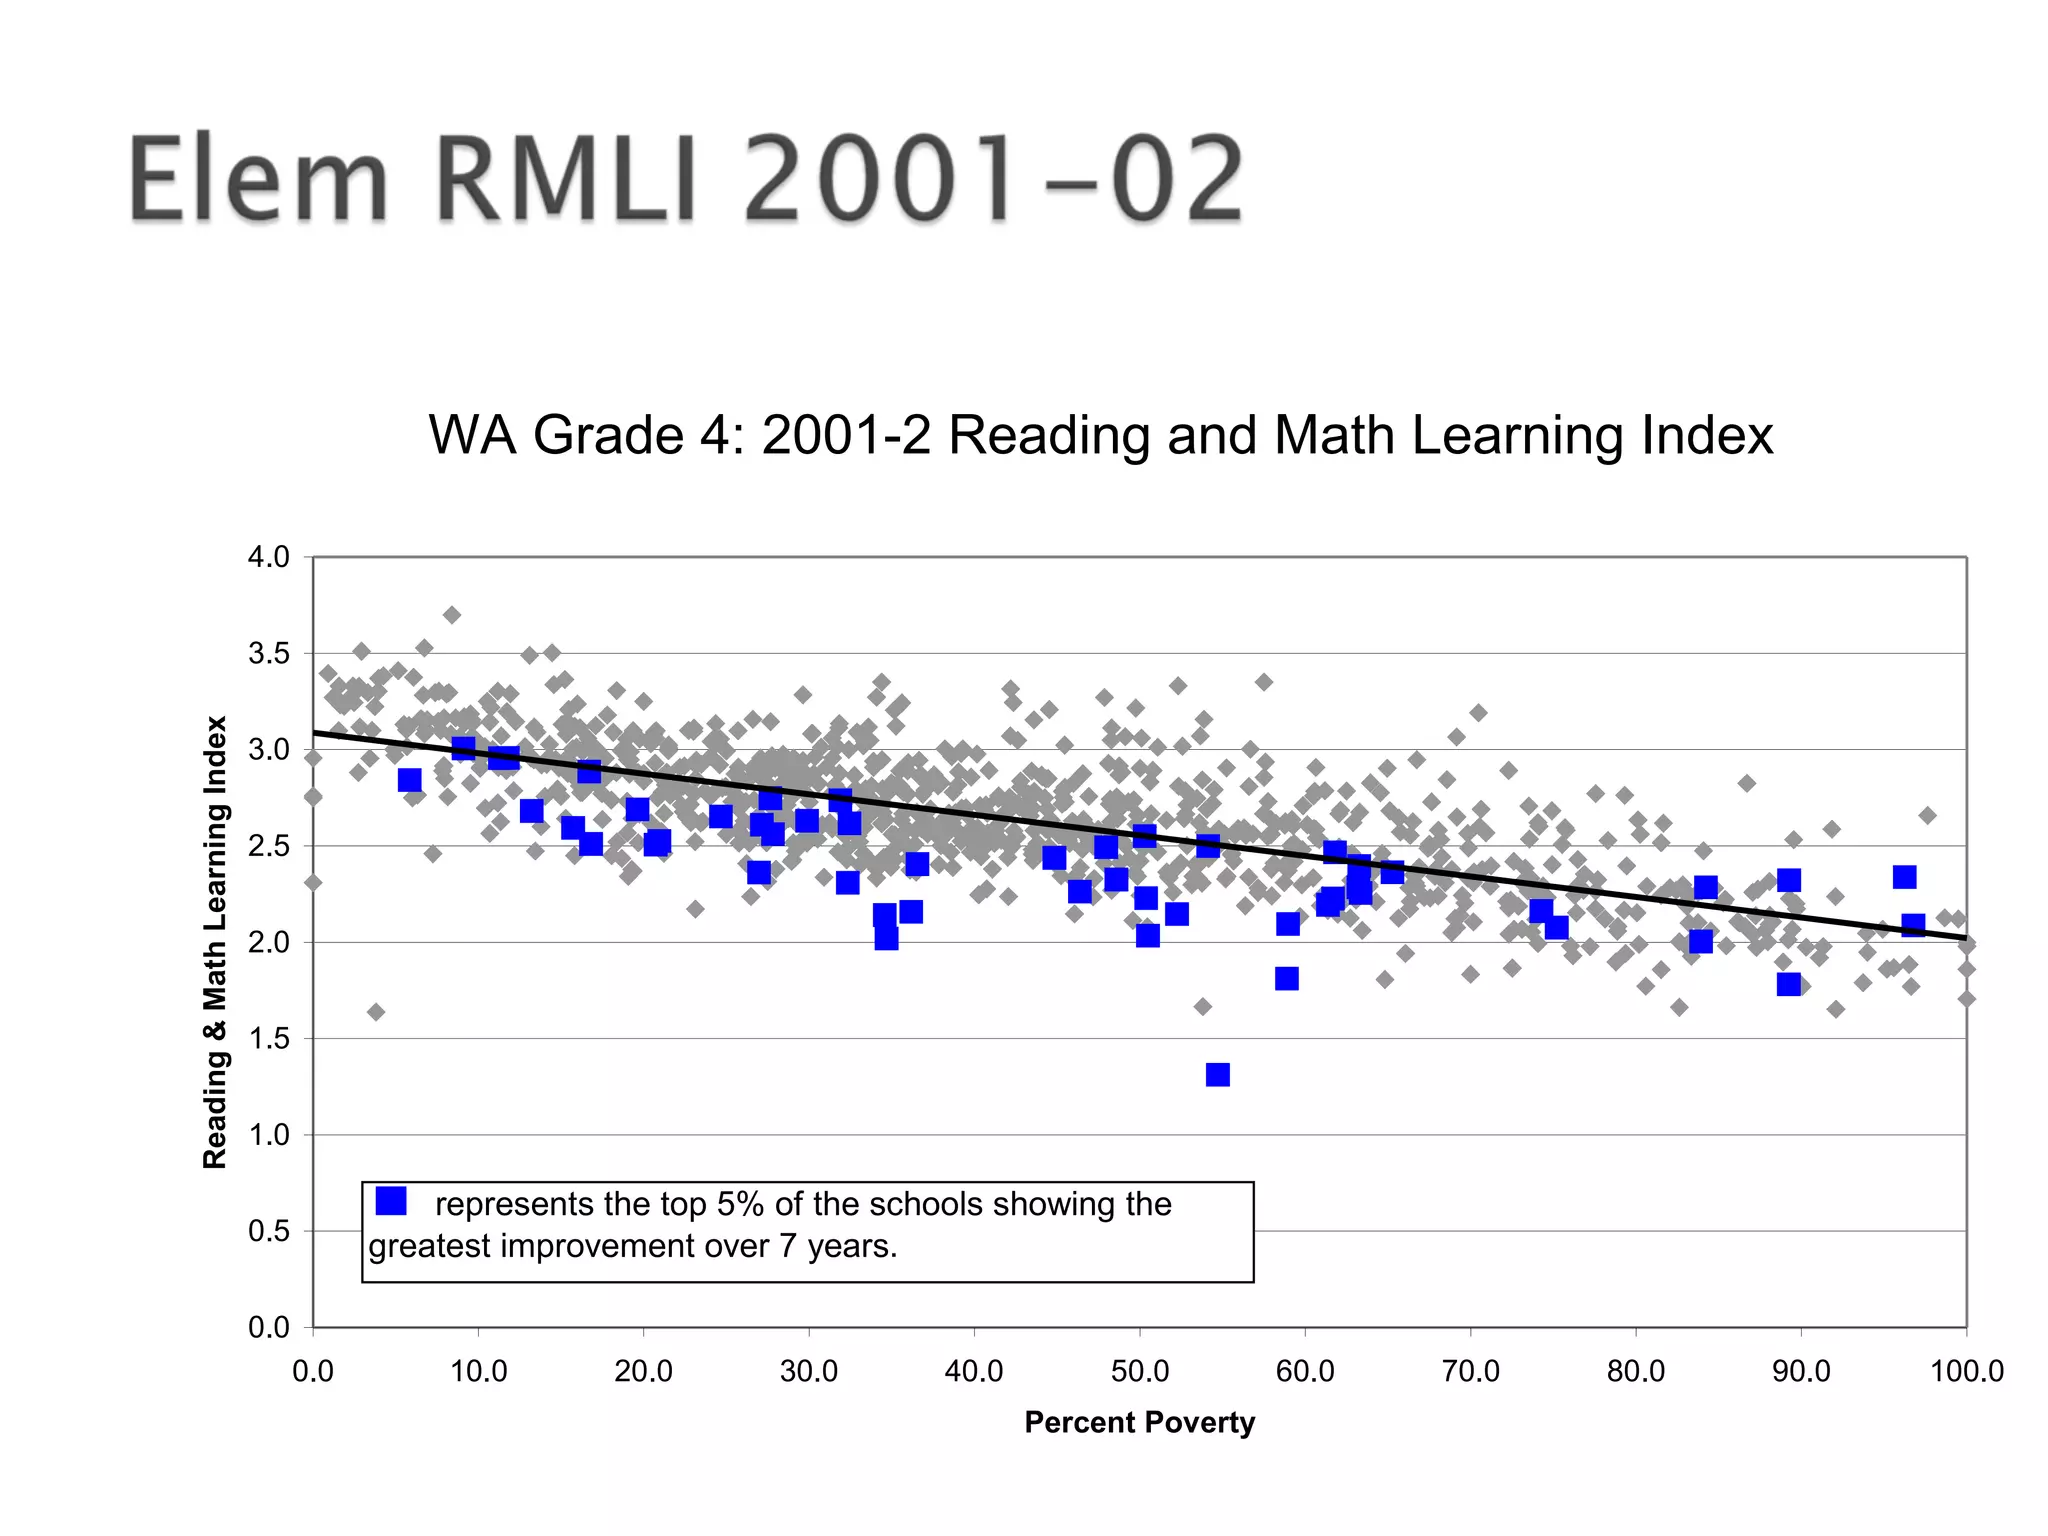
WA Grade 4:2001-2 Reading and Math Learning Index
0.0
0.5
1.0
1.5
2.0
2.5
3.0
3.5
4.0
0.0 10.0 20.0 30.0 40.0 50.0 60.0 70.0 80.0 90.0 100.0
Percent Poverty
Reading&MathLearningIndex
represents the top 5% of the schools showing the
greatest improvement over 7 years.
8.
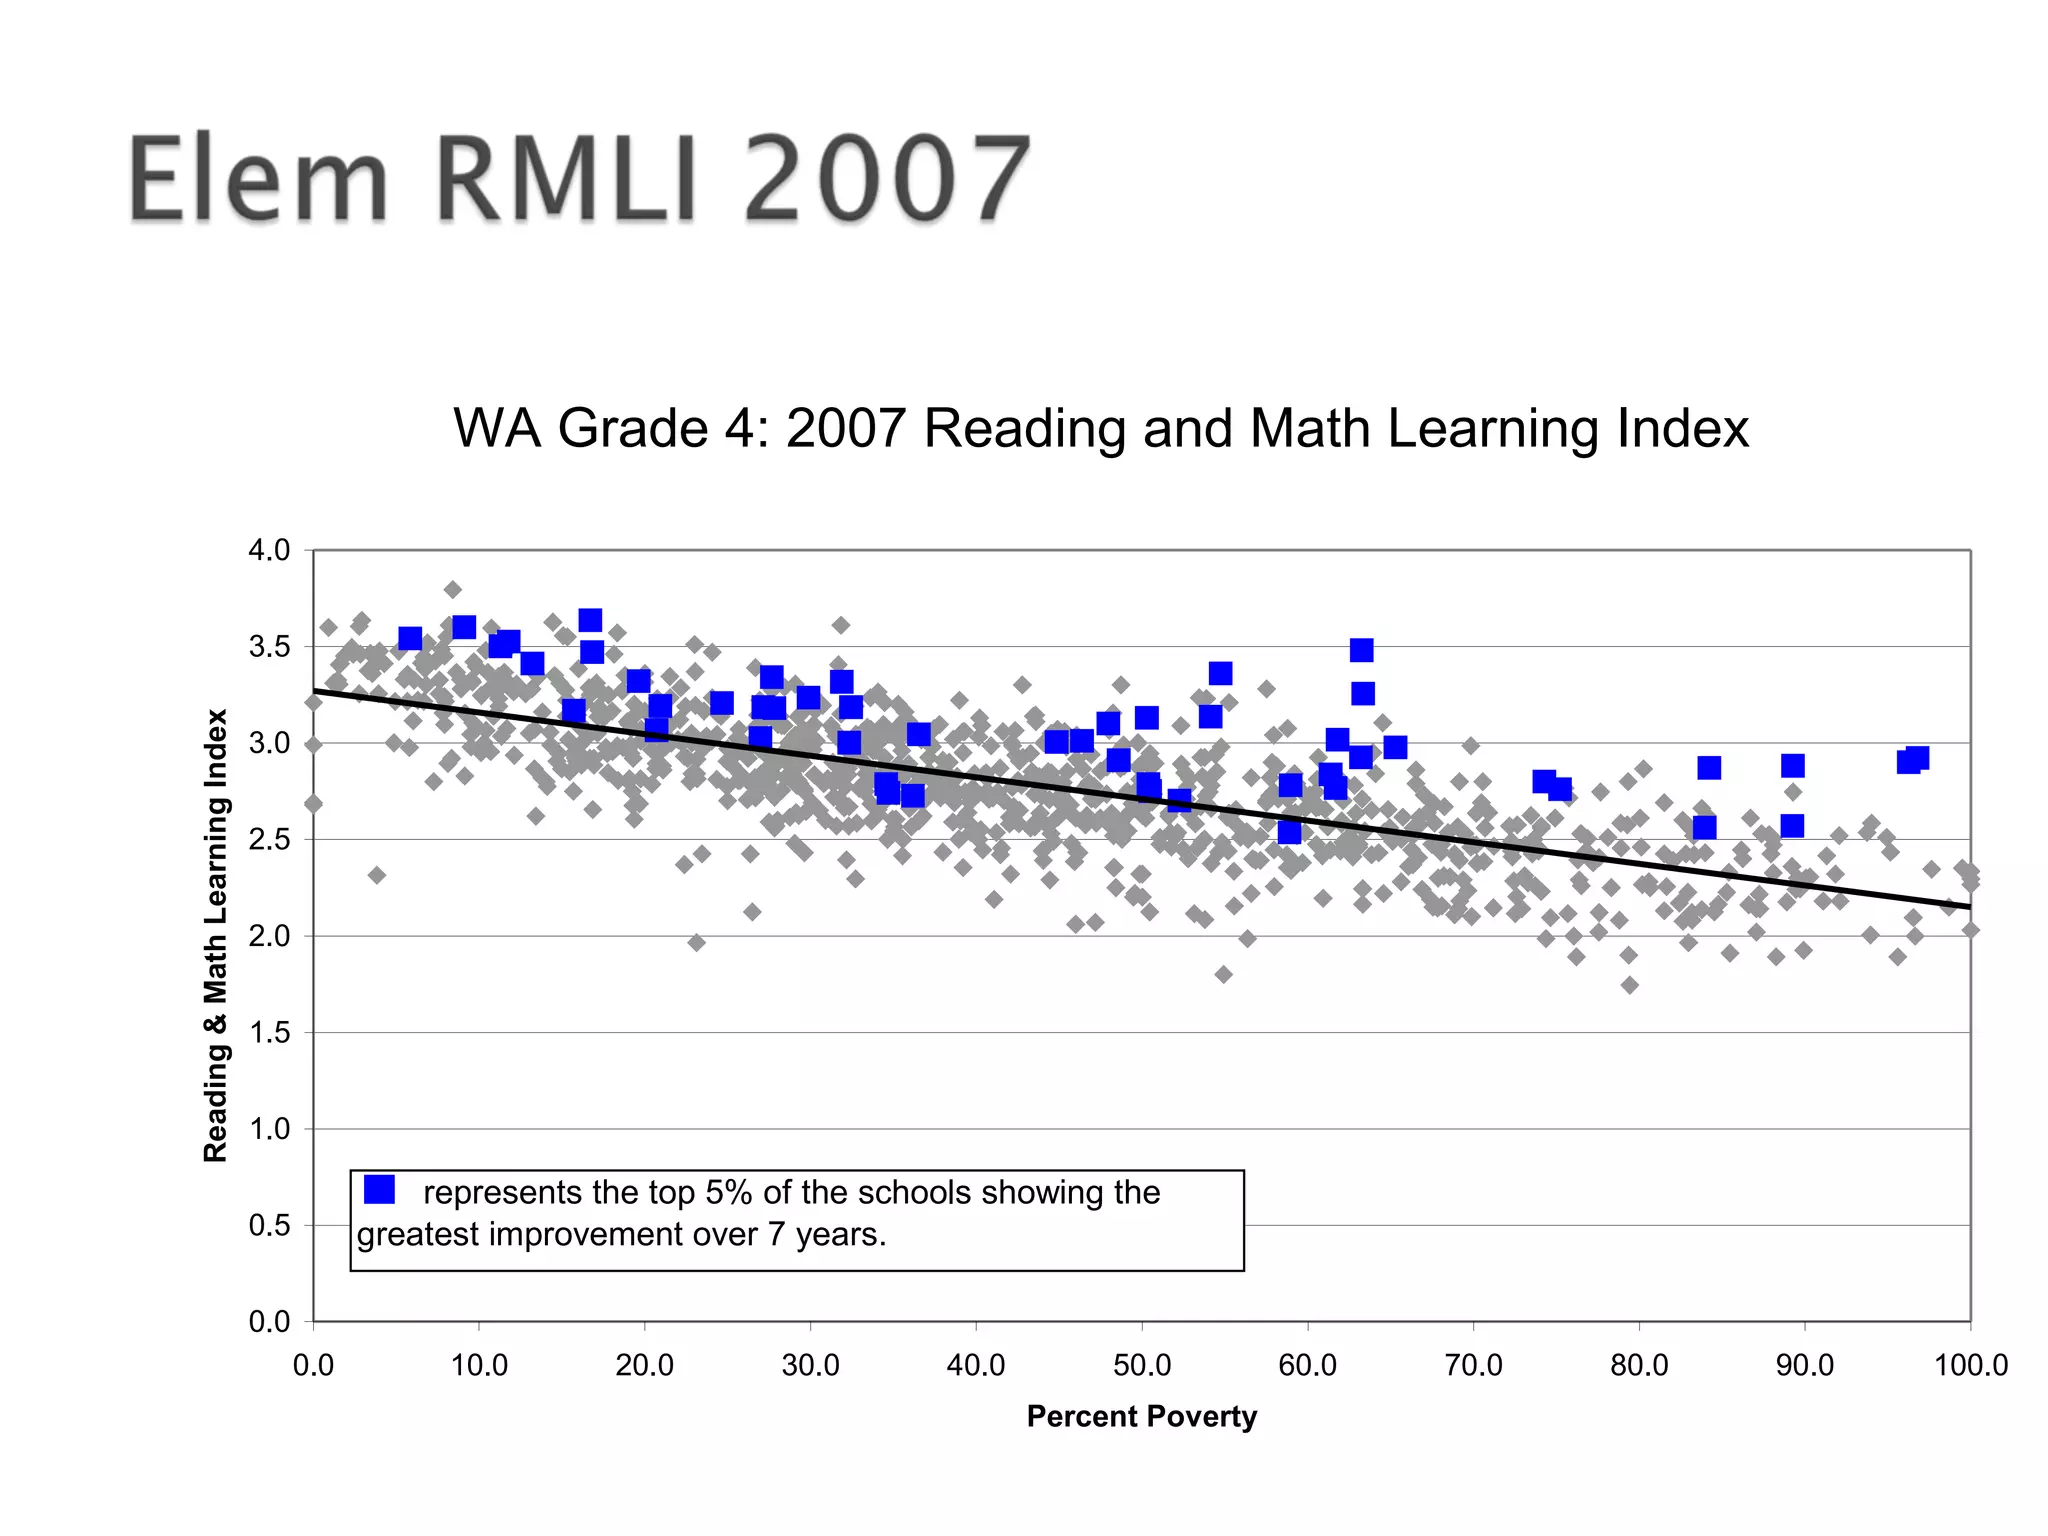
WA Grade 4:2007 Reading and Math Learning Index
0.0
0.5
1.0
1.5
2.0
2.5
3.0
3.5
4.0
0.0 10.0 20.0 30.0 40.0 50.0 60.0 70.0 80.0 90.0 100.0
Percent Poverty
Reading&MathLearningIndex
represents the top 5% of the schools showing the
greatest improvement over 7 years.
10.
• What isthe connection of LEADERSHIP
to IMPLEMENTATION?
11.
It’s not thatleadership
makes a
difference-----it IS the
difference!
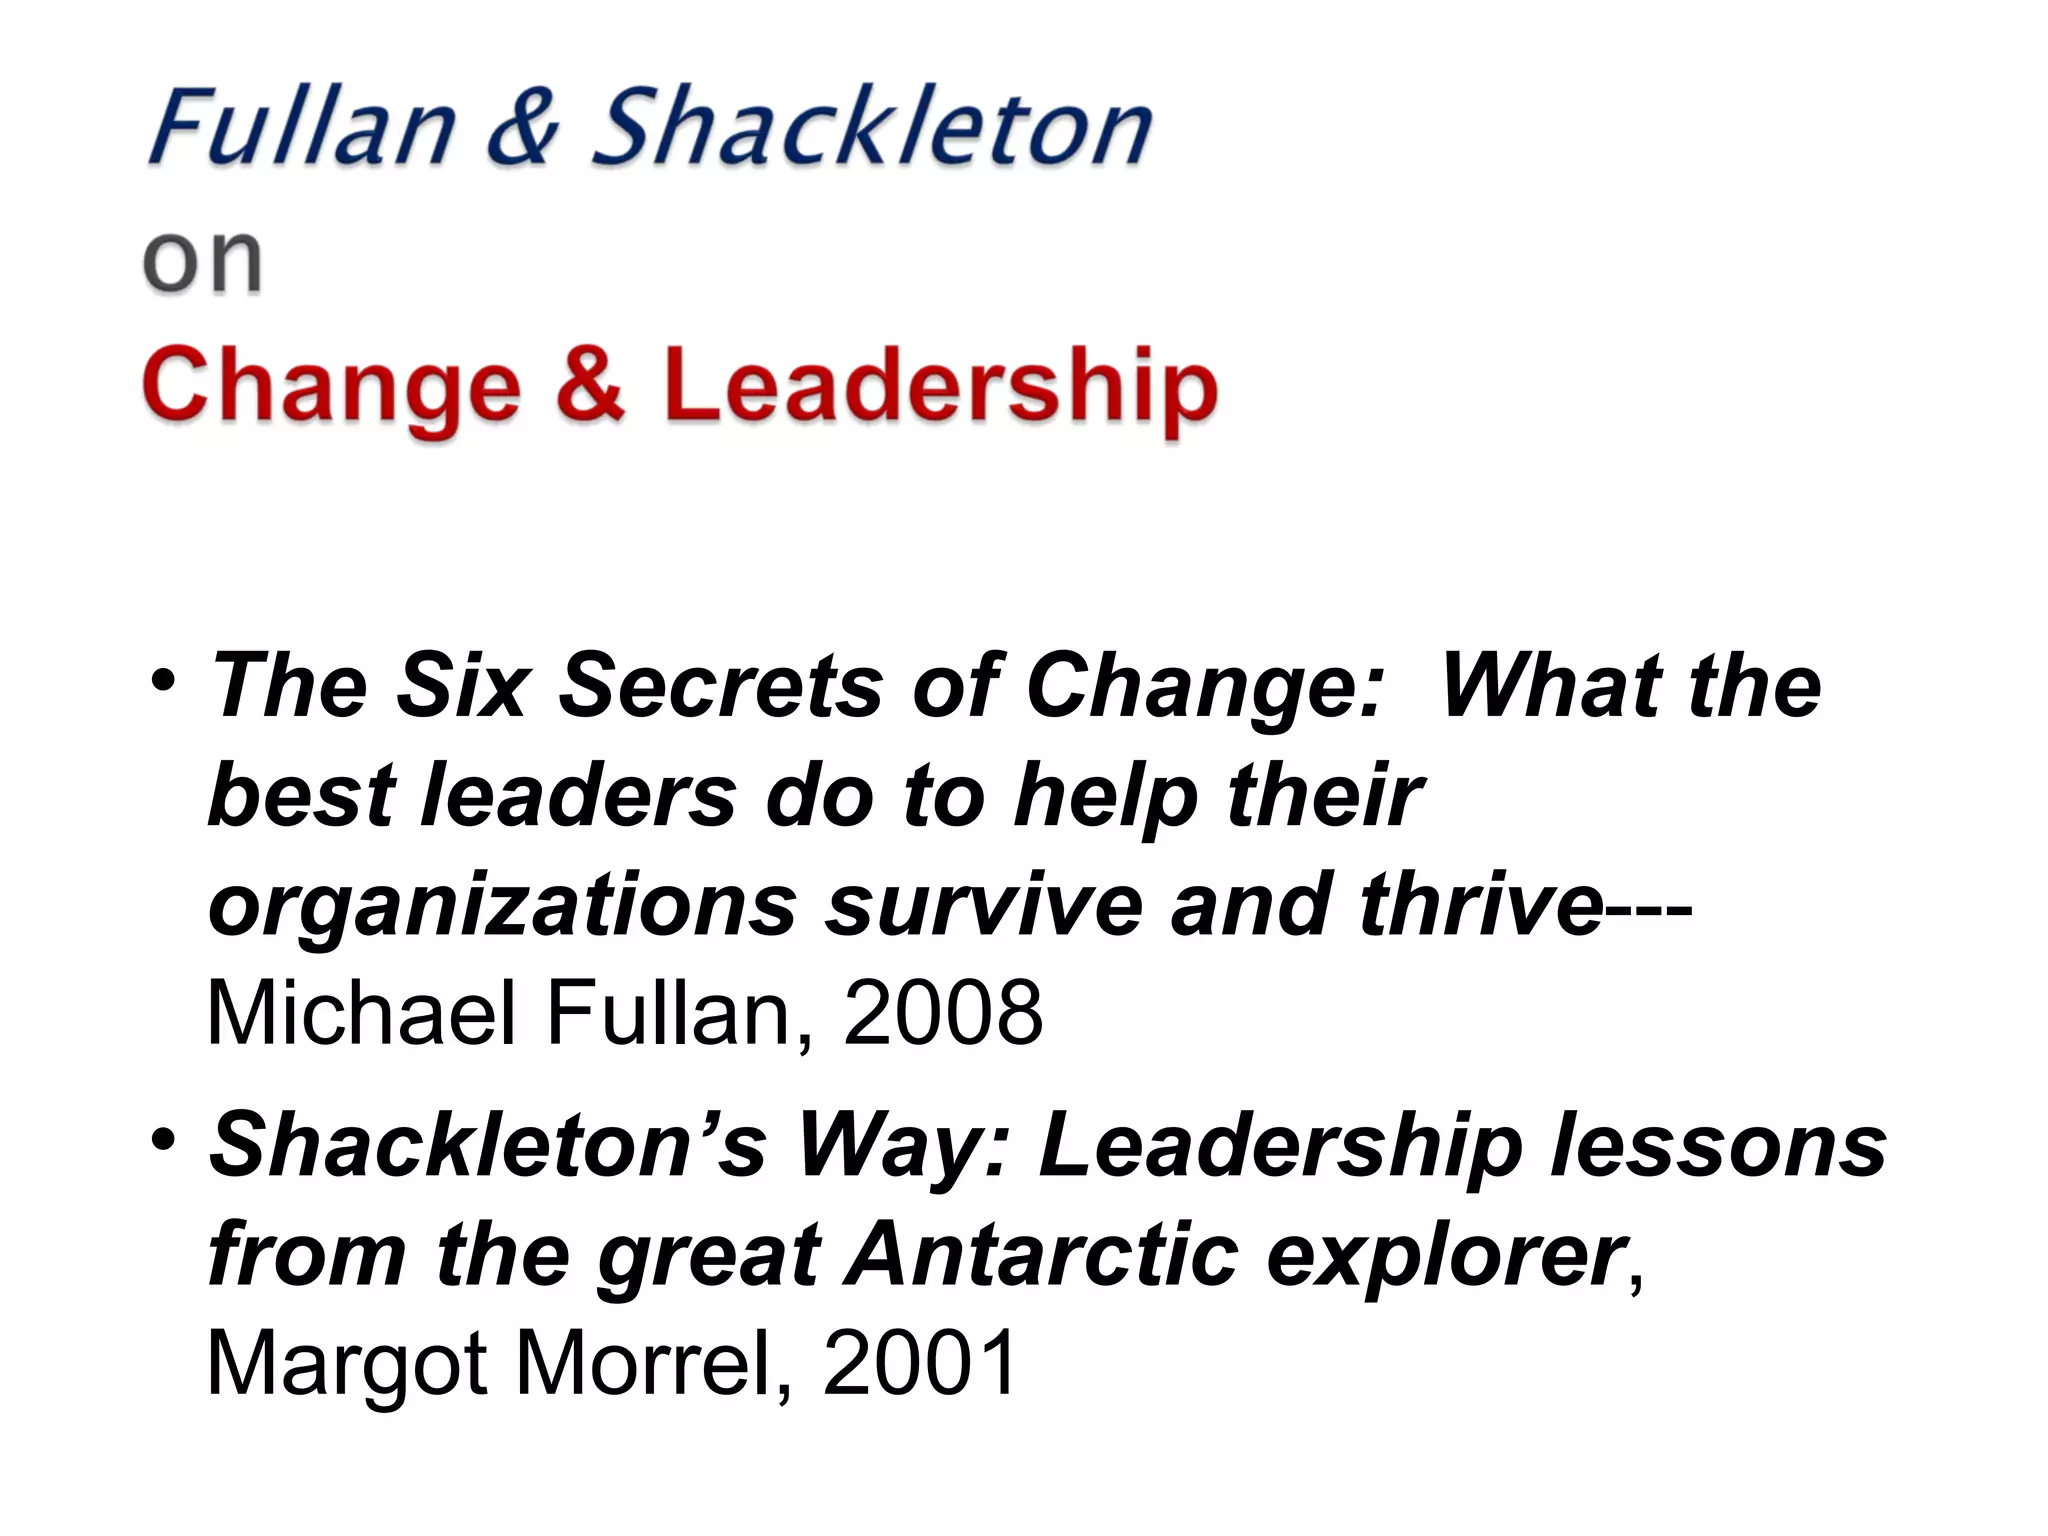
12.
• The SixSecrets of Change: What the
best leaders do to help their
organizations survive and thrive---
Michael Fullan, 2008
• Shackleton’s Way: Leadership lessons
from the great Antarctic explorer,
Margot Morrel, 2001
13.
He has beencalled "The greatest leader that
ever came on God's earth, bar none," yet he
never led a group larger than 27, he failed to
reach nearly every goal he ever set, and, until
recently, he had been little remembered after
his death. But once you learn the story of Sir
Ernest Shackleton and his remarkable
Antarctic expedition of 1914-1916 you'll
come to agree with the effusive praise of
those under his command. He is a model of
great leadership and, in particular, a master
of guidance in crisis.
Improving schools requirecollaborative
cultures…. Without collaborative skills
and relationships, it is not possible to learn
and to continue to learn as much as you
need to know to improve.
Michael Fullan
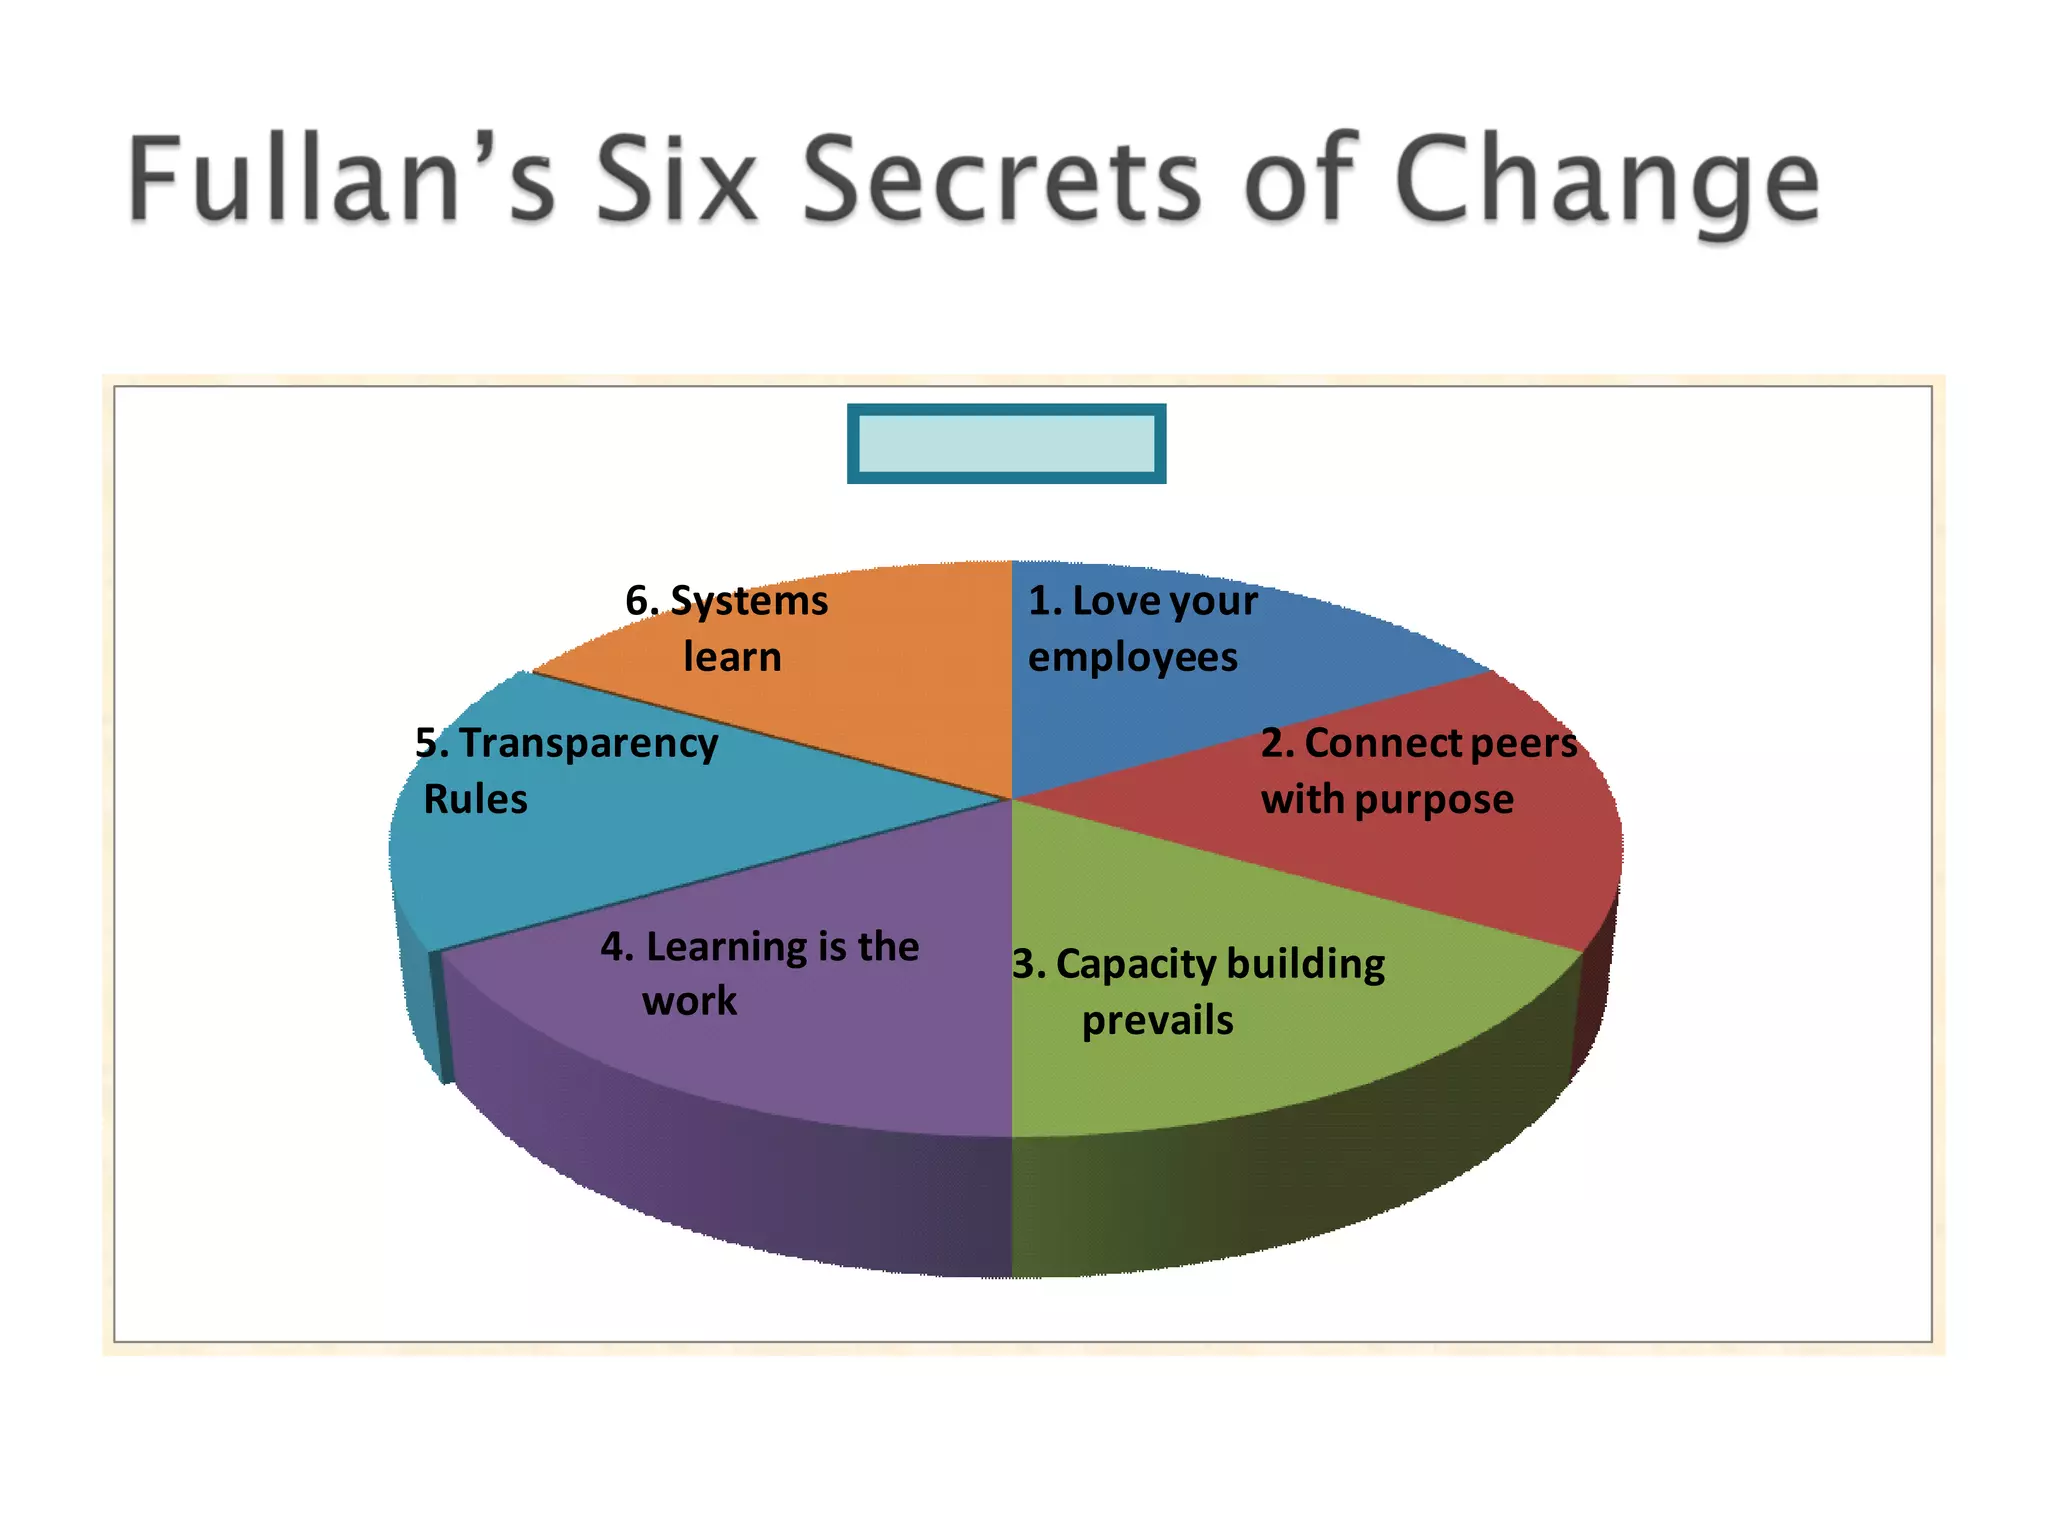
16.
Column1
1. Love your
employees
2.Connectpeers
with purpose
3. Capacity building
prevails
5. Transparency
Rules
6. Systems
learn
4. Learning is the
work
17.
Which one ofthe six factors resonates with
you? Why?
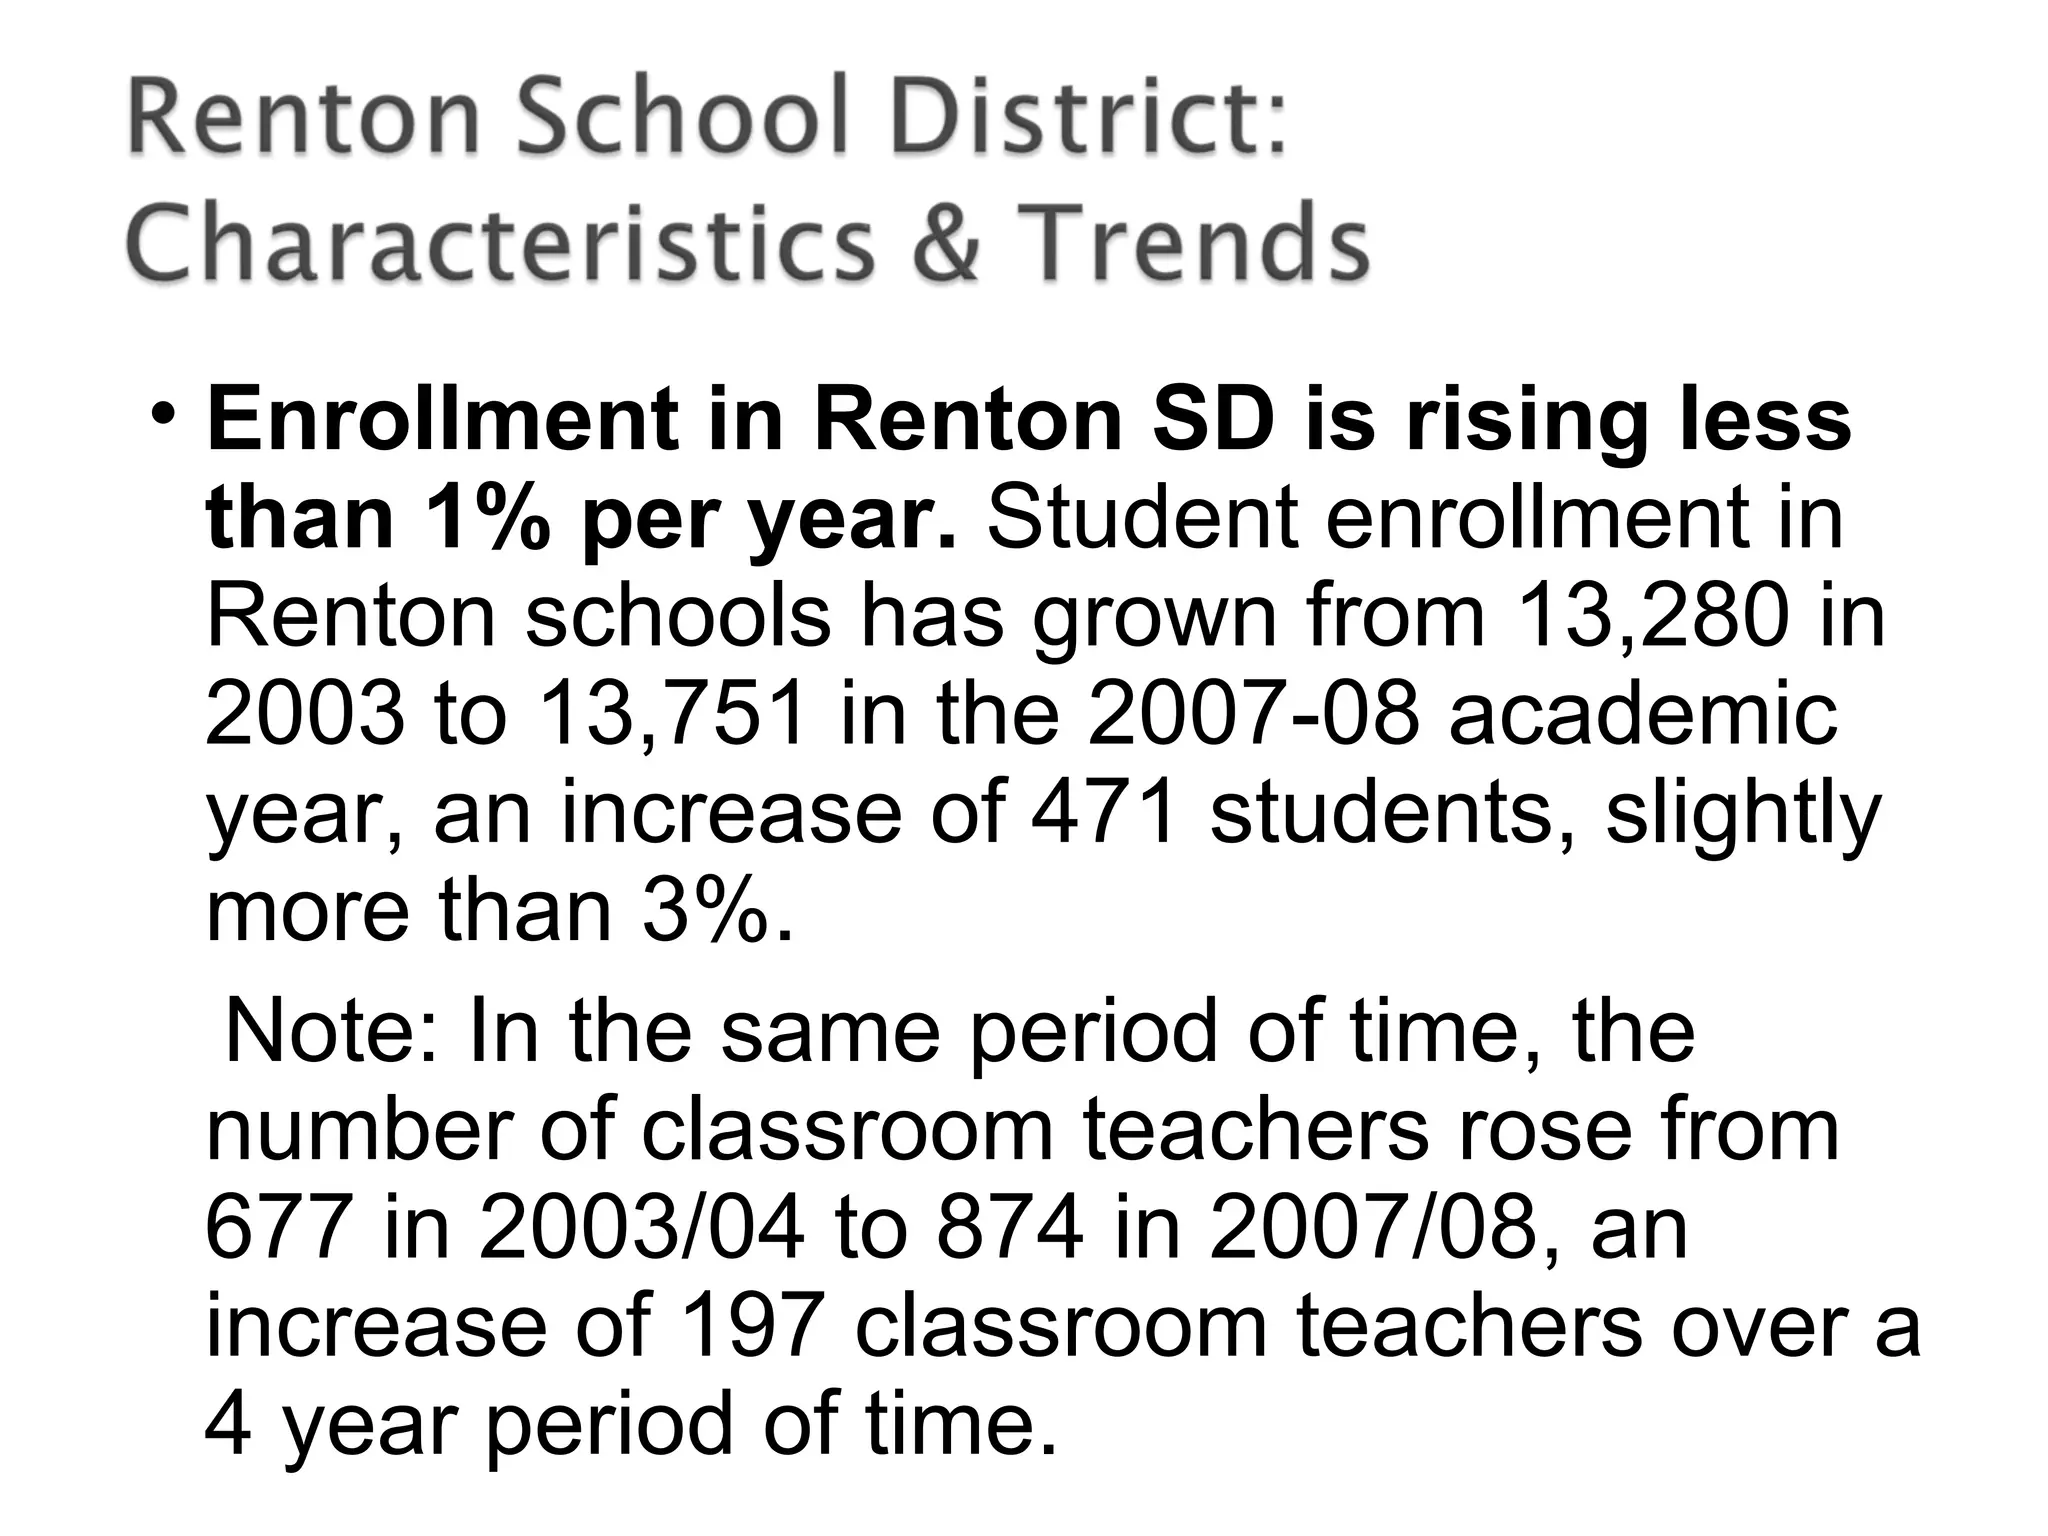
• Enrollment inRenton SD is rising less
than 1% per year. Student enrollment in
Renton schools has grown from 13,280 in
2003 to 13,751 in the 2007-08 academic
year, an increase of 471 students, slightly
more than 3%.
Note: In the same period of time, the
number of classroom teachers rose from
677 in 2003/04 to 874 in 2007/08, an
increase of 197 classroom teachers over a
4 year period of time.
21.
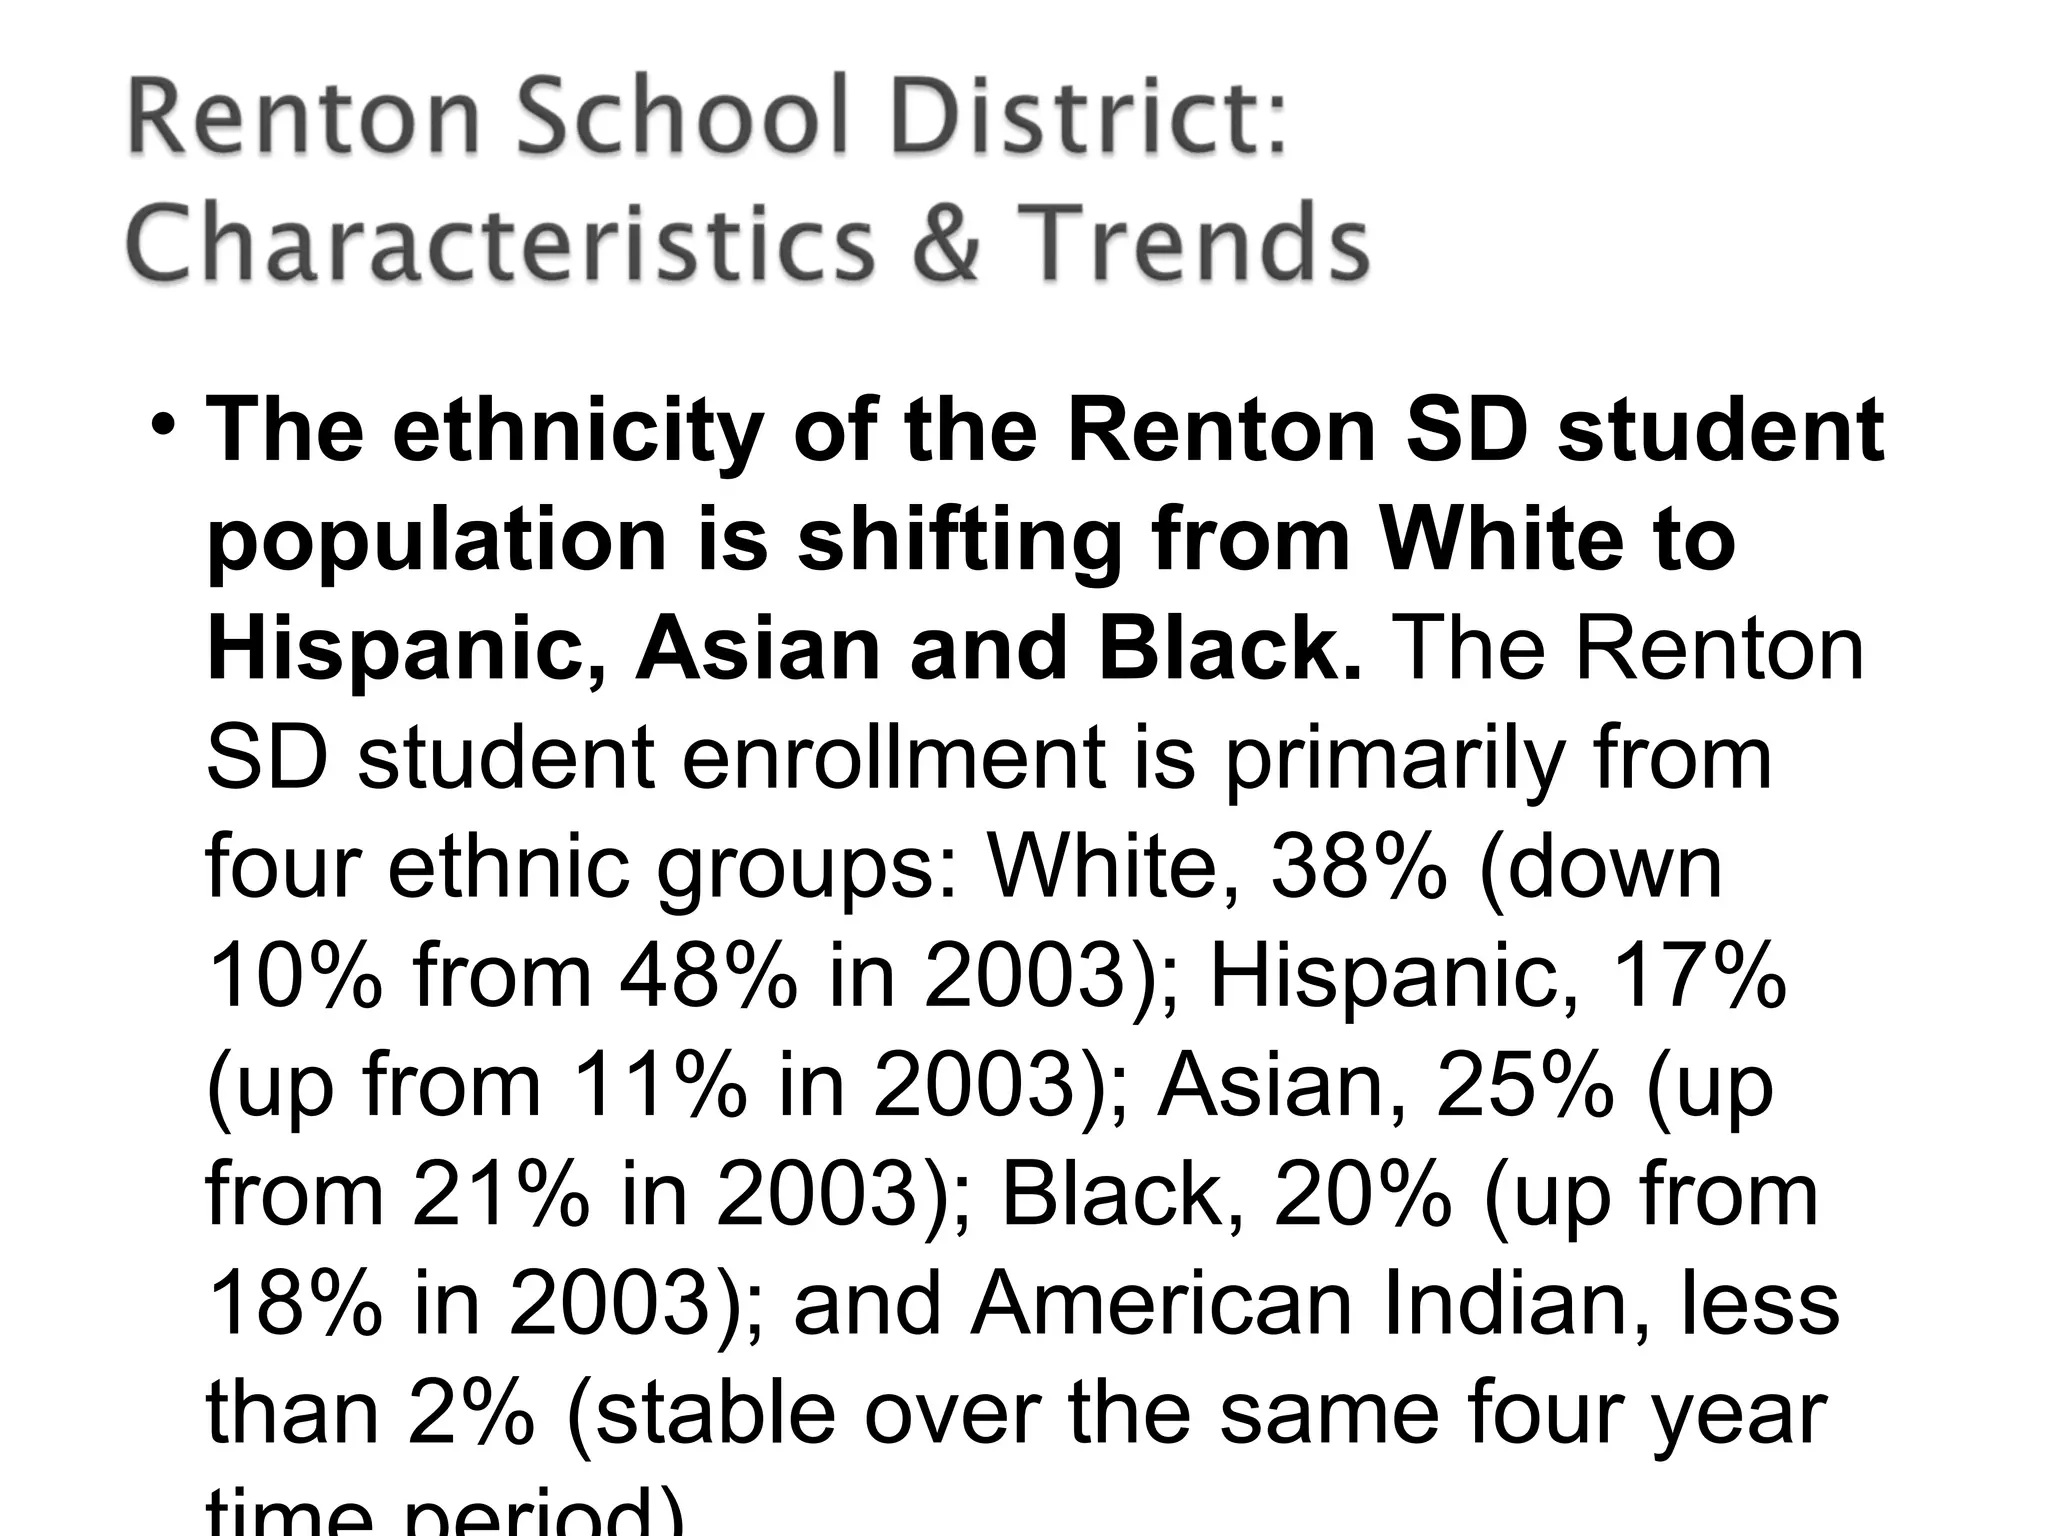
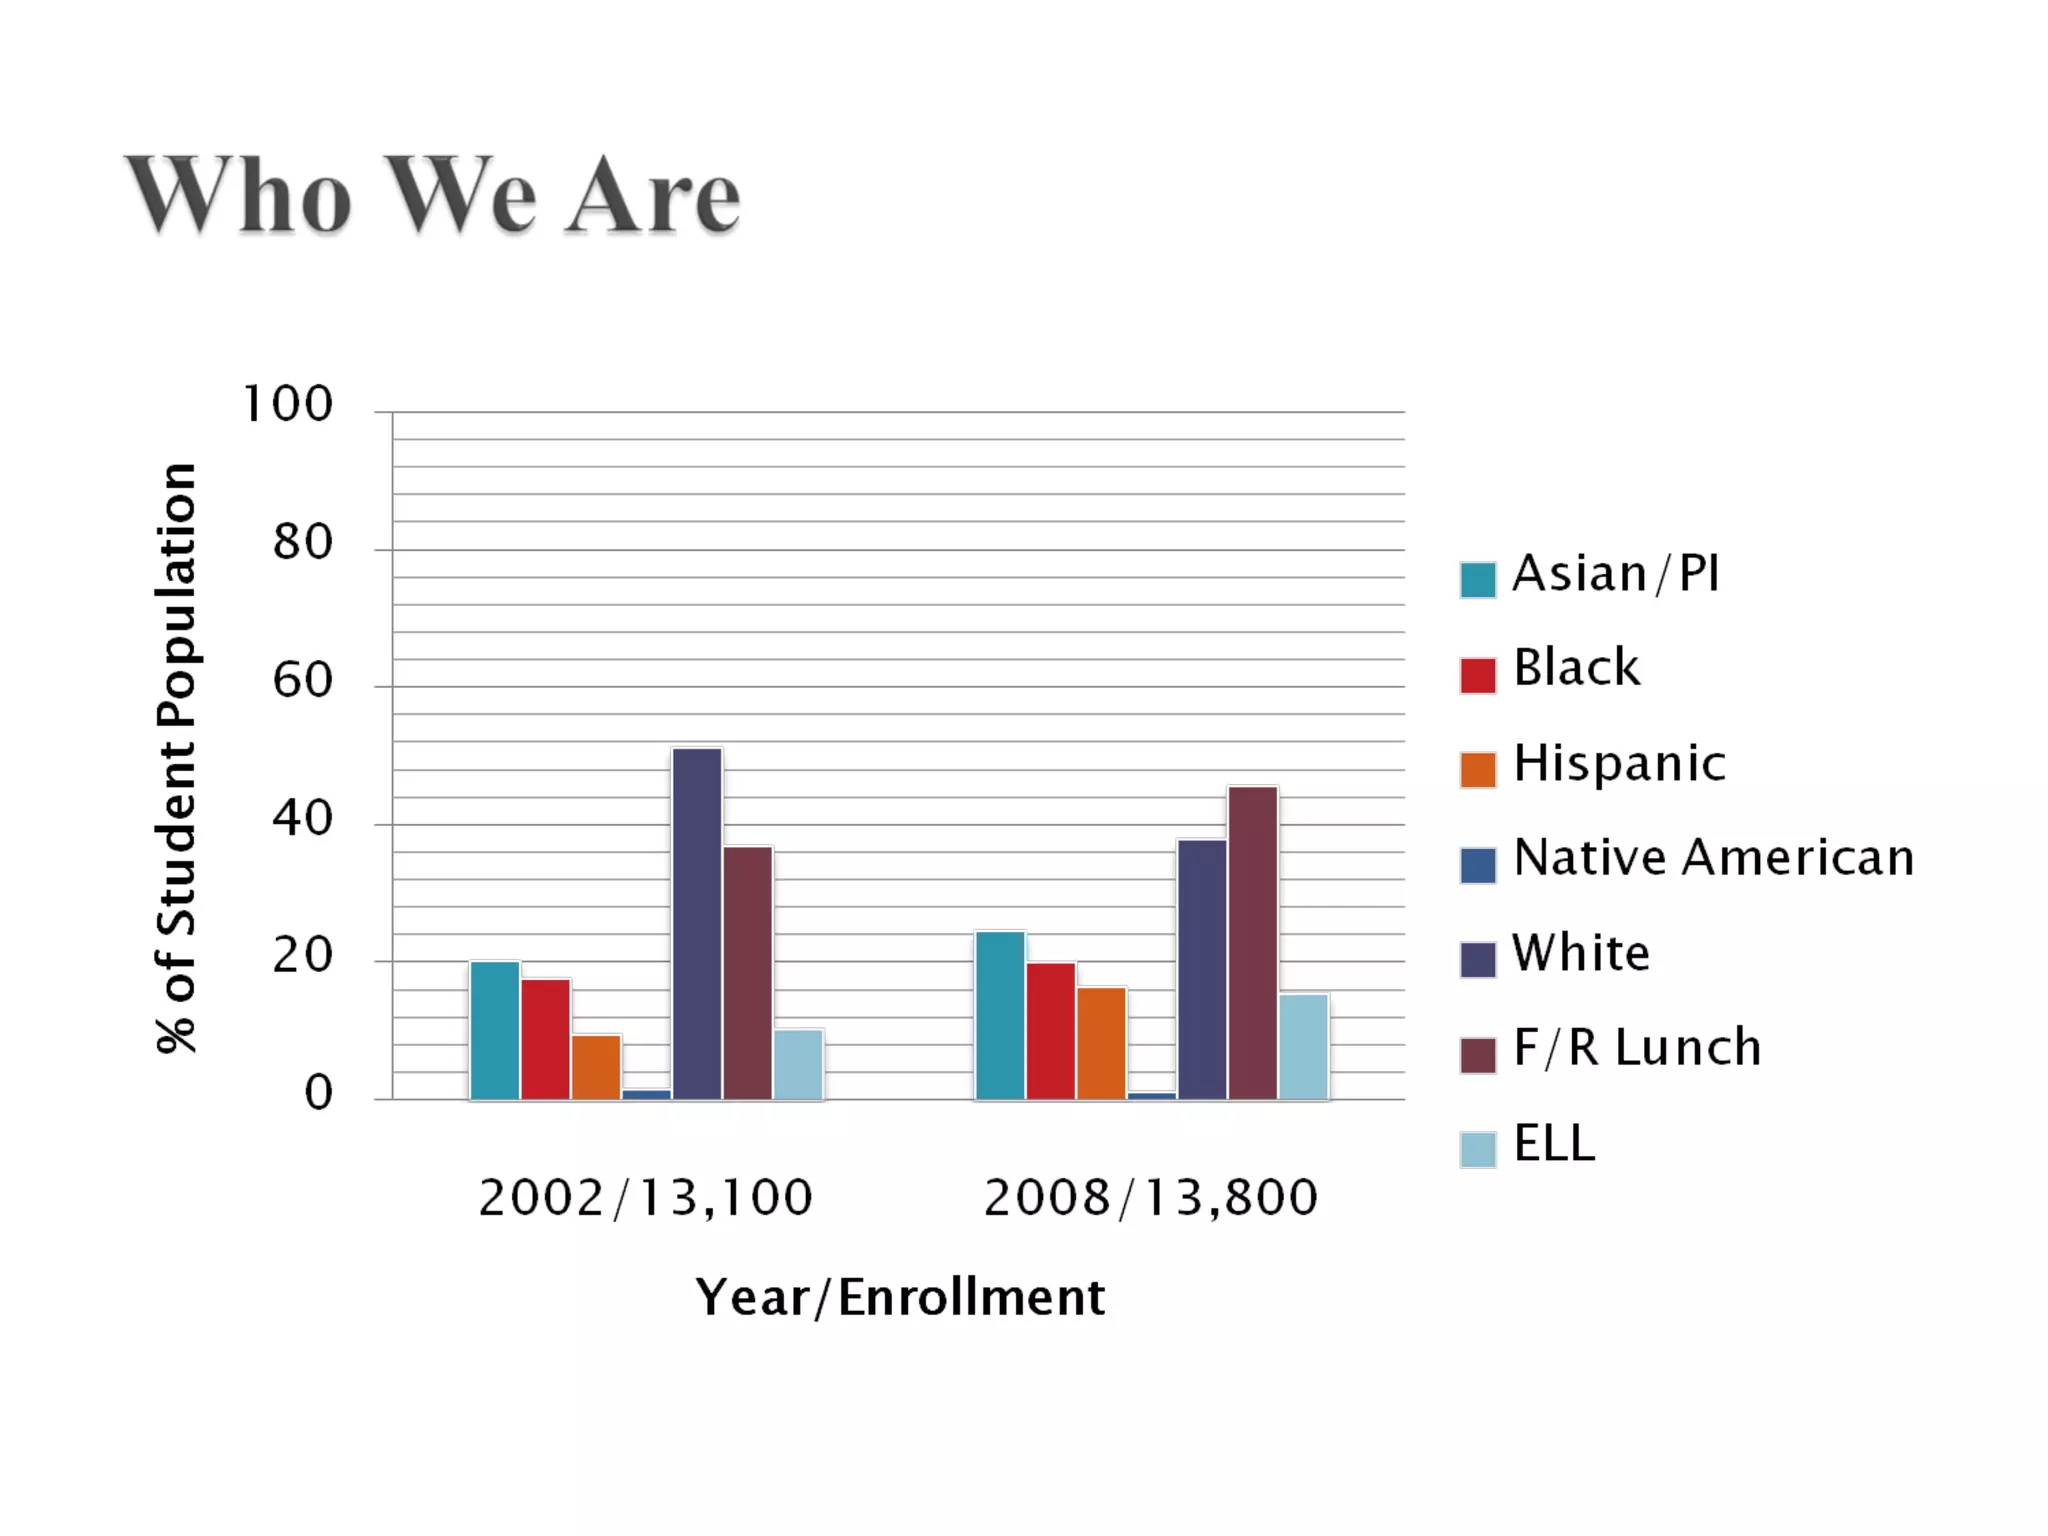
• The ethnicityof the Renton SD student
population is shifting from White to
Hispanic, Asian and Black. The Renton
SD student enrollment is primarily from
four ethnic groups: White, 38% (down
10% from 48% in 2003); Hispanic, 17%
(up from 11% in 2003); Asian, 25% (up
from 21% in 2003); Black, 20% (up from
18% in 2003); and American Indian, less
than 2% (stable over the same four year
22.
• The rateof poverty in the Renton SD is
steady at 42%. Statewide poverty is 38%,
a 2% increase since 2003.
23.
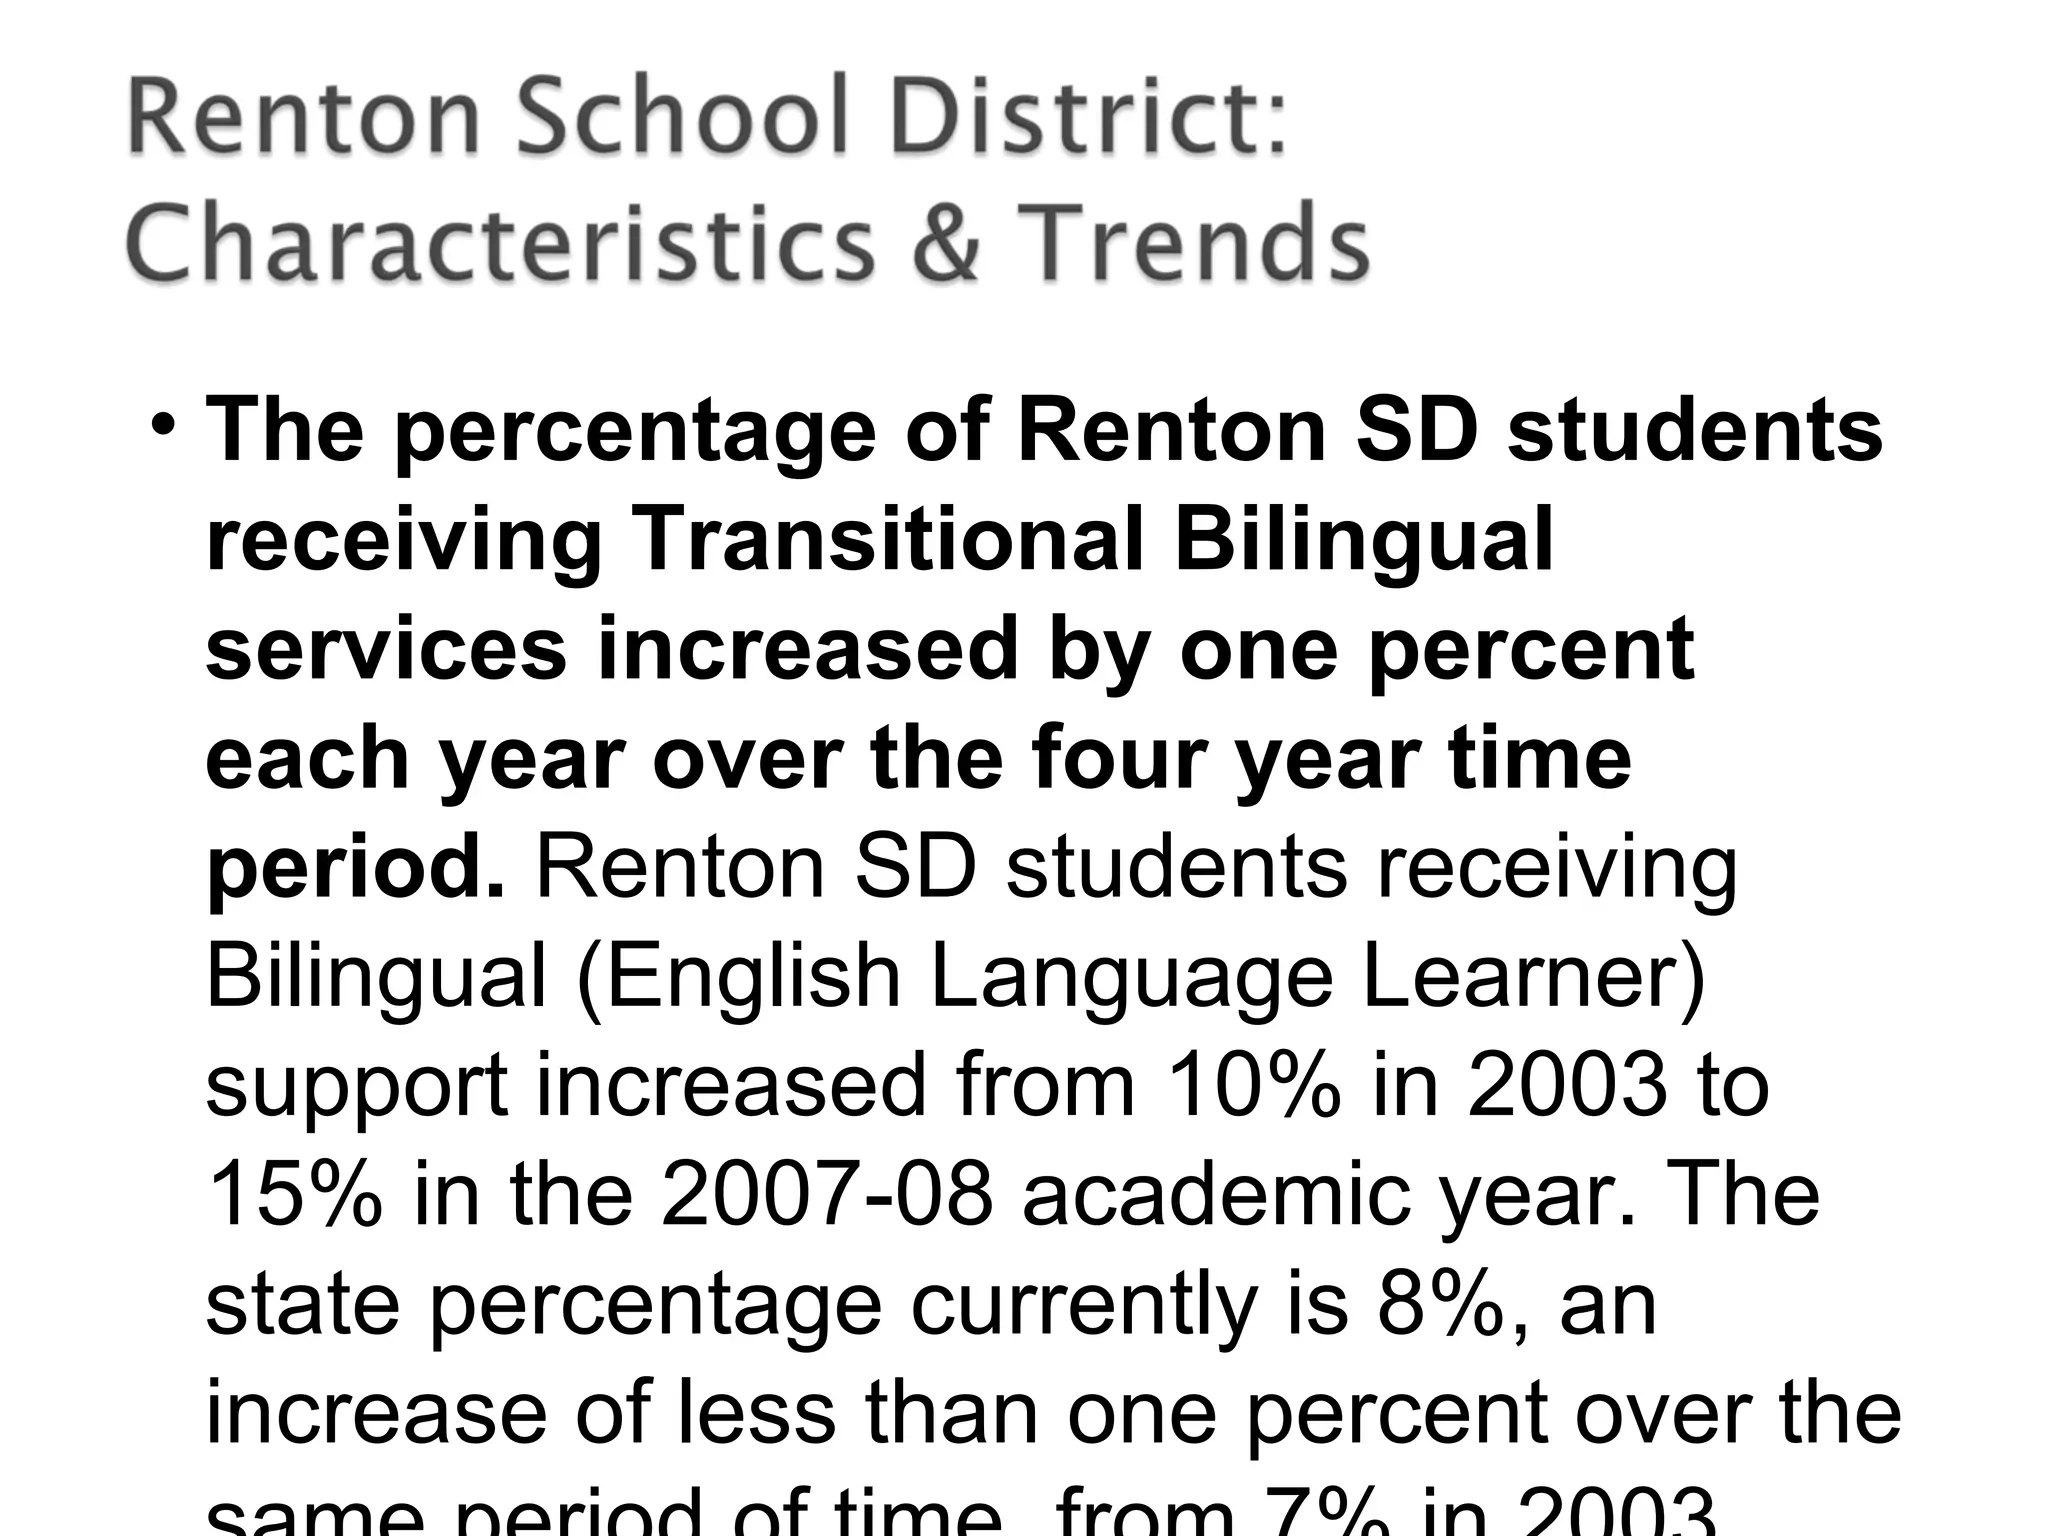
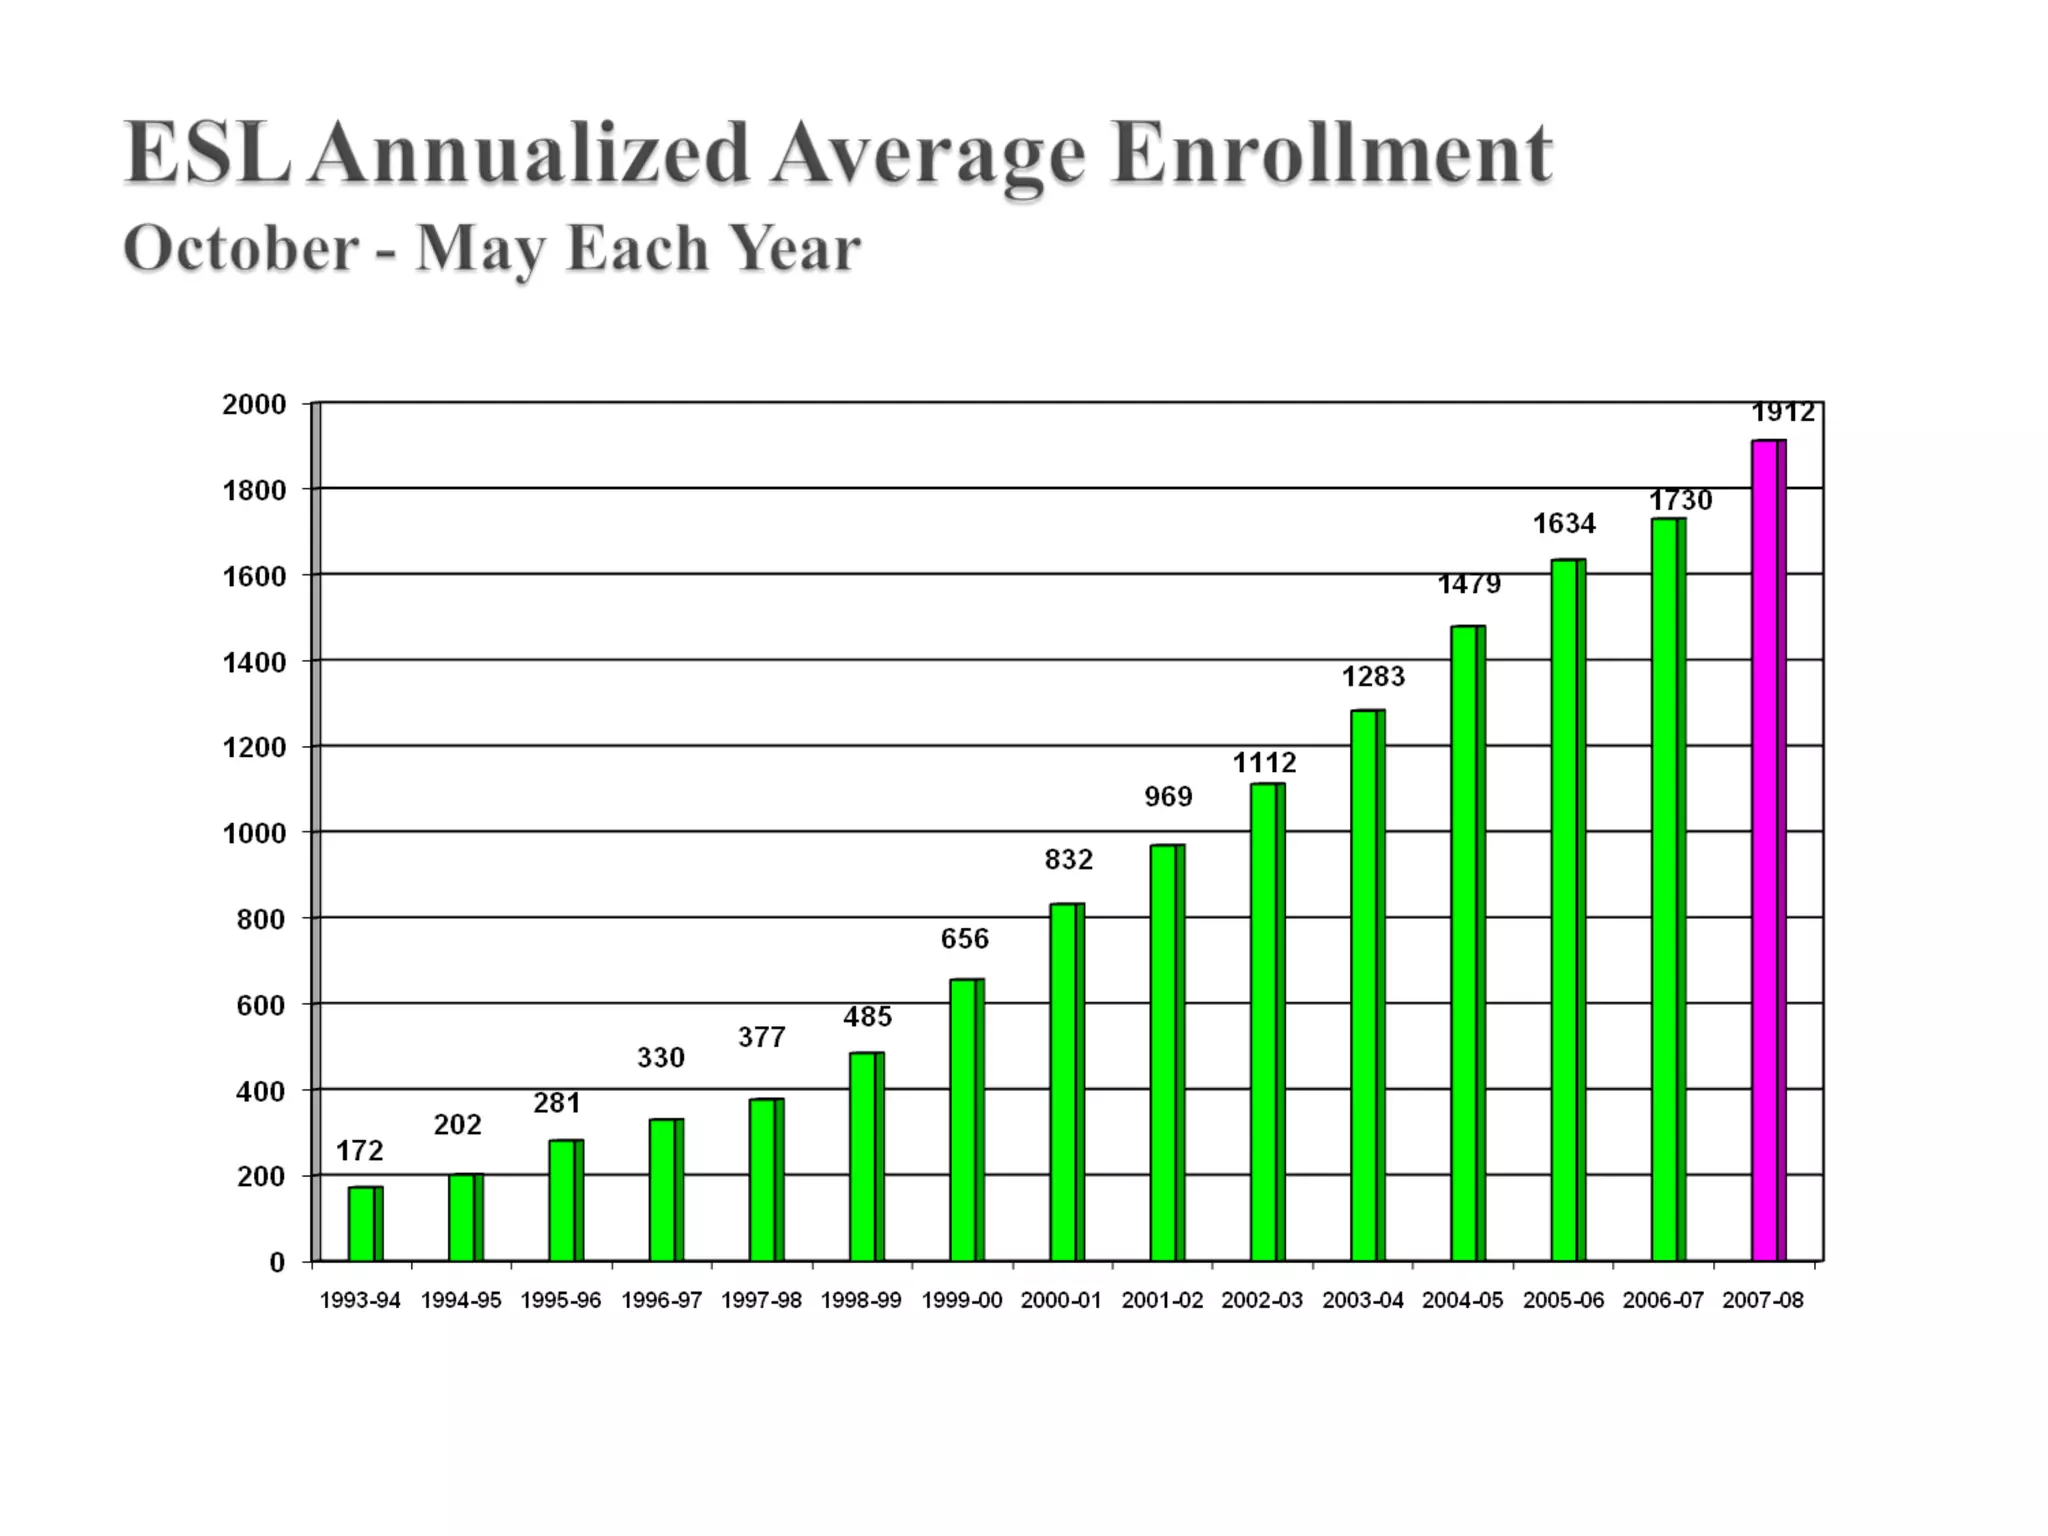
• The percentageof Renton SD students
receiving Transitional Bilingual
services increased by one percent
each year over the four year time
period. Renton SD students receiving
Bilingual (English Language Learner)
support increased from 10% in 2003 to
15% in the 2007-08 academic year. The
state percentage currently is 8%, an
increase of less than one percent over the
24.
• Special Educationservices are
delivered to 12% of Renton SD
students – a number that has increased
less than 1% over the past four years.
25.
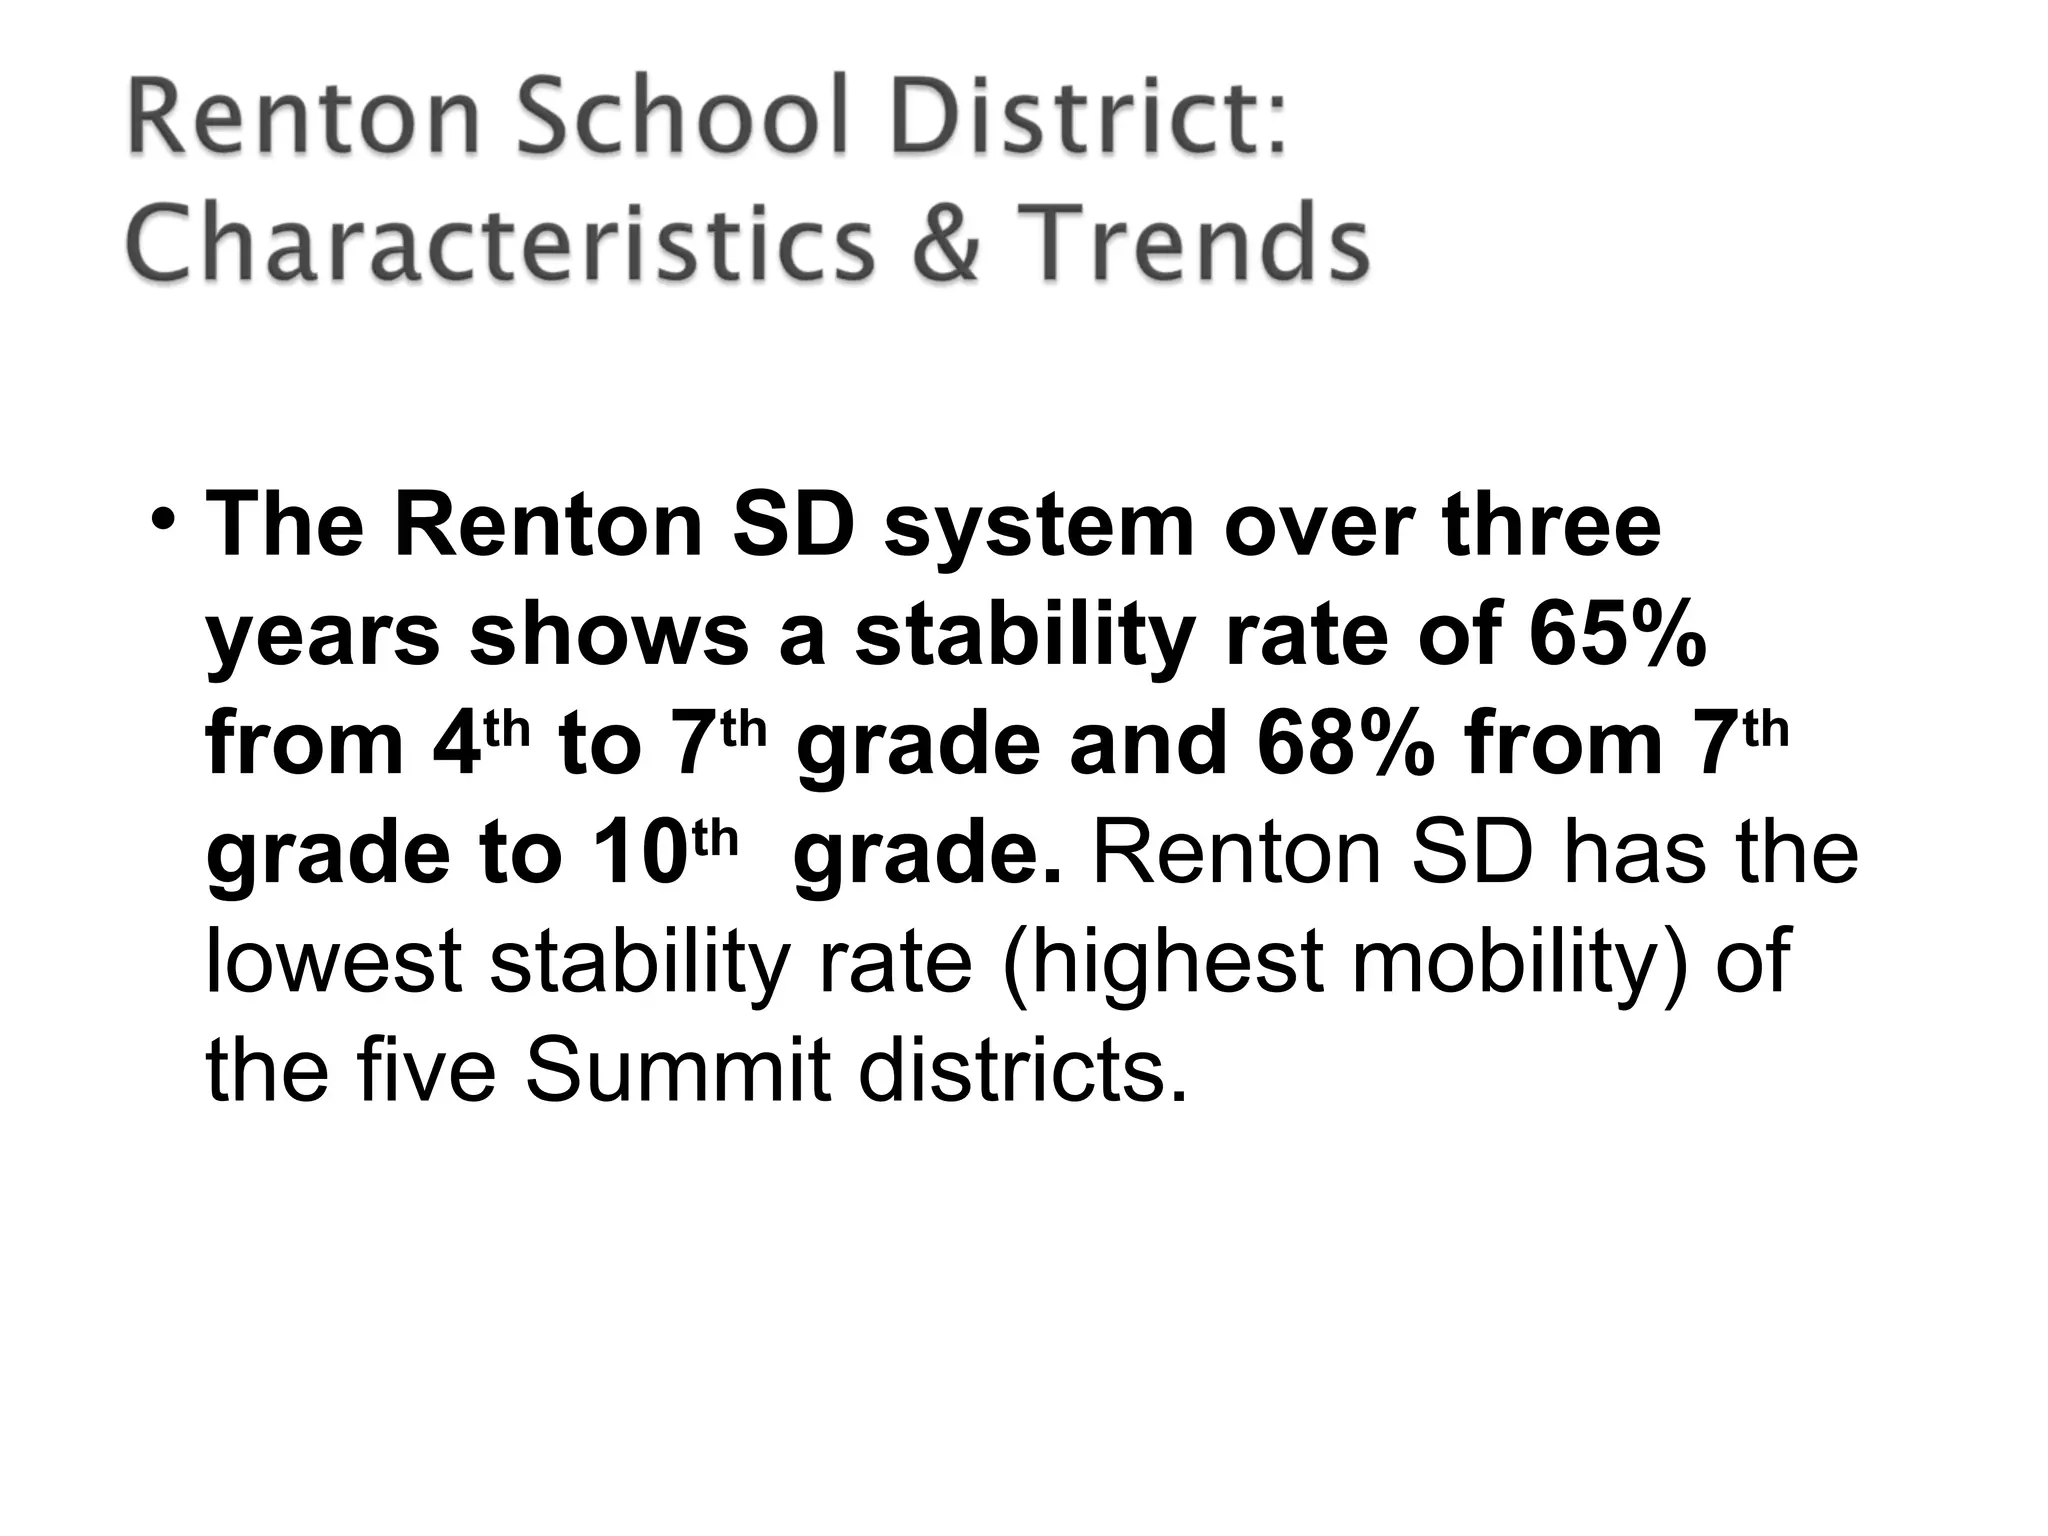
• The RentonSD system over three
years shows a stability rate of 65%
from 4th
to 7th
grade and 68% from 7th
grade to 10th
grade. Renton SD has the
lowest stability rate (highest mobility) of
the five Summit districts.
28.
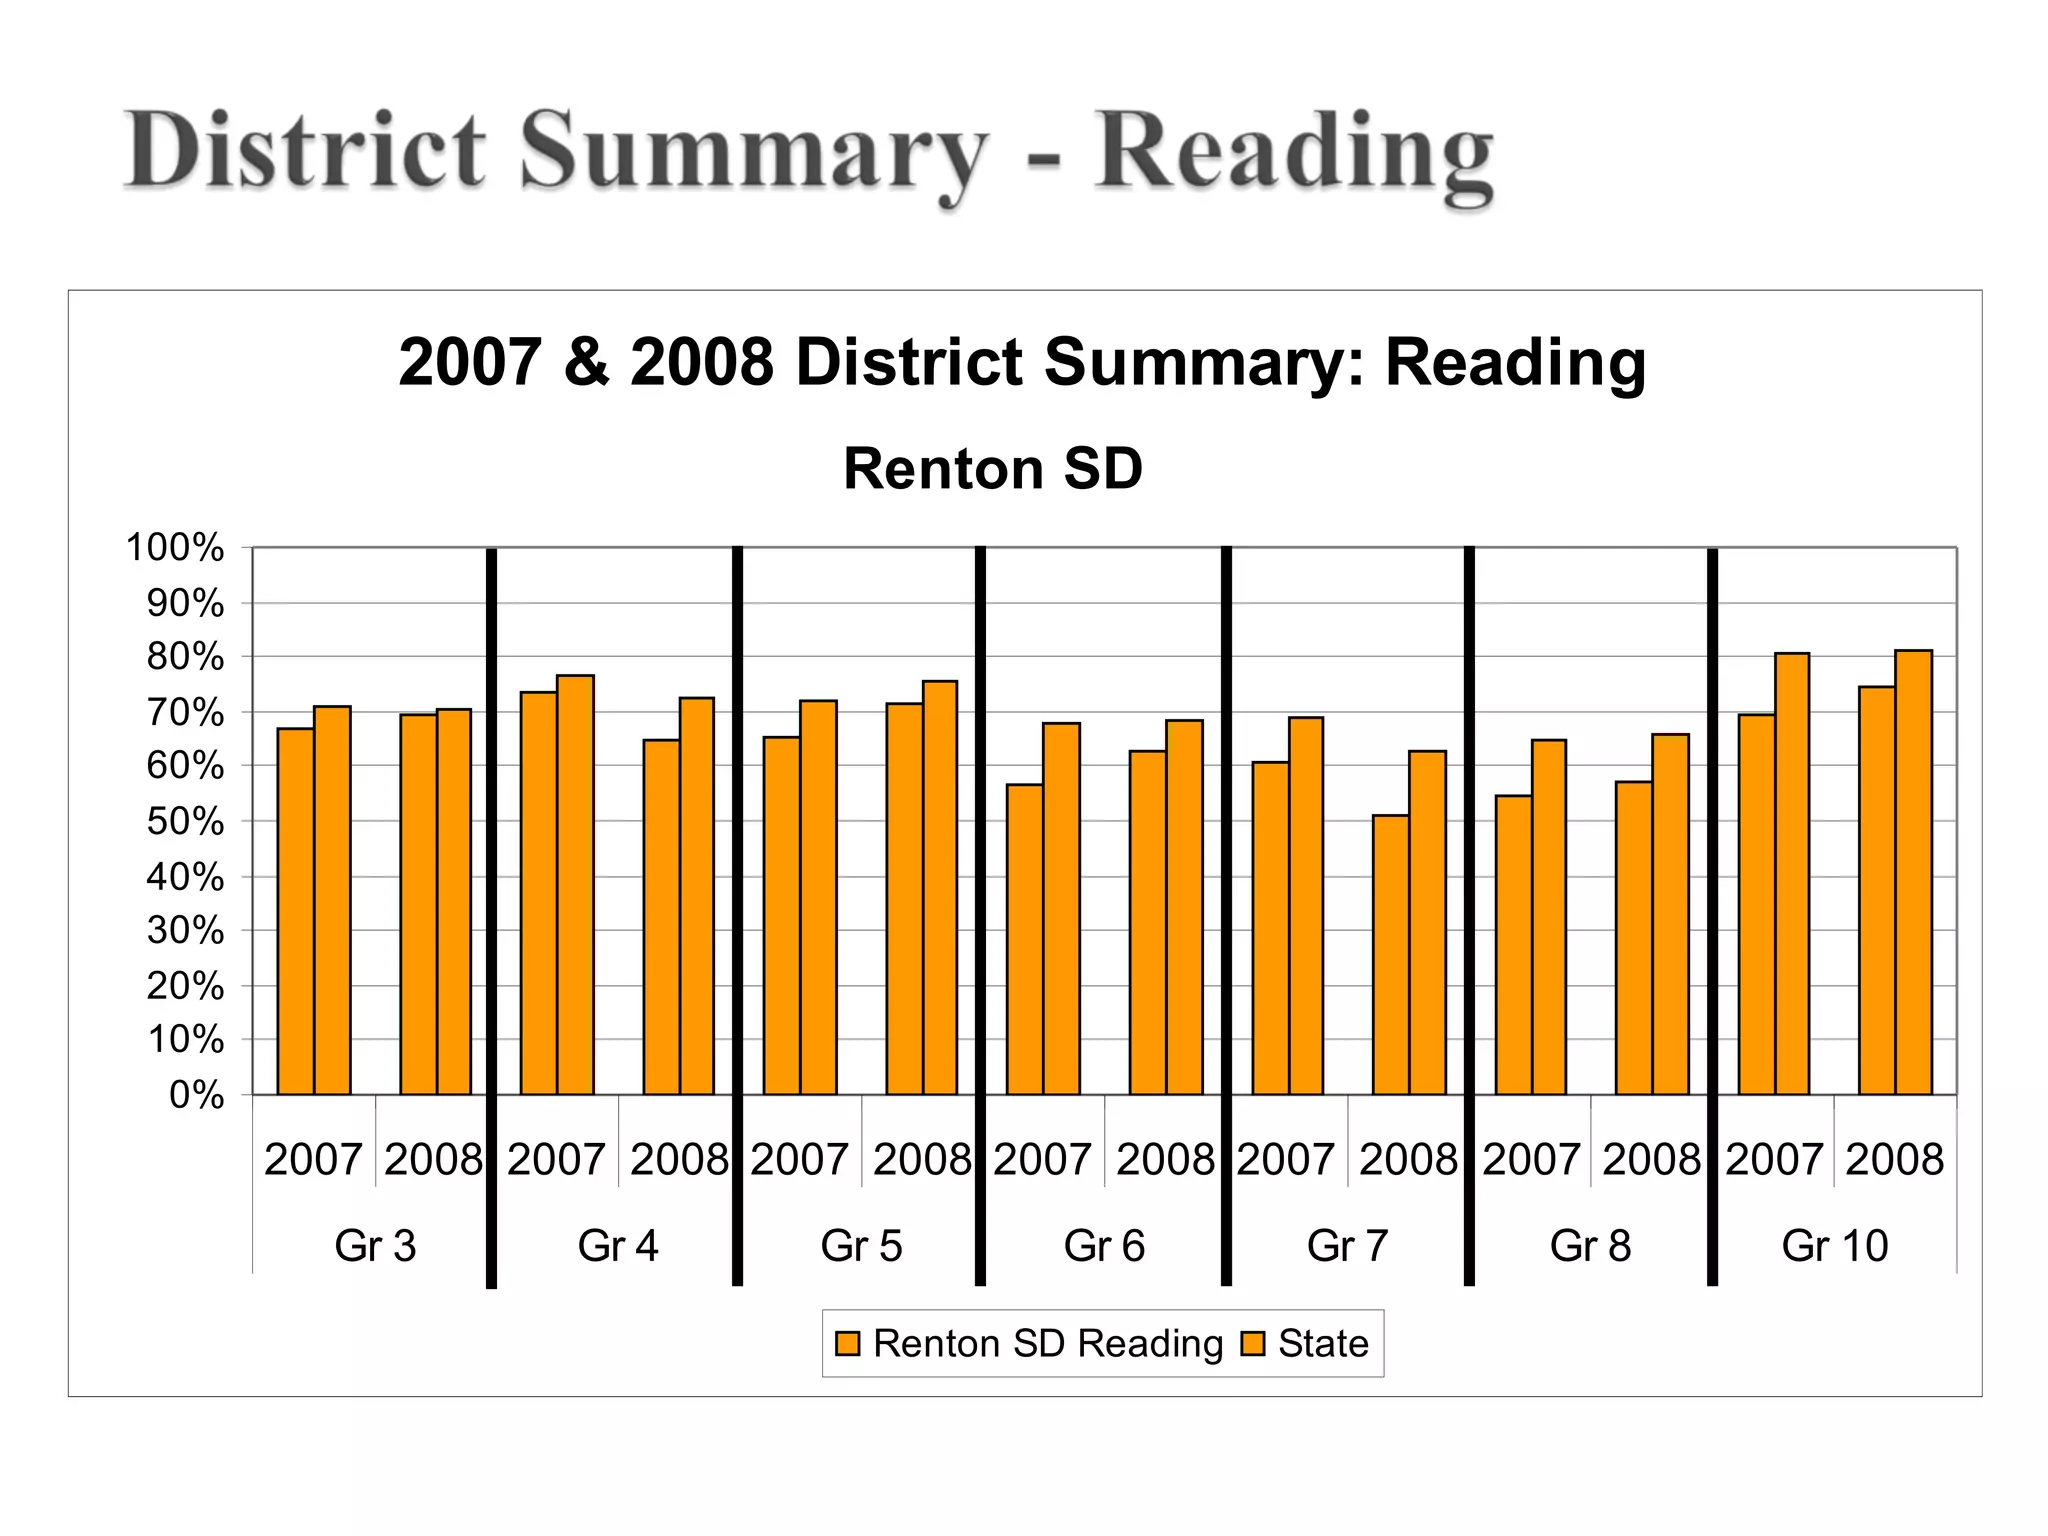
2007 & 2008District Summary: Reading
0%
10%
20%
30%
40%
50%
60%
70%
80%
90%
100%
2007 2008 2007 2008 2007 2008 2007 2008 2007 2008 2007 2008 2007 2008
Gr 3 Gr 4 Gr 5 Gr 6 Gr 7 Gr 8 Gr 10
Renton SD Reading State
Renton SD
29.
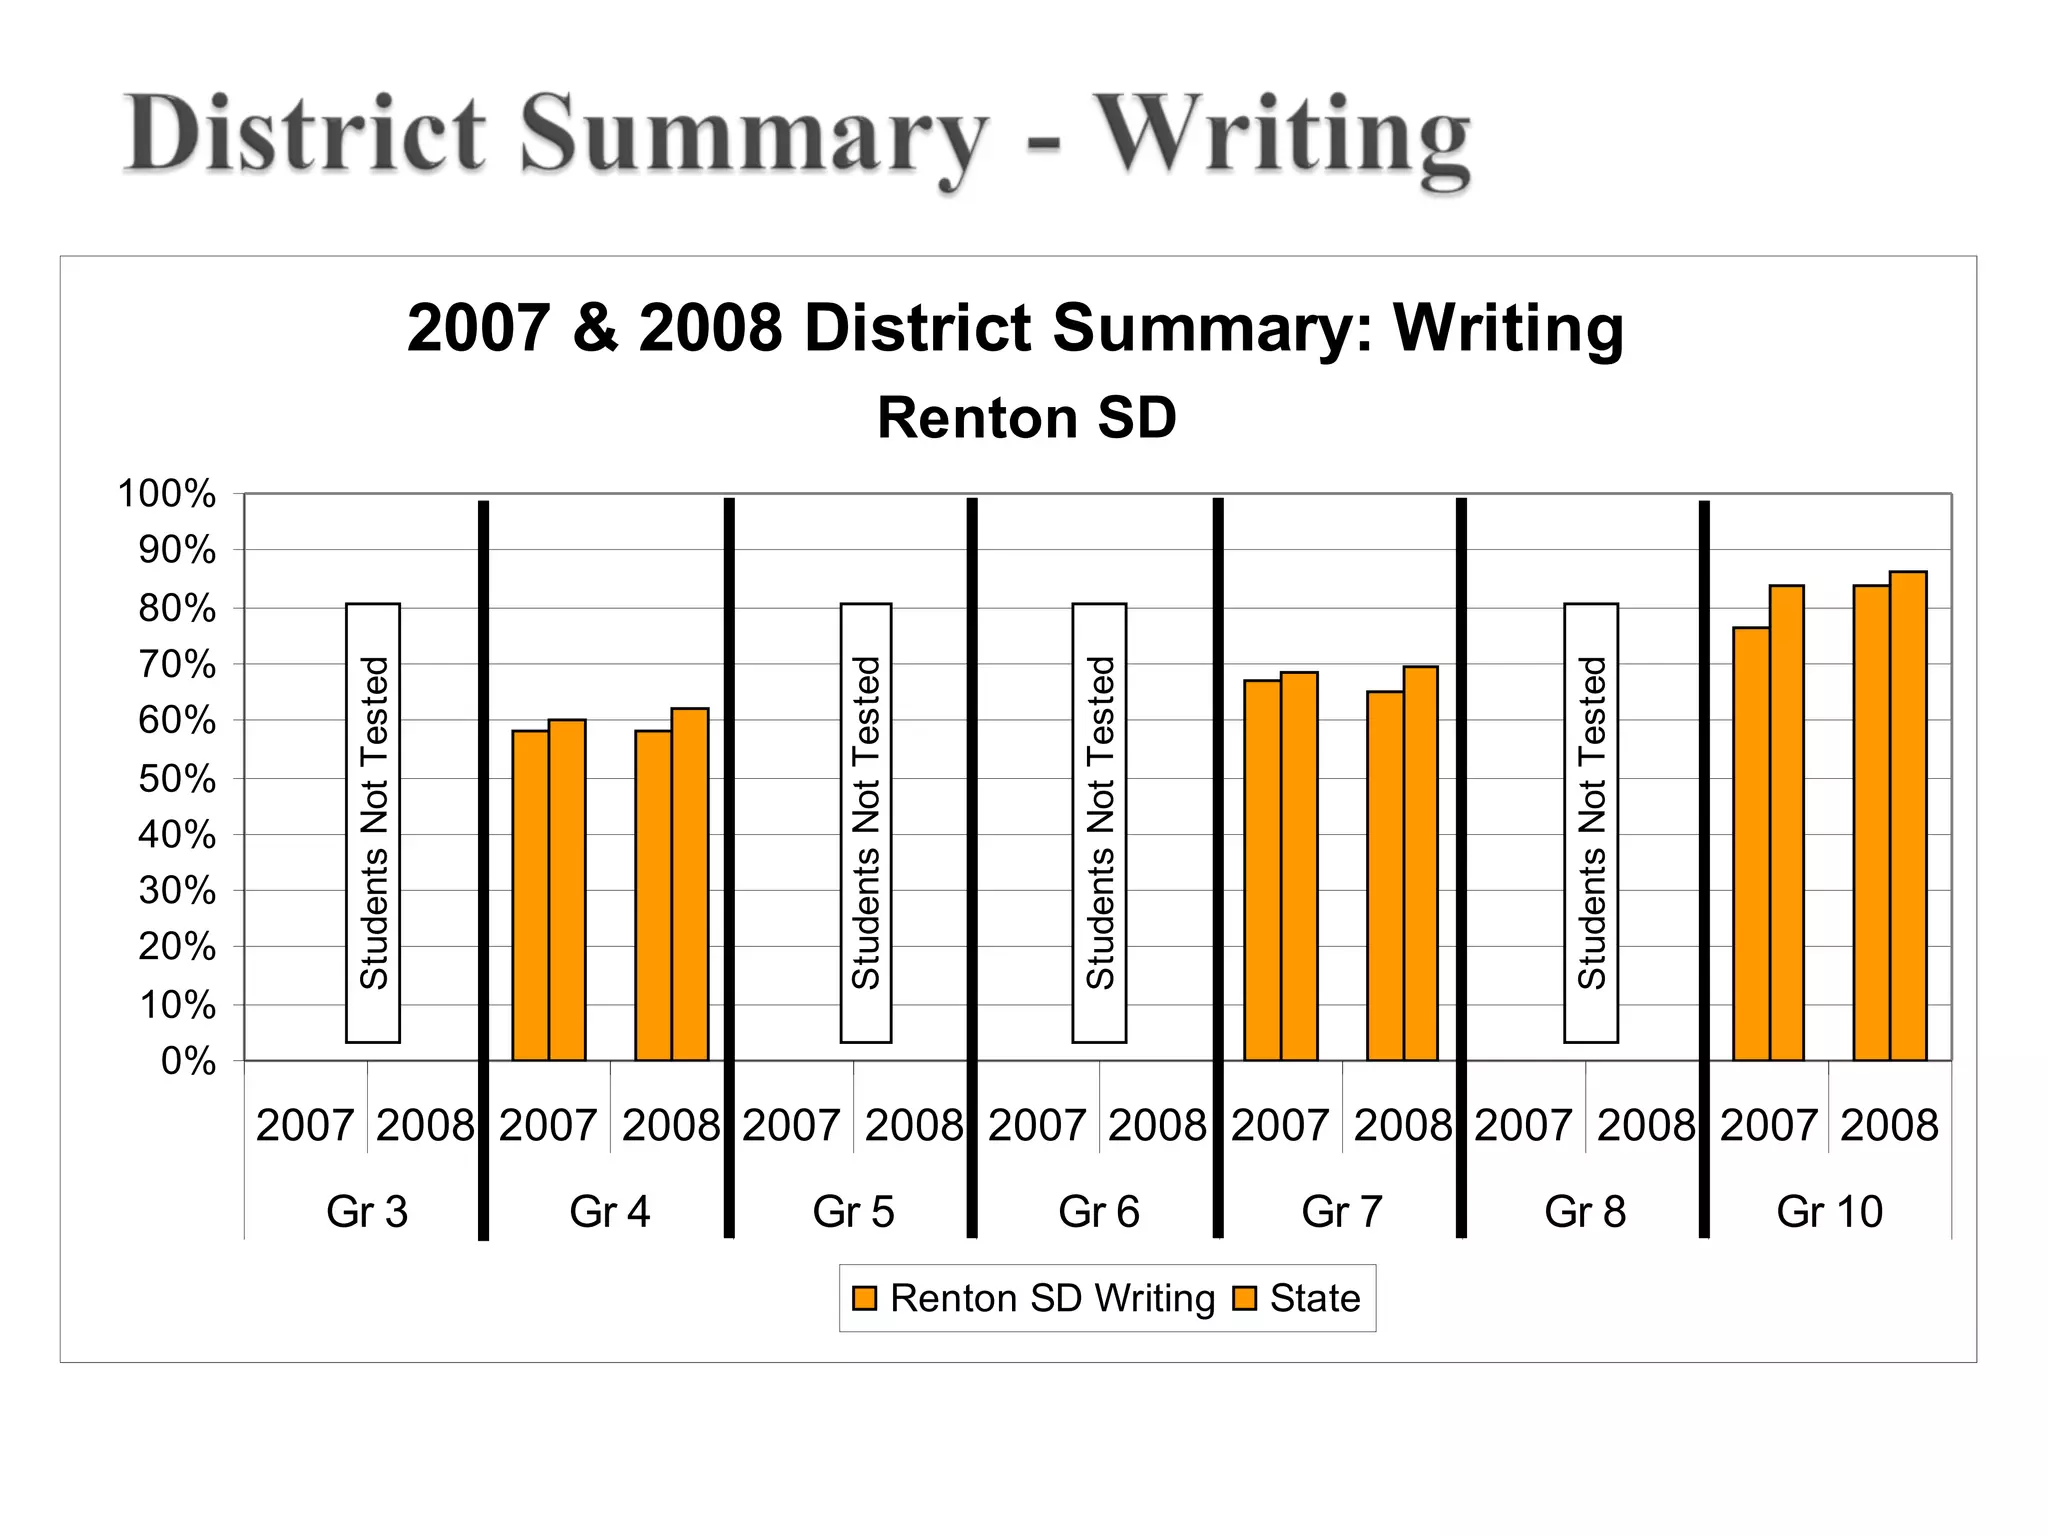
2007 & 2008District Summary: Writing
0%
10%
20%
30%
40%
50%
60%
70%
80%
90%
100%
2007 2008 2007 2008 2007 2008 2007 2008 2007 2008 2007 2008 2007 2008
Gr 3 Gr 4 Gr 5 Gr 6 Gr 7 Gr 8 Gr 10
Renton SD Writing State
Renton SD
StudentsNotTested
StudentsNotTested
StudentsNotTested
StudentsNotTested
30.
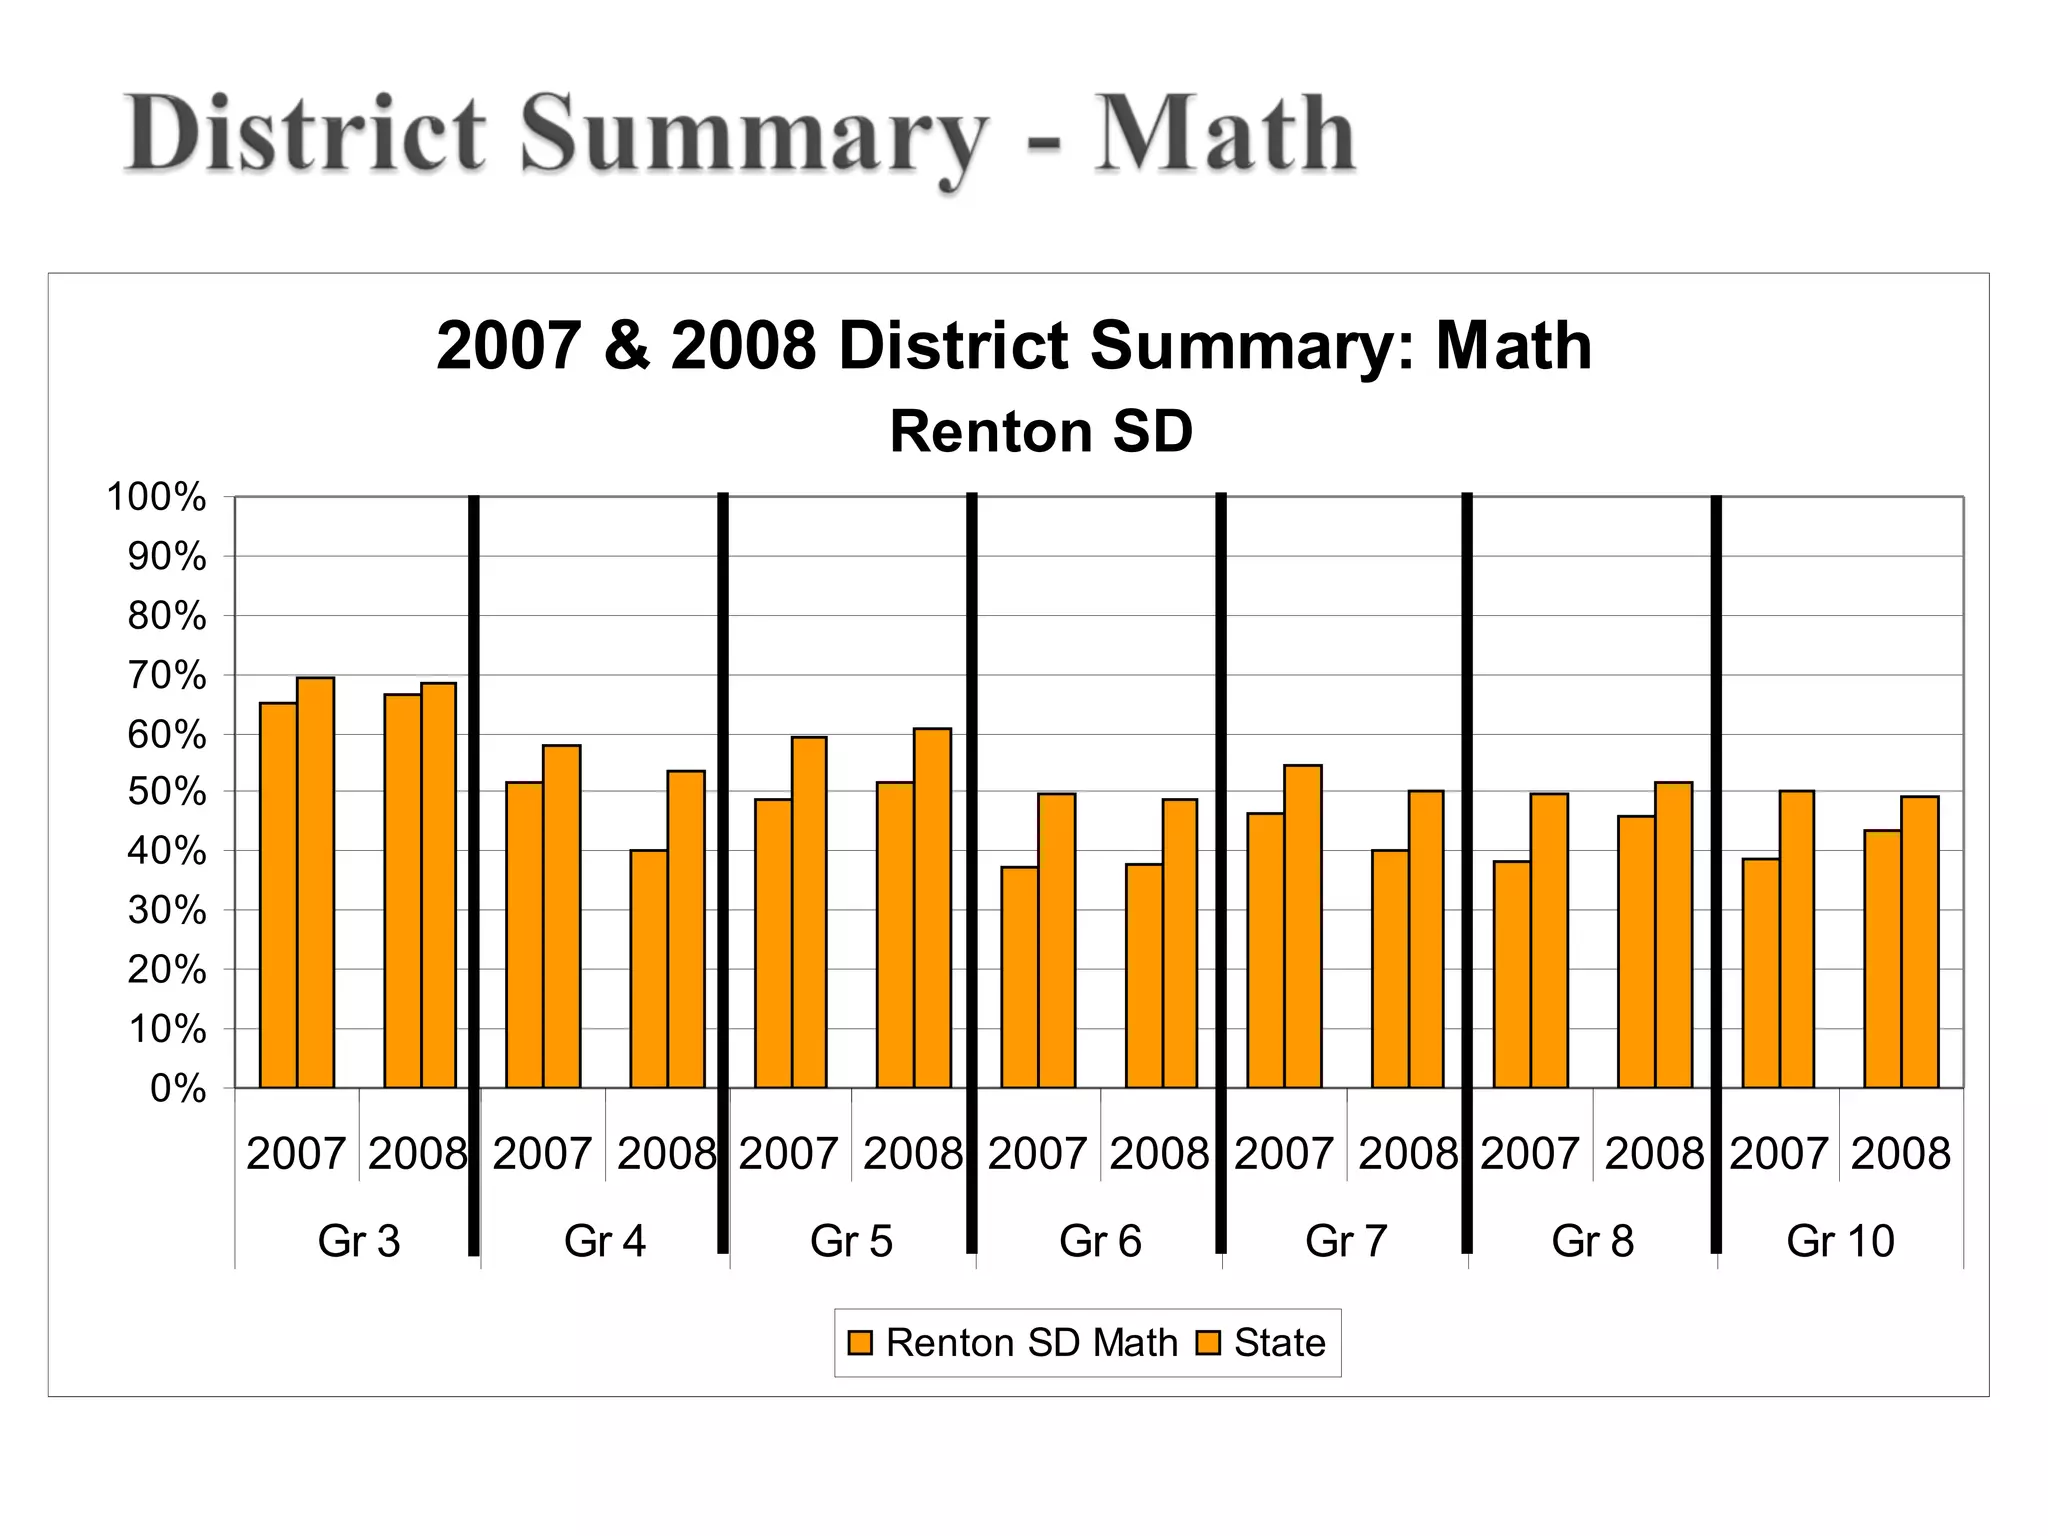
2007 & 2008District Summary: Math
0%
10%
20%
30%
40%
50%
60%
70%
80%
90%
100%
2007 2008 2007 2008 2007 2008 2007 2008 2007 2008 2007 2008 2007 2008
Gr 3 Gr 4 Gr 5 Gr 6 Gr 7 Gr 8 Gr 10
Renton SD Math State
Renton SD
31.
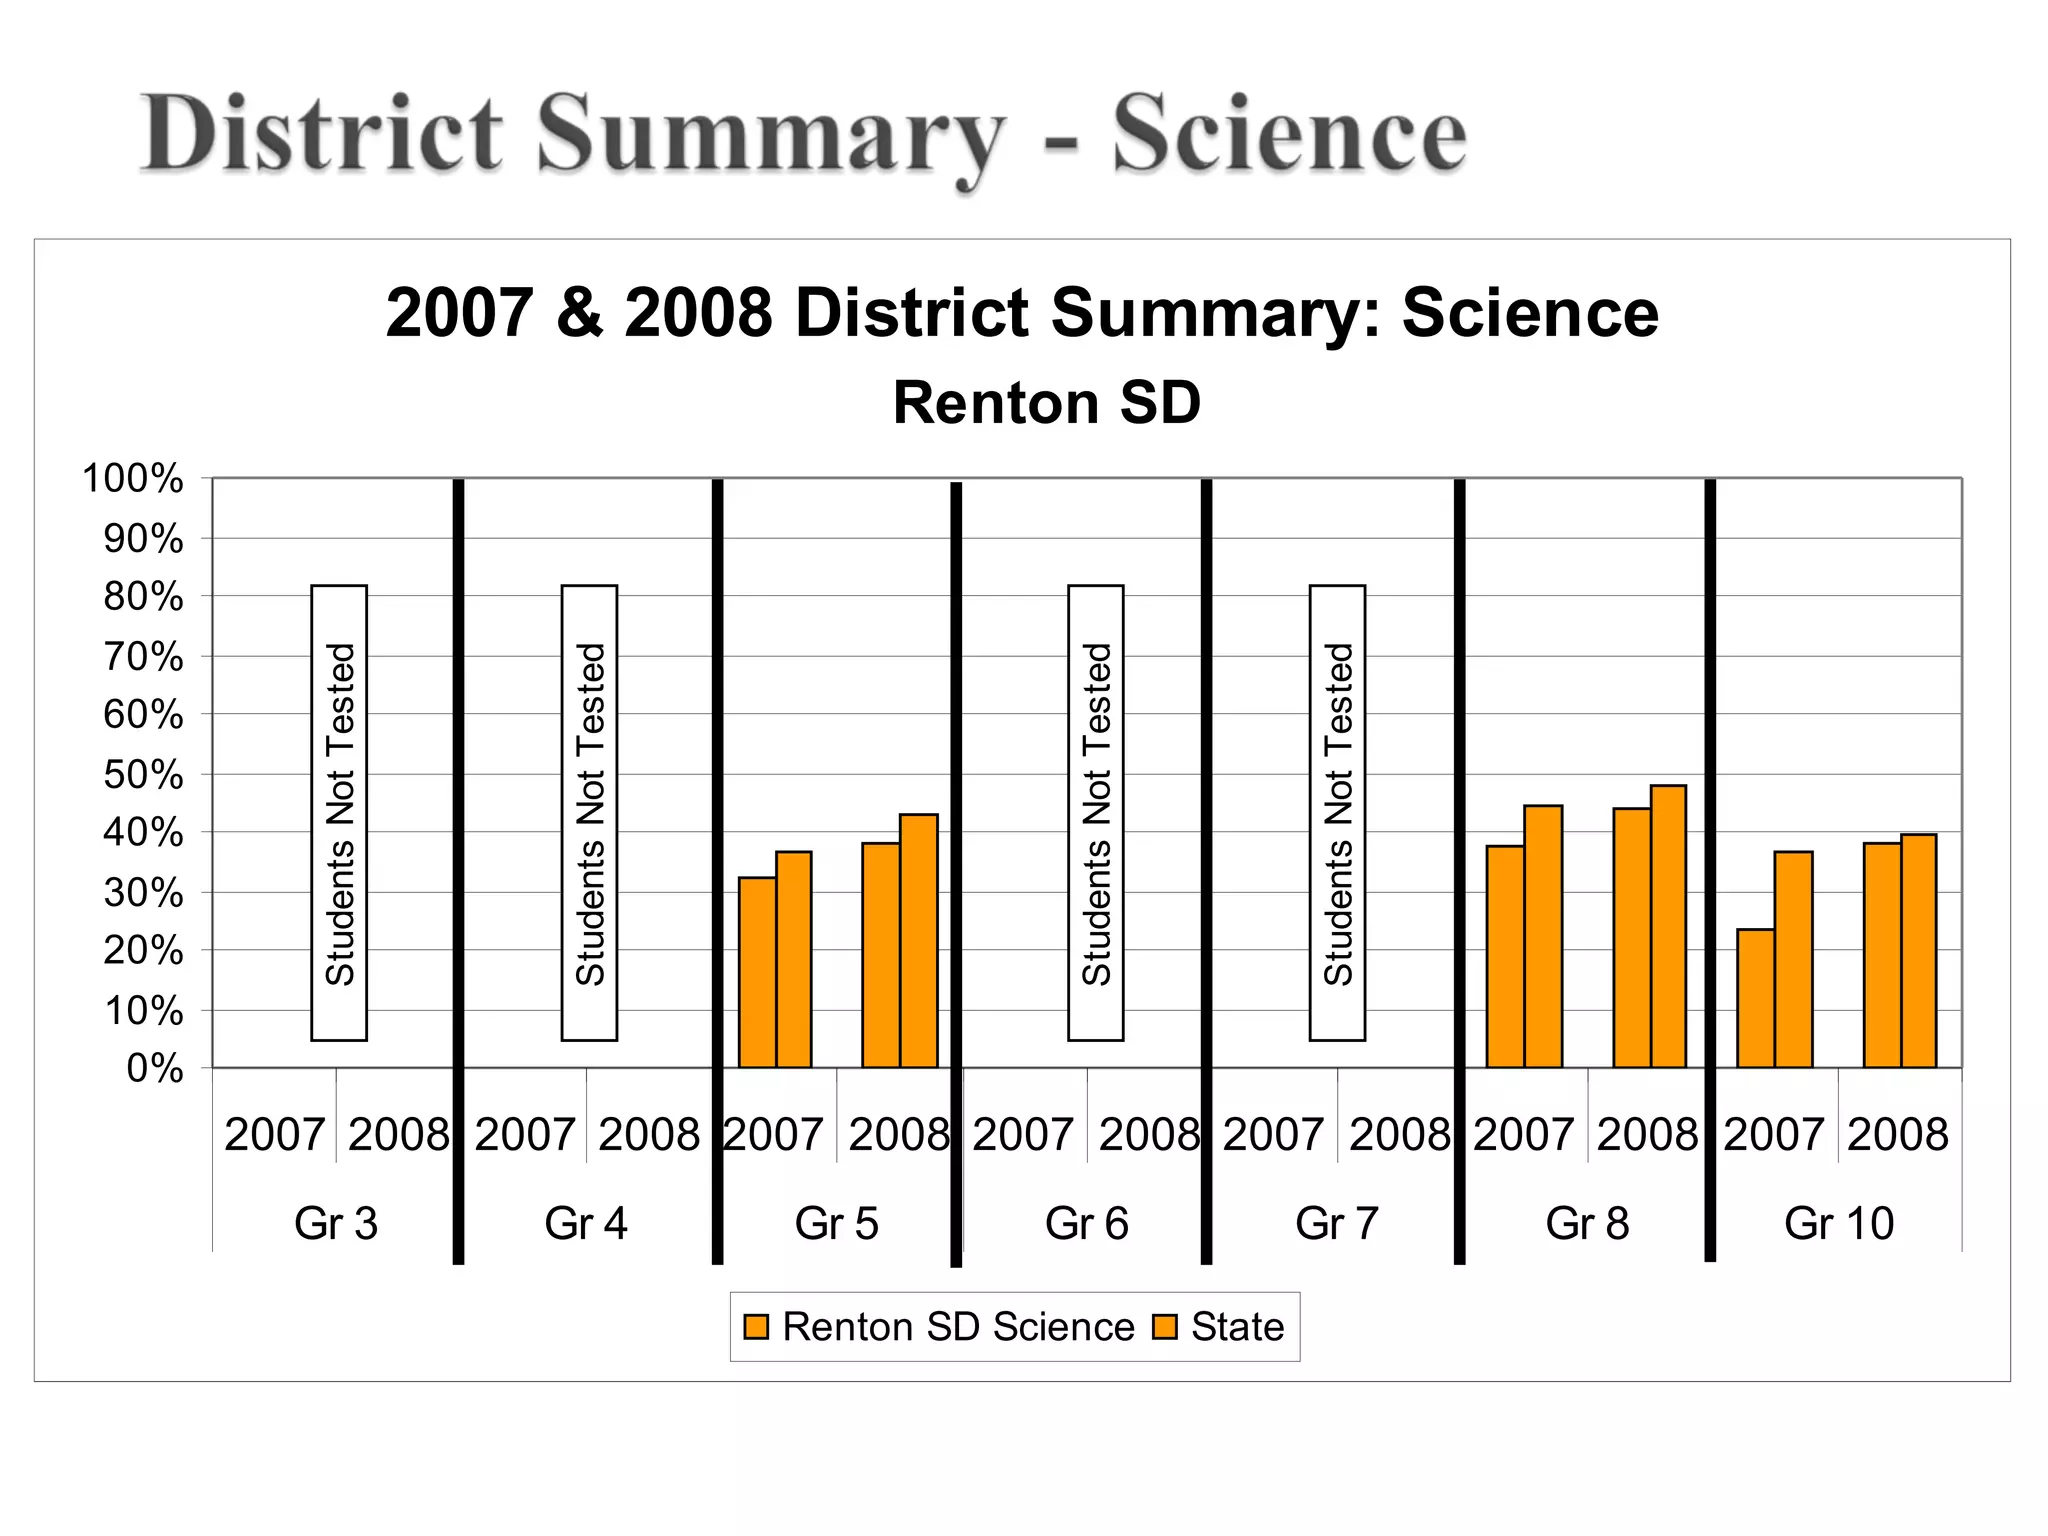
2007 & 2008District Summary: Science
0%
10%
20%
30%
40%
50%
60%
70%
80%
90%
100%
2007 2008 2007 2008 2007 2008 2007 2008 2007 2008 2007 2008 2007 2008
Gr 3 Gr 4 Gr 5 Gr 6 Gr 7 Gr 8 Gr 10
Renton SD Science State
Renton SD
StudentsNotTested
StudentsNotTested
StudentsNotTested
StudentsNotTested
32.
Eleven elementary schoolsbeat the state in the
increase in percentage of all students meeting
standard in one or more WASL subjects
All three middle schools beat the state in the
increase in percentage of all students meeting
standard in one or more WASL subjects
All three comprehensive high schools beat the
state in the increase in percentage of all
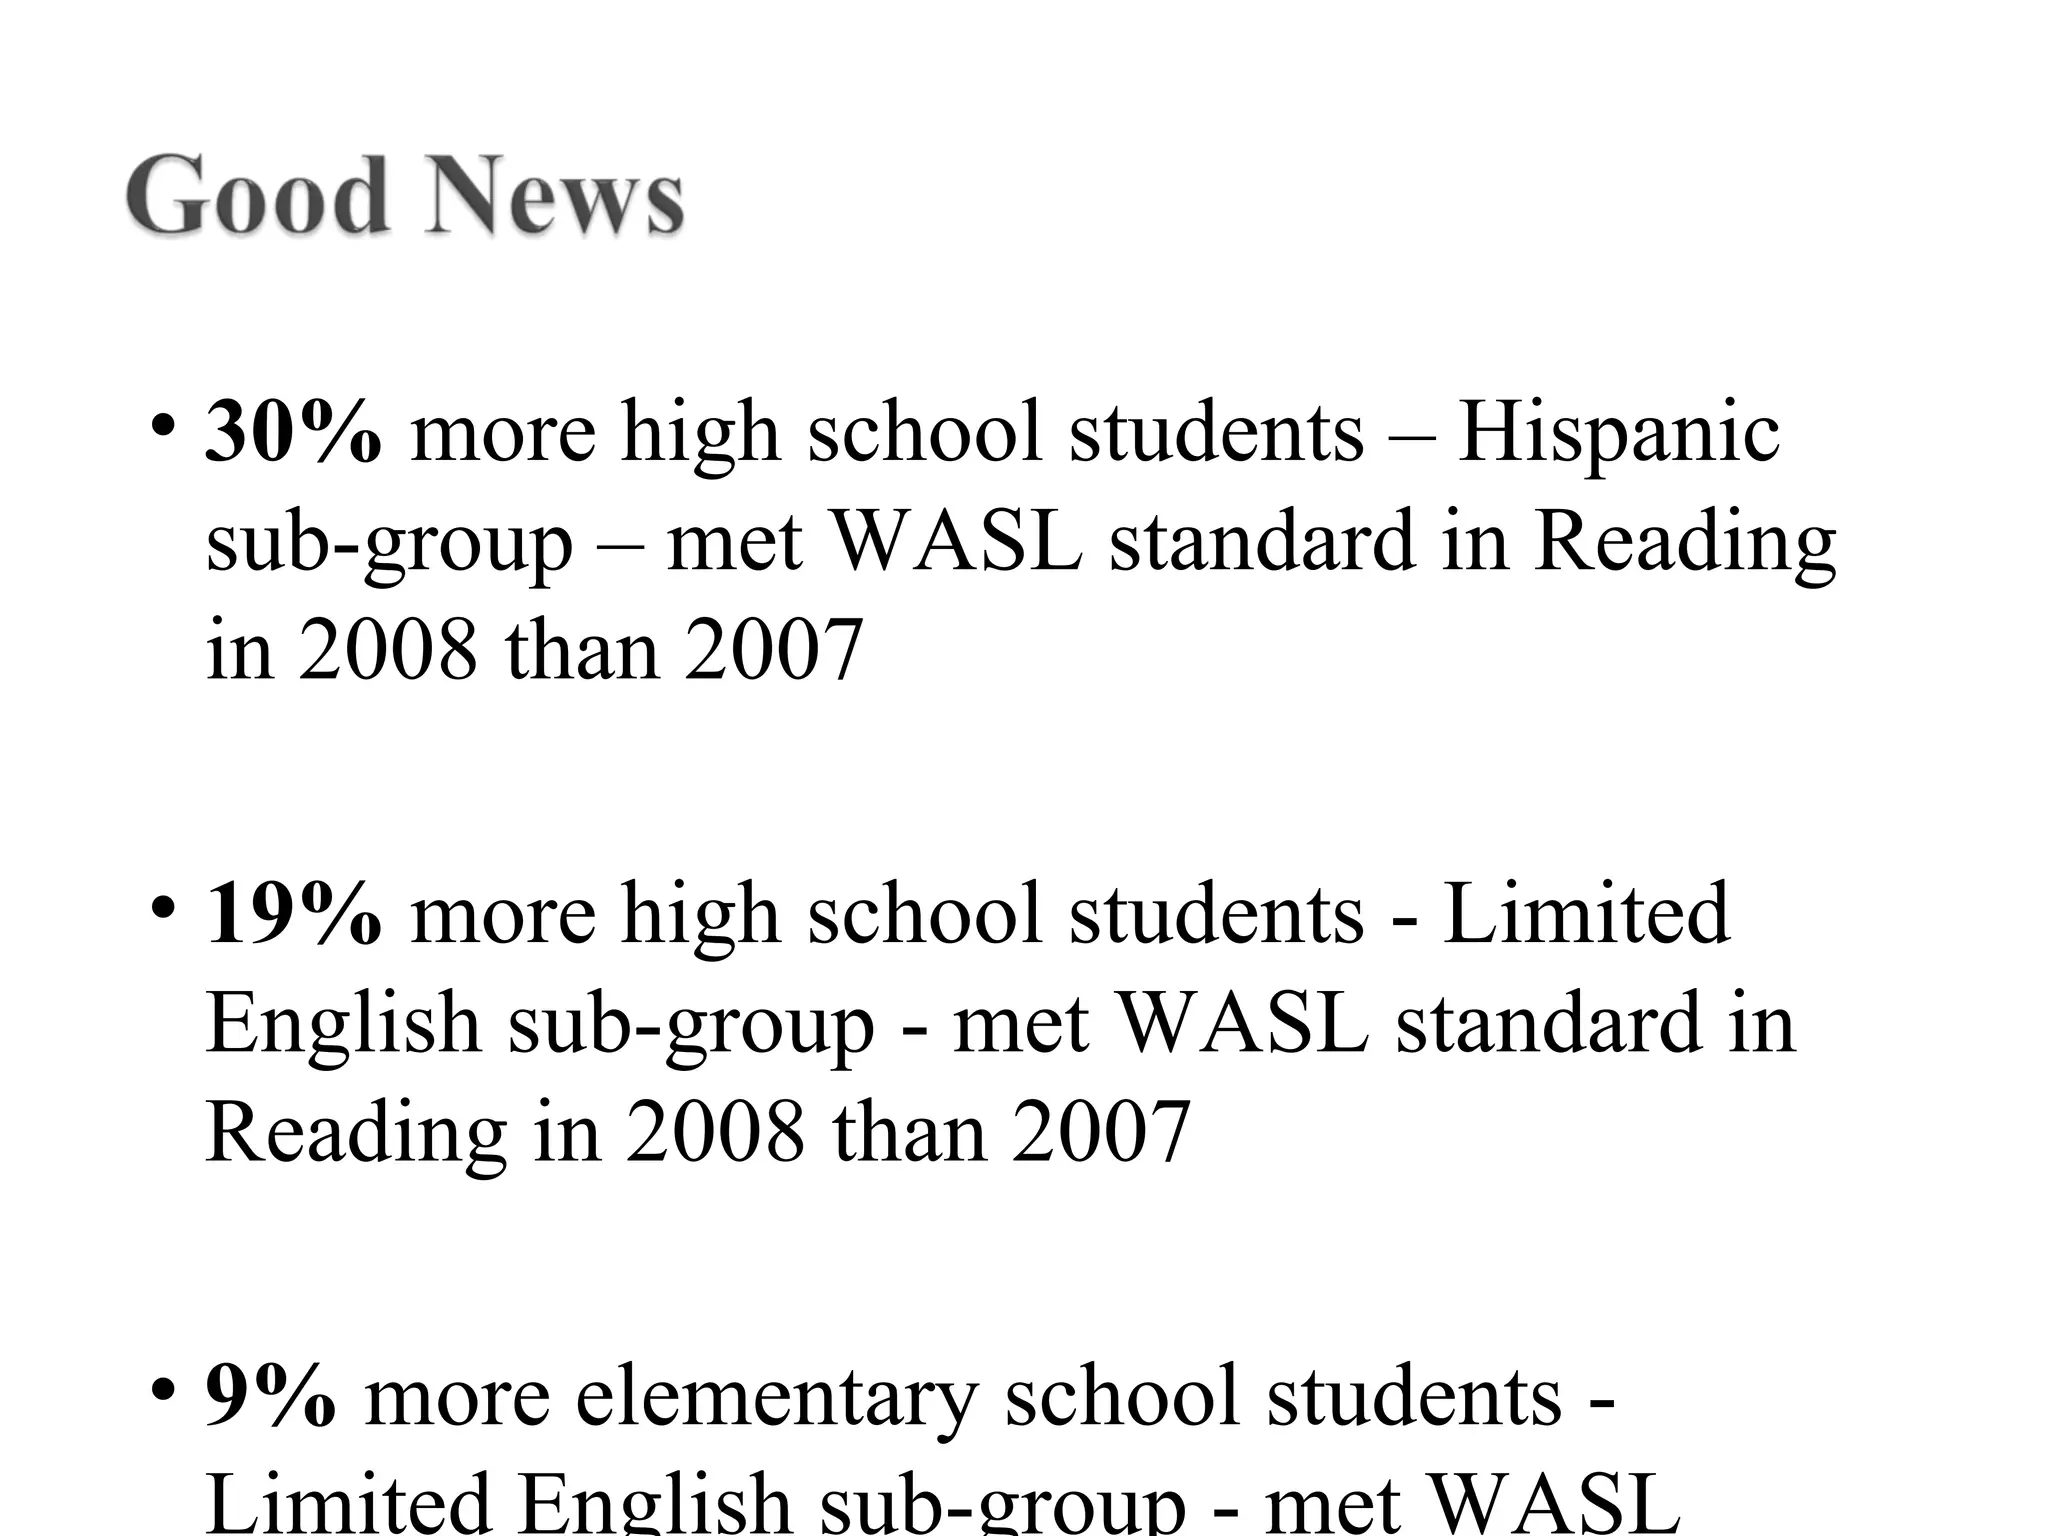
33.
• 30% morehigh school students – Hispanic
sub-group – met WASL standard in Reading
in 2008 than 2007
• 19% more high school students - Limited
English sub-group - met WASL standard in
Reading in 2008 than 2007
• 9% more elementary school students -
Limited English sub-group - met WASL
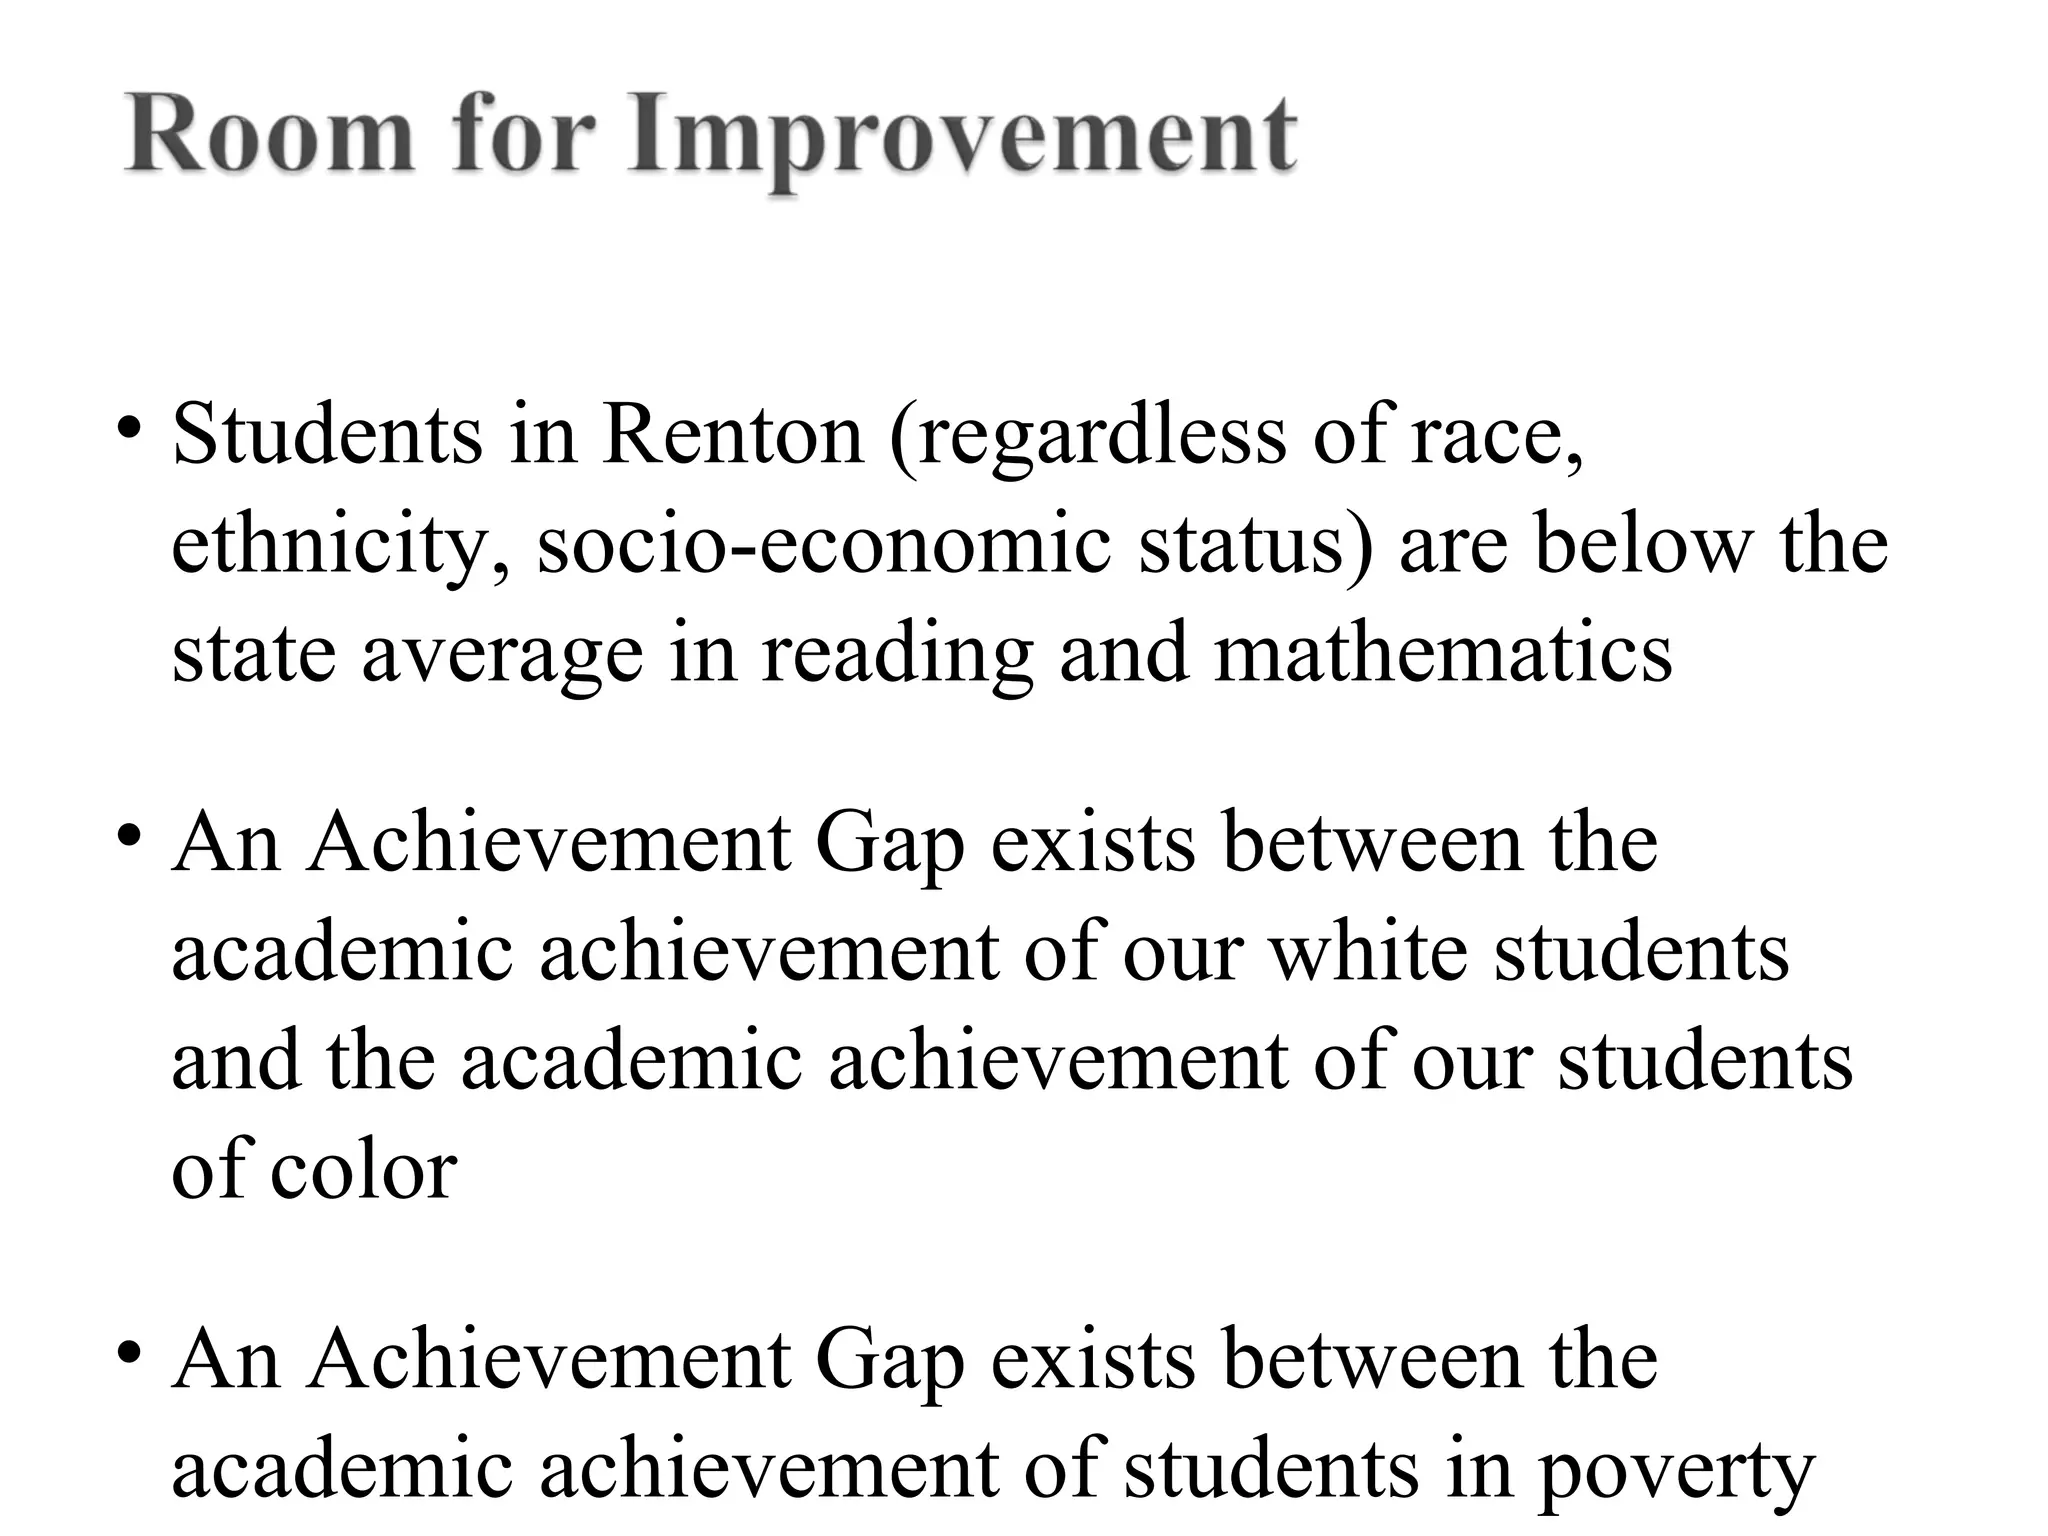
• Students inRenton (regardless of race,
ethnicity, socio-economic status) are below the
state average in reading and mathematics
• An Achievement Gap exists between the
academic achievement of our white students
and the academic achievement of our students
of color
• An Achievement Gap exists between the
academic achievement of students in poverty
38.
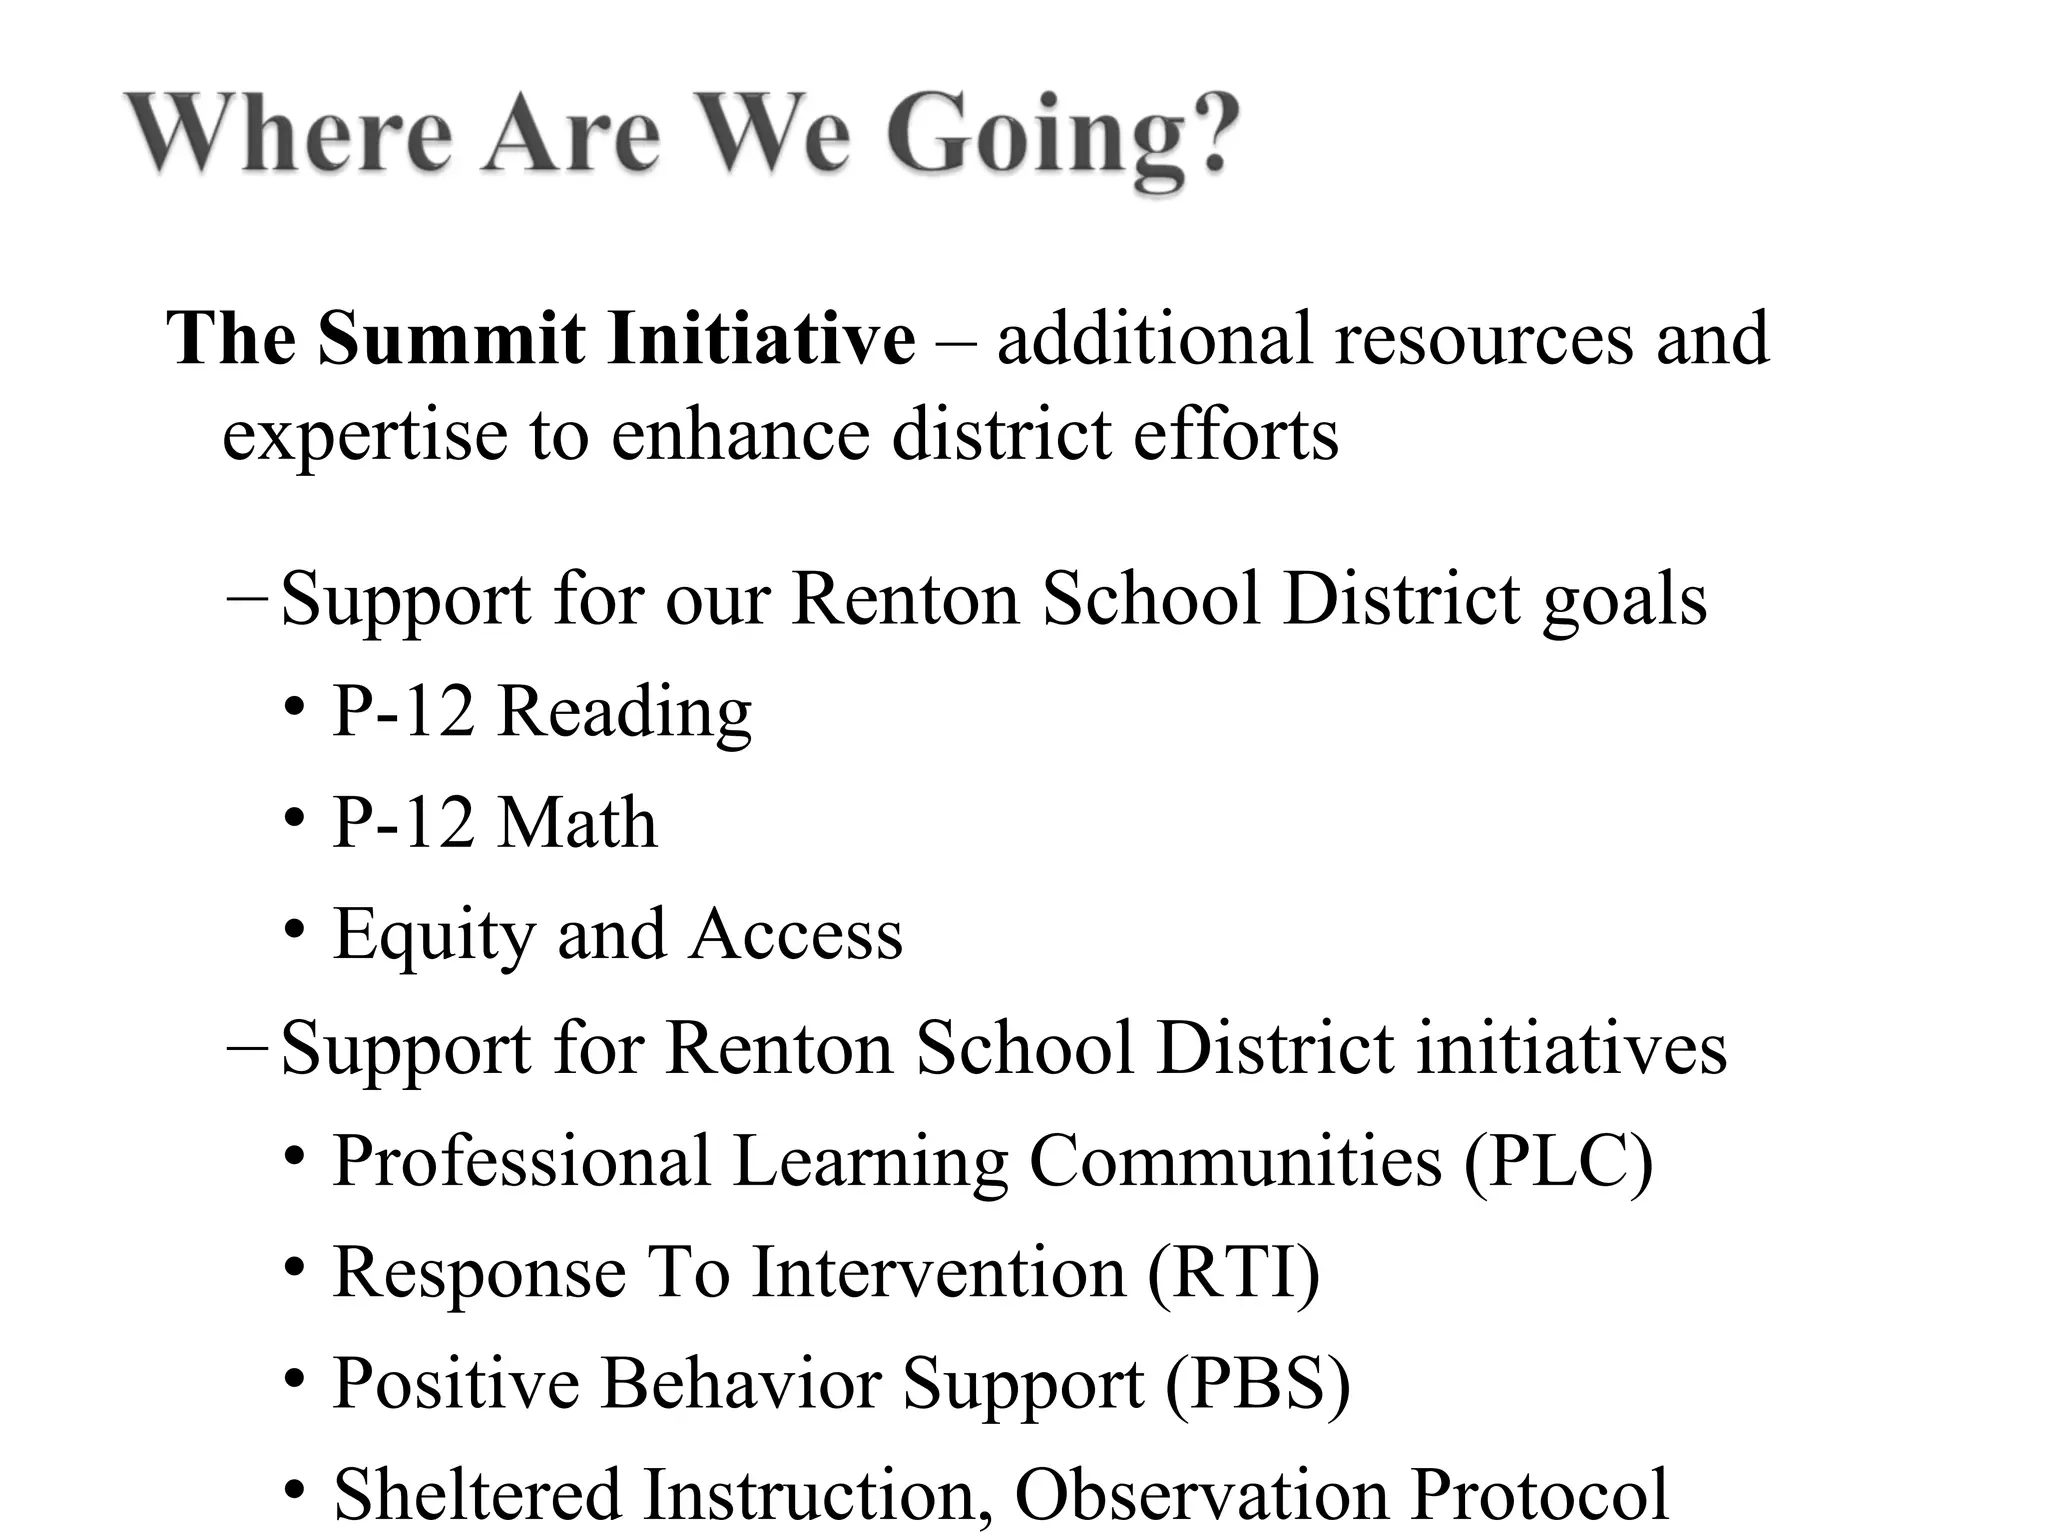
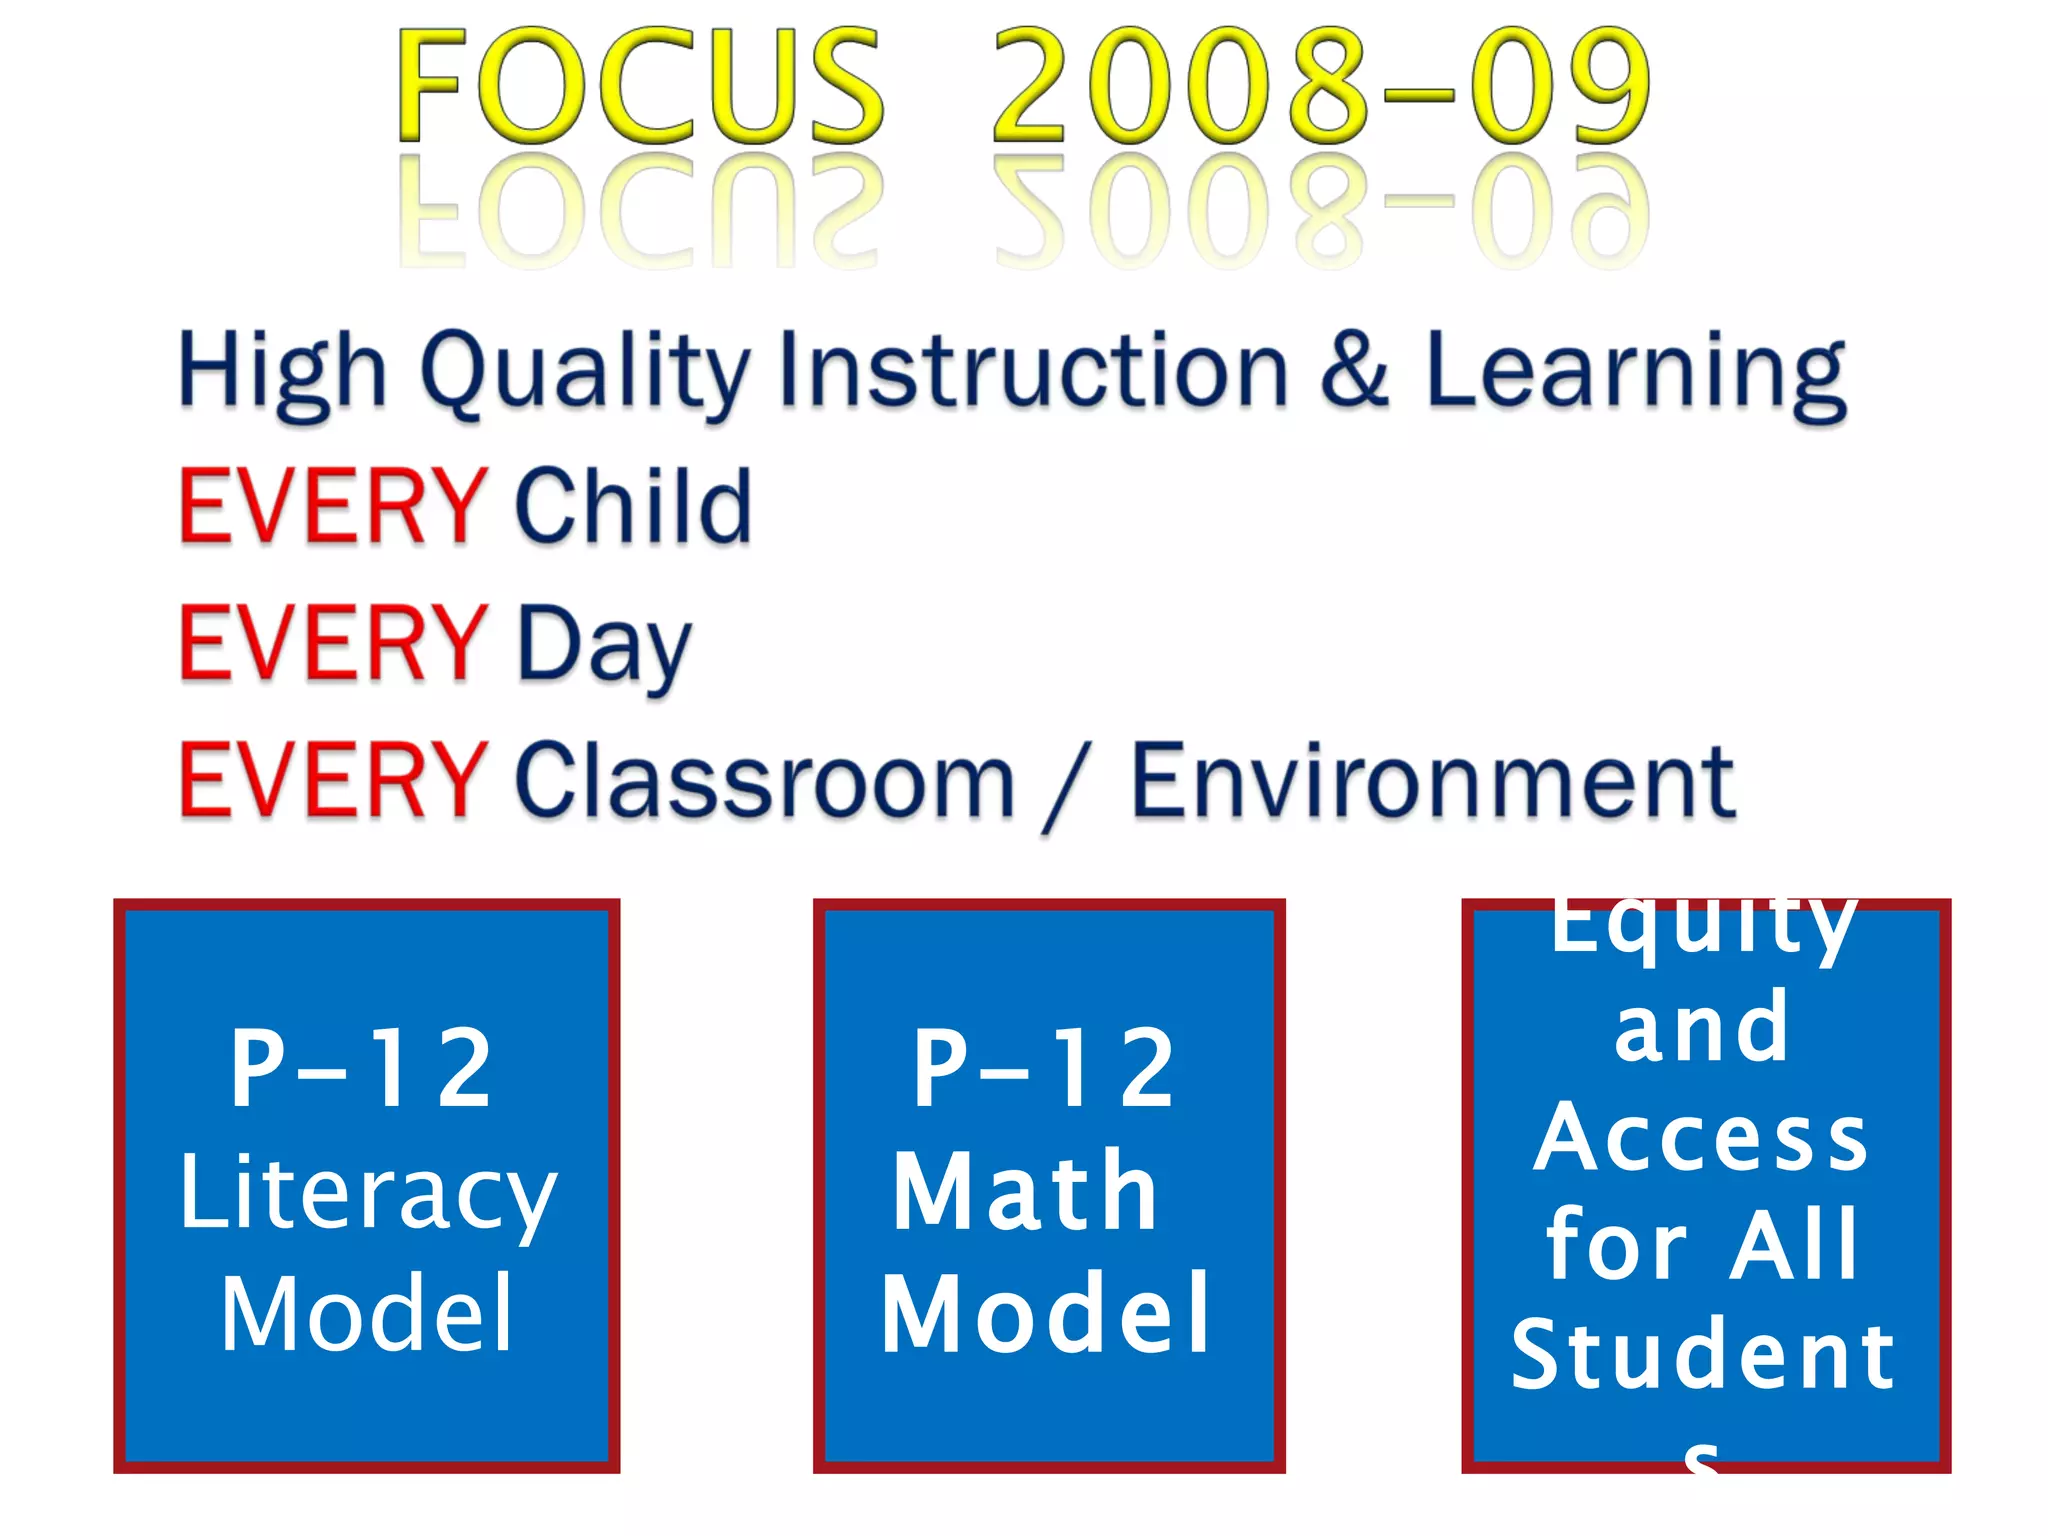
The Summit Initiative– additional resources and
expertise to enhance district efforts
–Support for our Renton School District goals
• P-12 Reading
• P-12 Math
• Equity and Access
–Support for Renton School District initiatives
• Professional Learning Communities (PLC)
• Response To Intervention (RTI)
• Positive Behavior Support (PBS)
• Sheltered Instruction, Observation Protocol
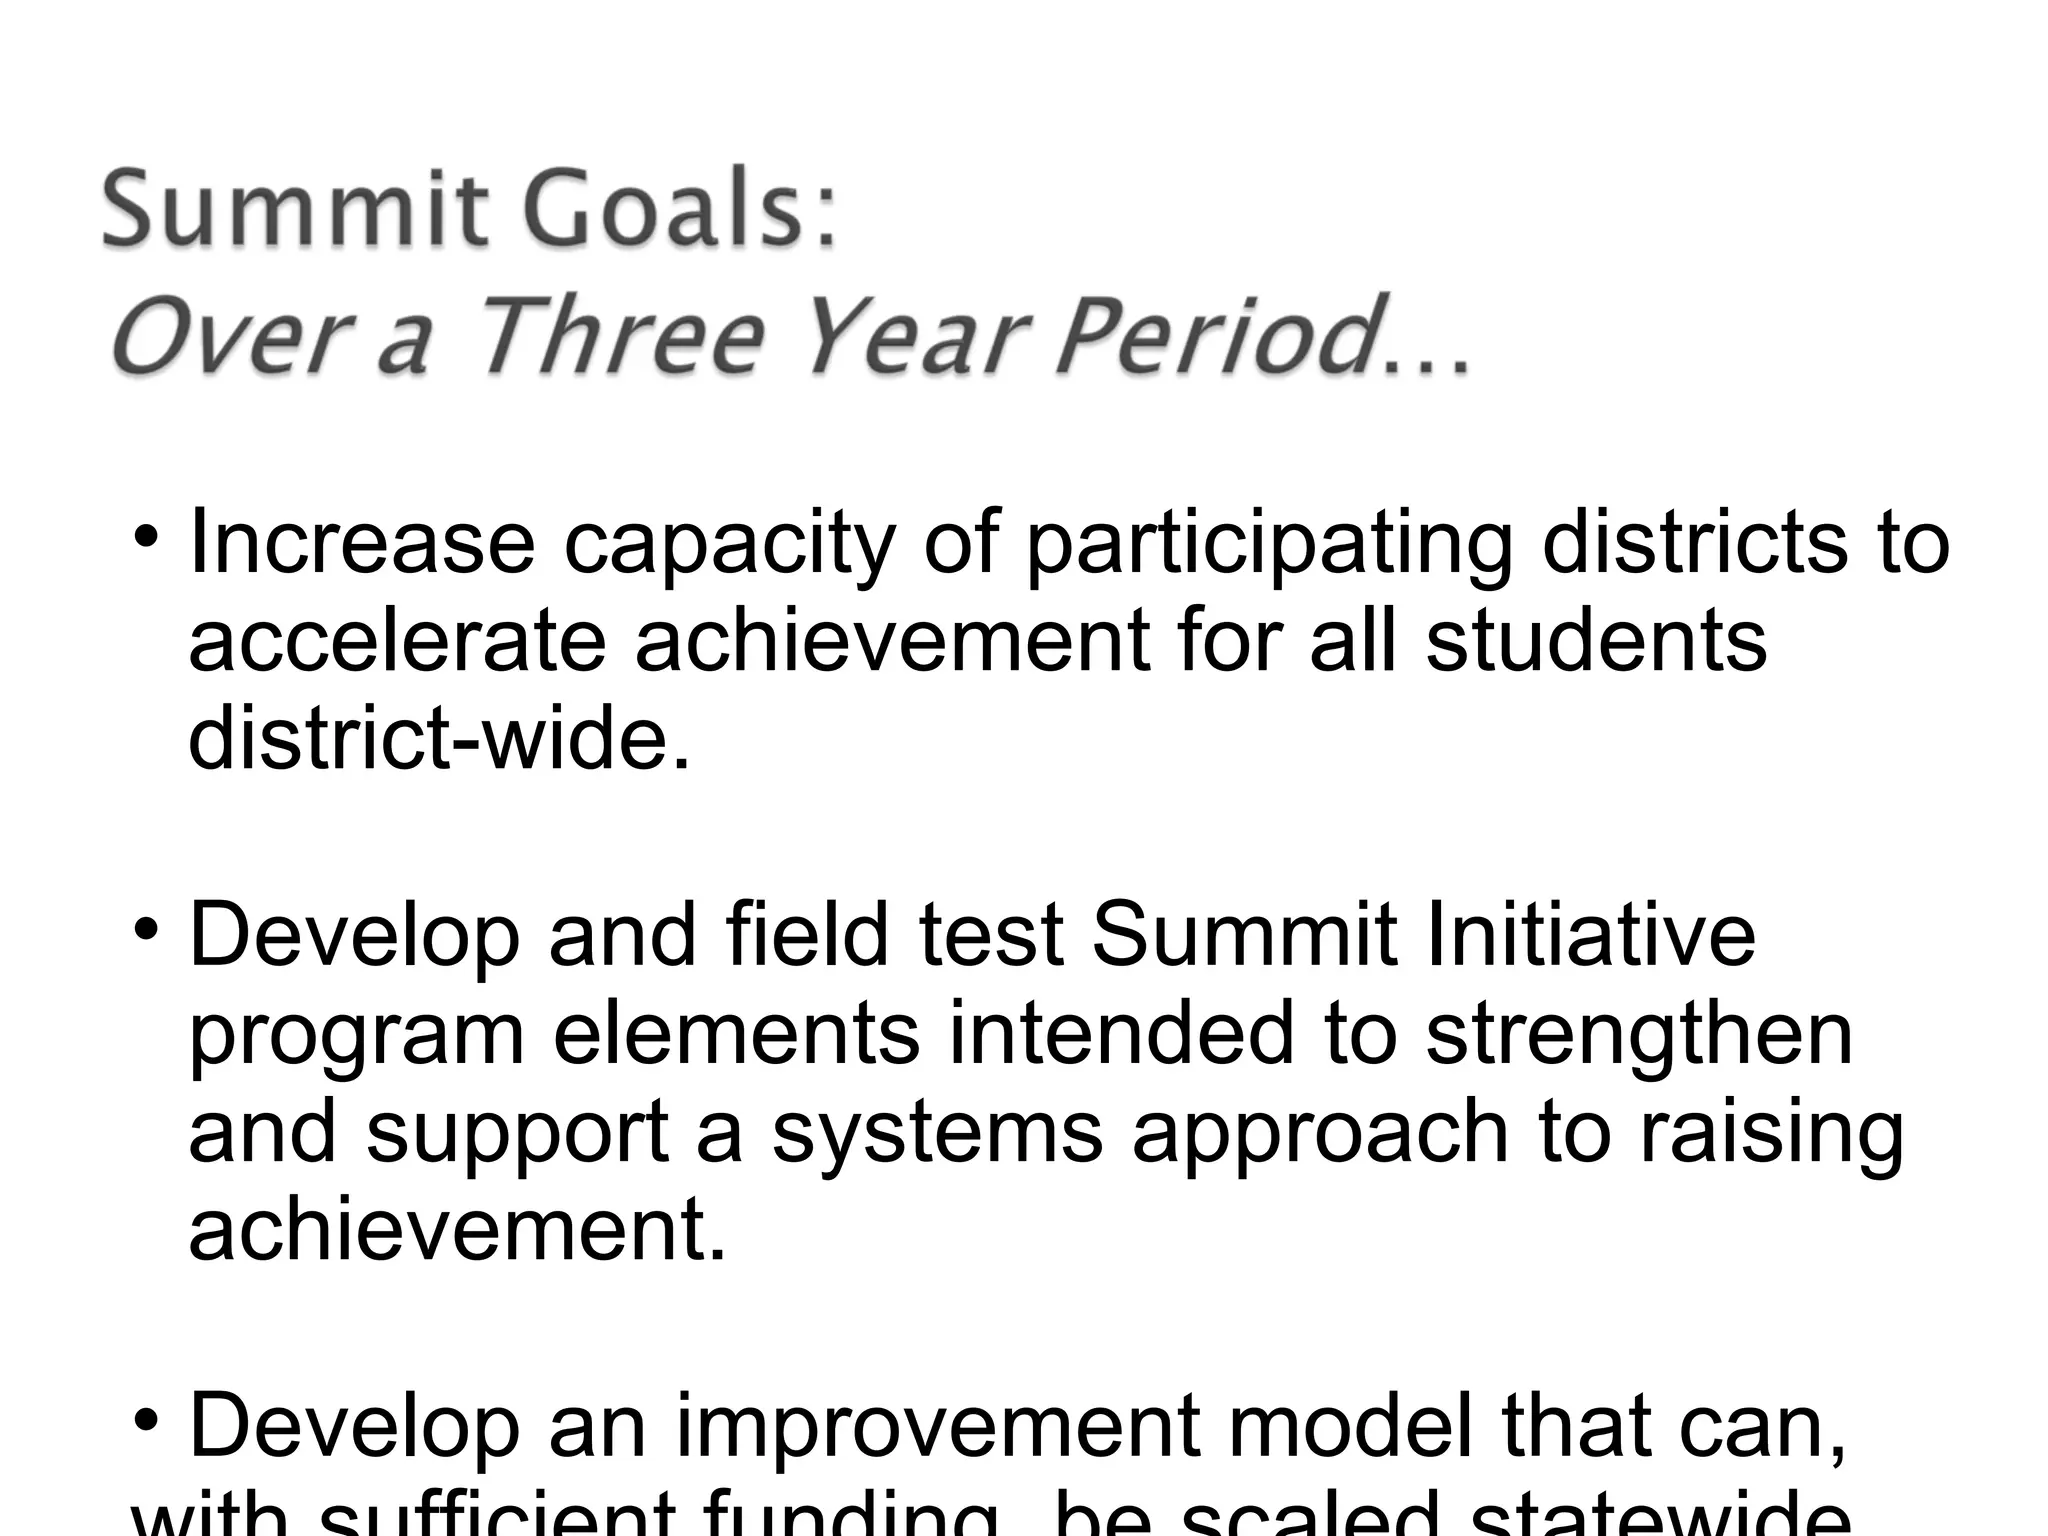
• Increase capacityof participating districts to
accelerate achievement for all students
district-wide.
• Develop and field test Summit Initiative
program elements intended to strengthen
and support a systems approach to raising
achievement.
• Develop an improvement model that can,
42.
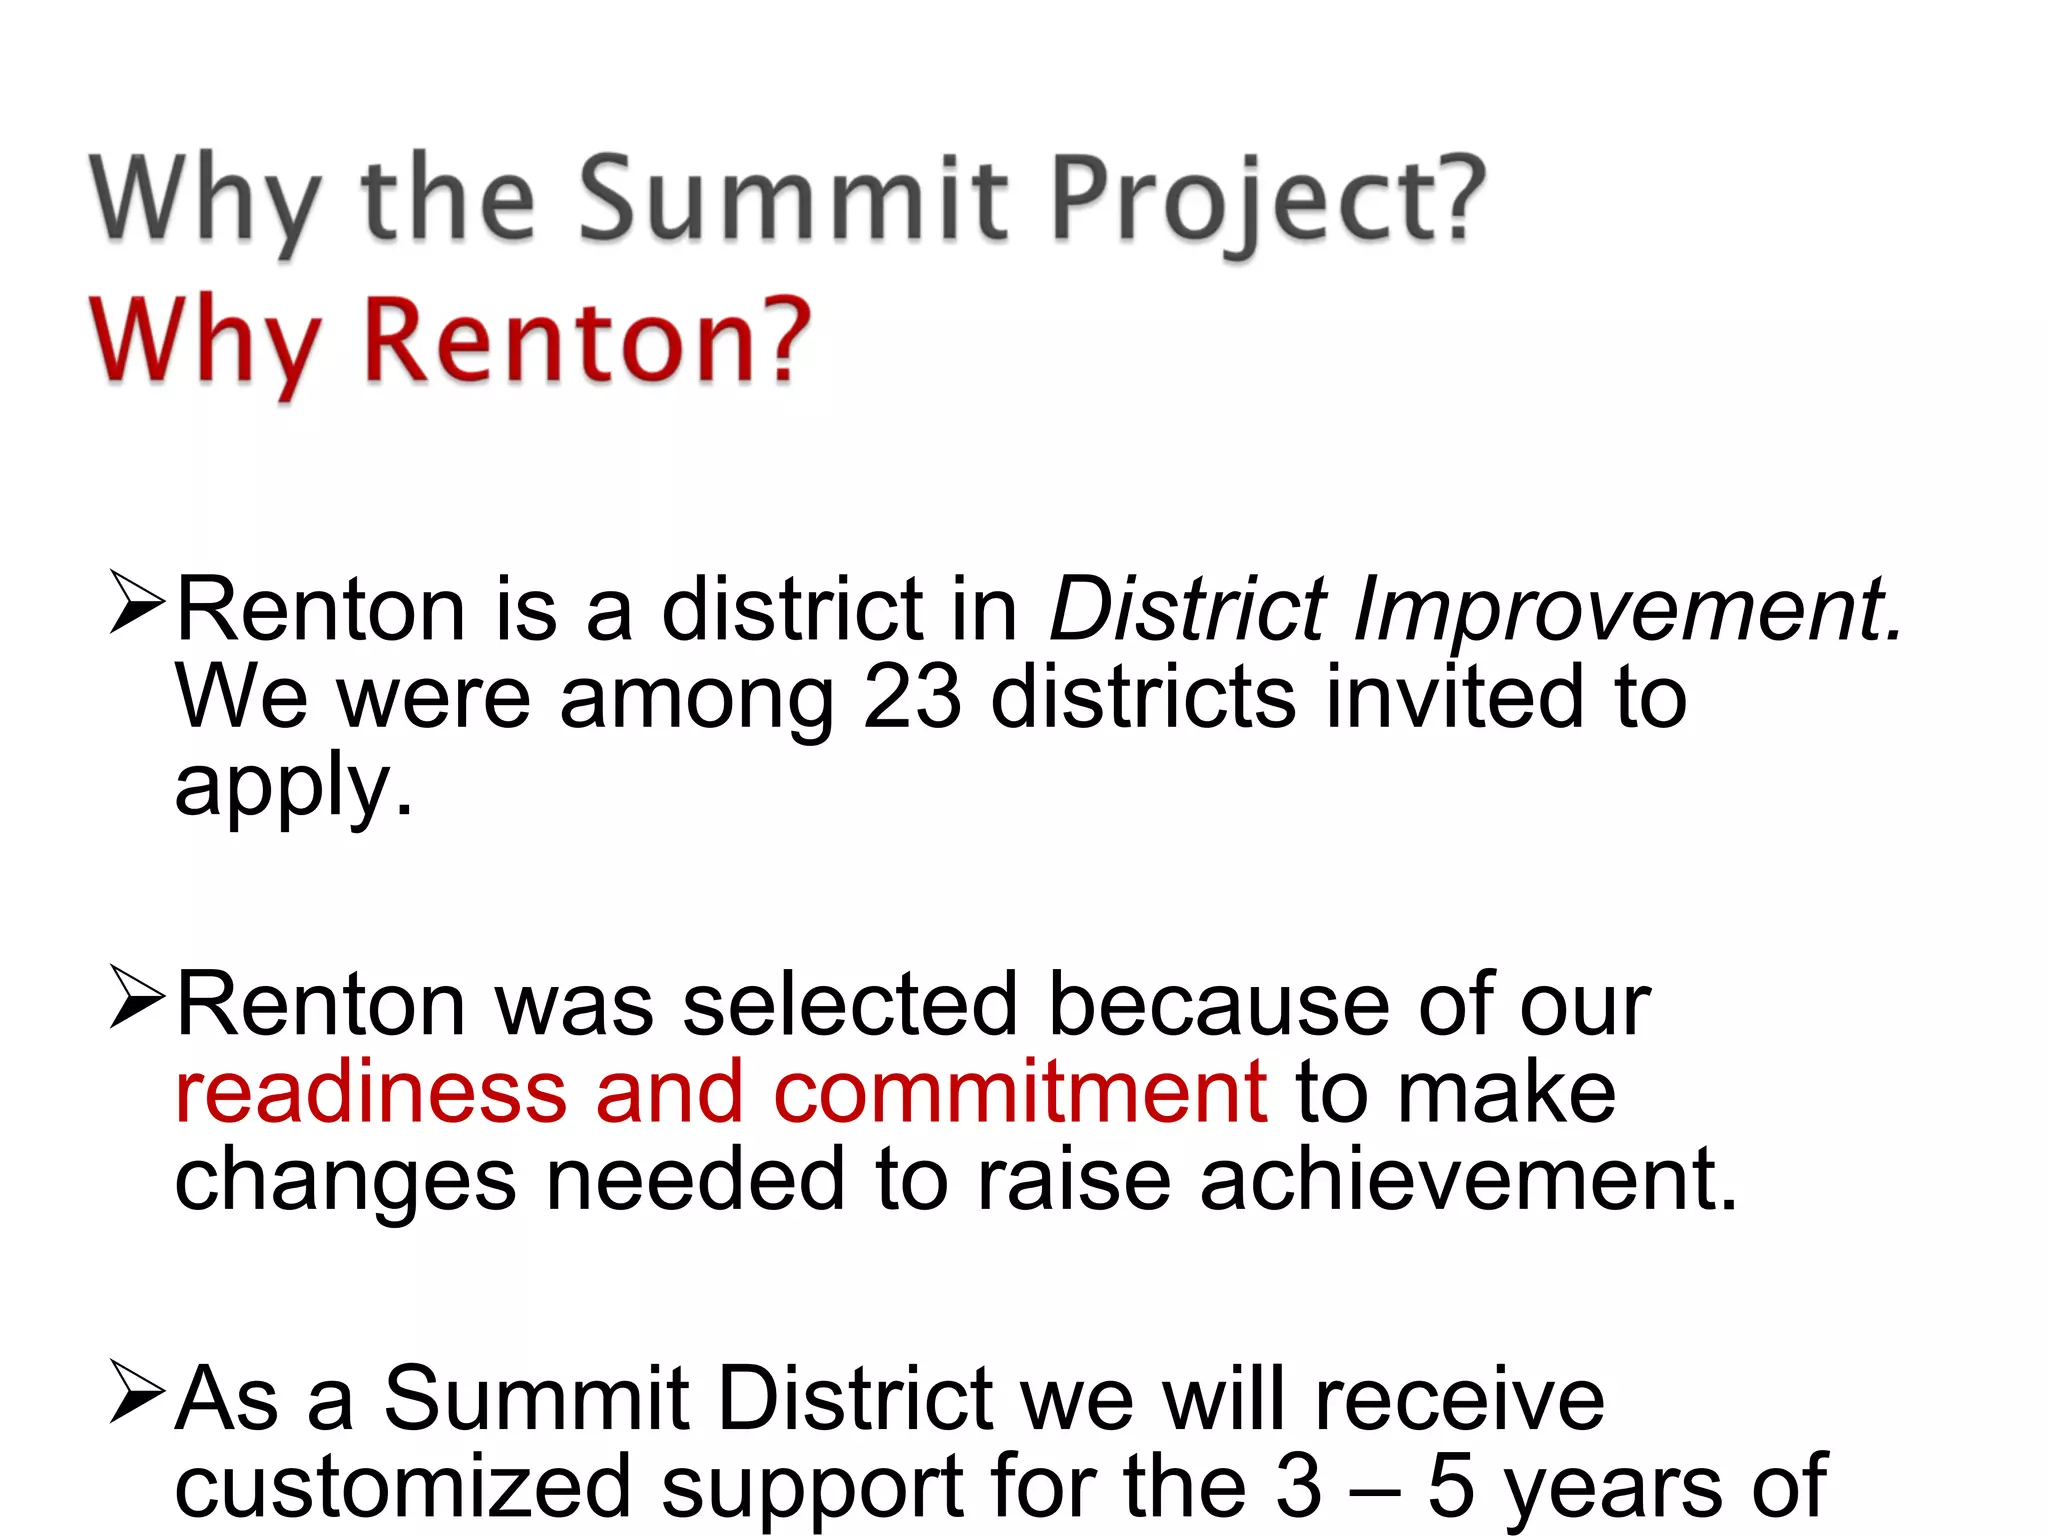
Renton is adistrict in District Improvement.
We were among 23 districts invited to
apply.
Renton was selected because of our
readiness and commitment to make
changes needed to raise achievement.
As a Summit District we will receive
customized support for the 3 – 5 years of
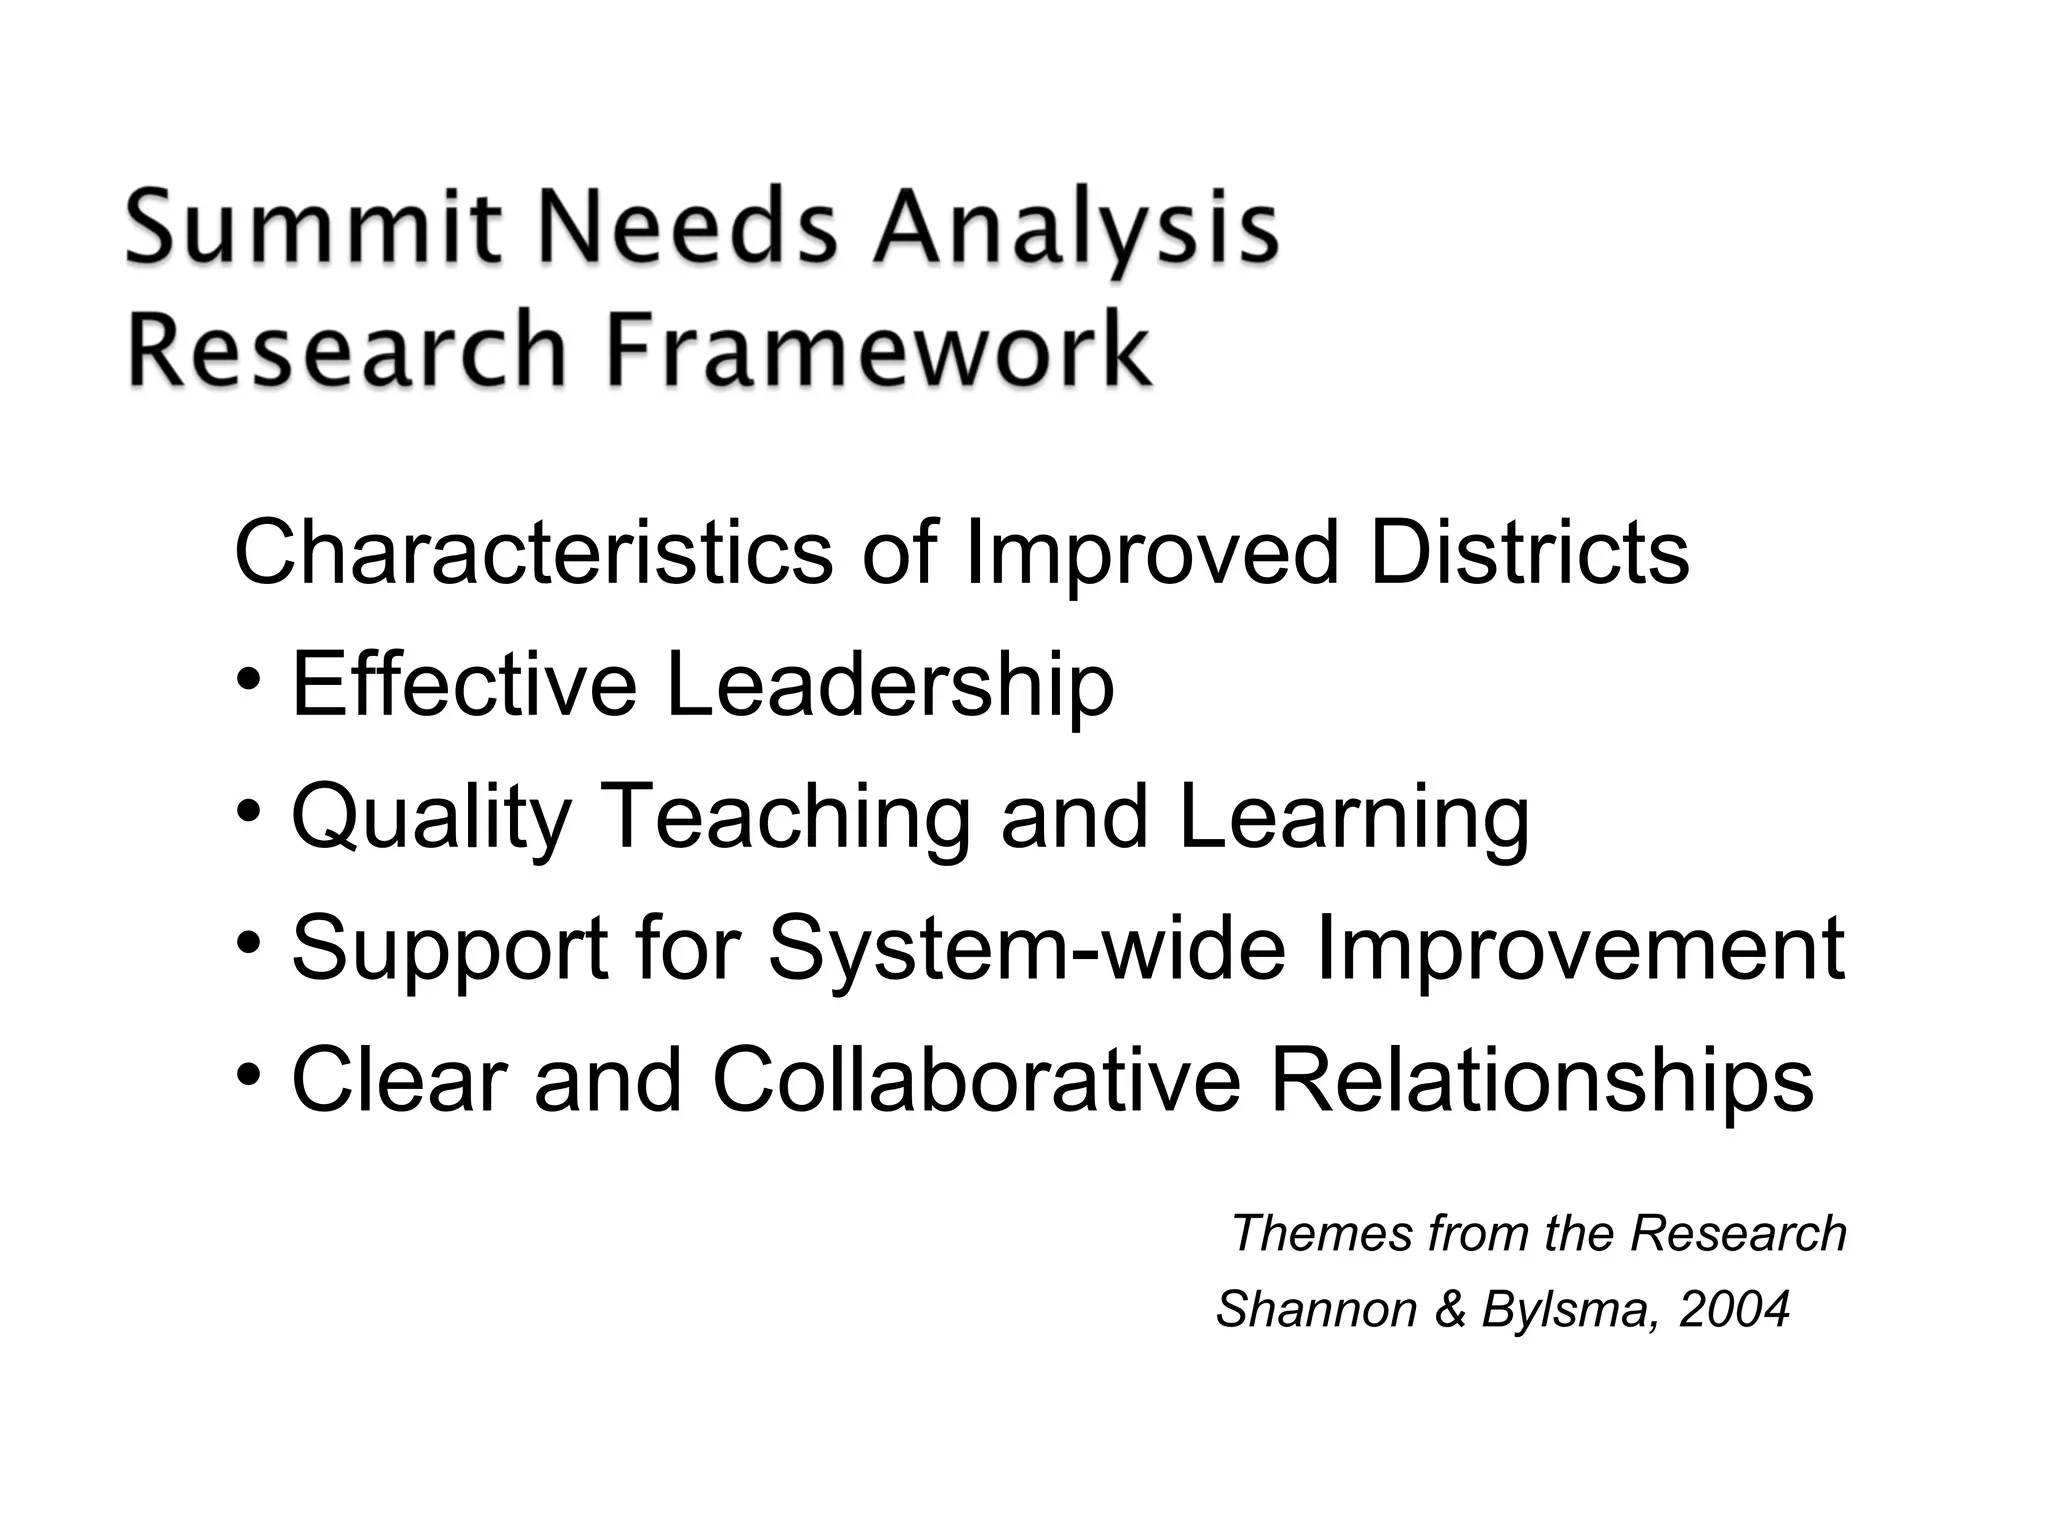
Characteristics of ImprovedDistricts
• Effective Leadership
• Quality Teaching and Learning
• Support for System-wide Improvement
• Clear and Collaborative Relationships
Themes from the Research
Shannon & Bylsma, 2004
46.
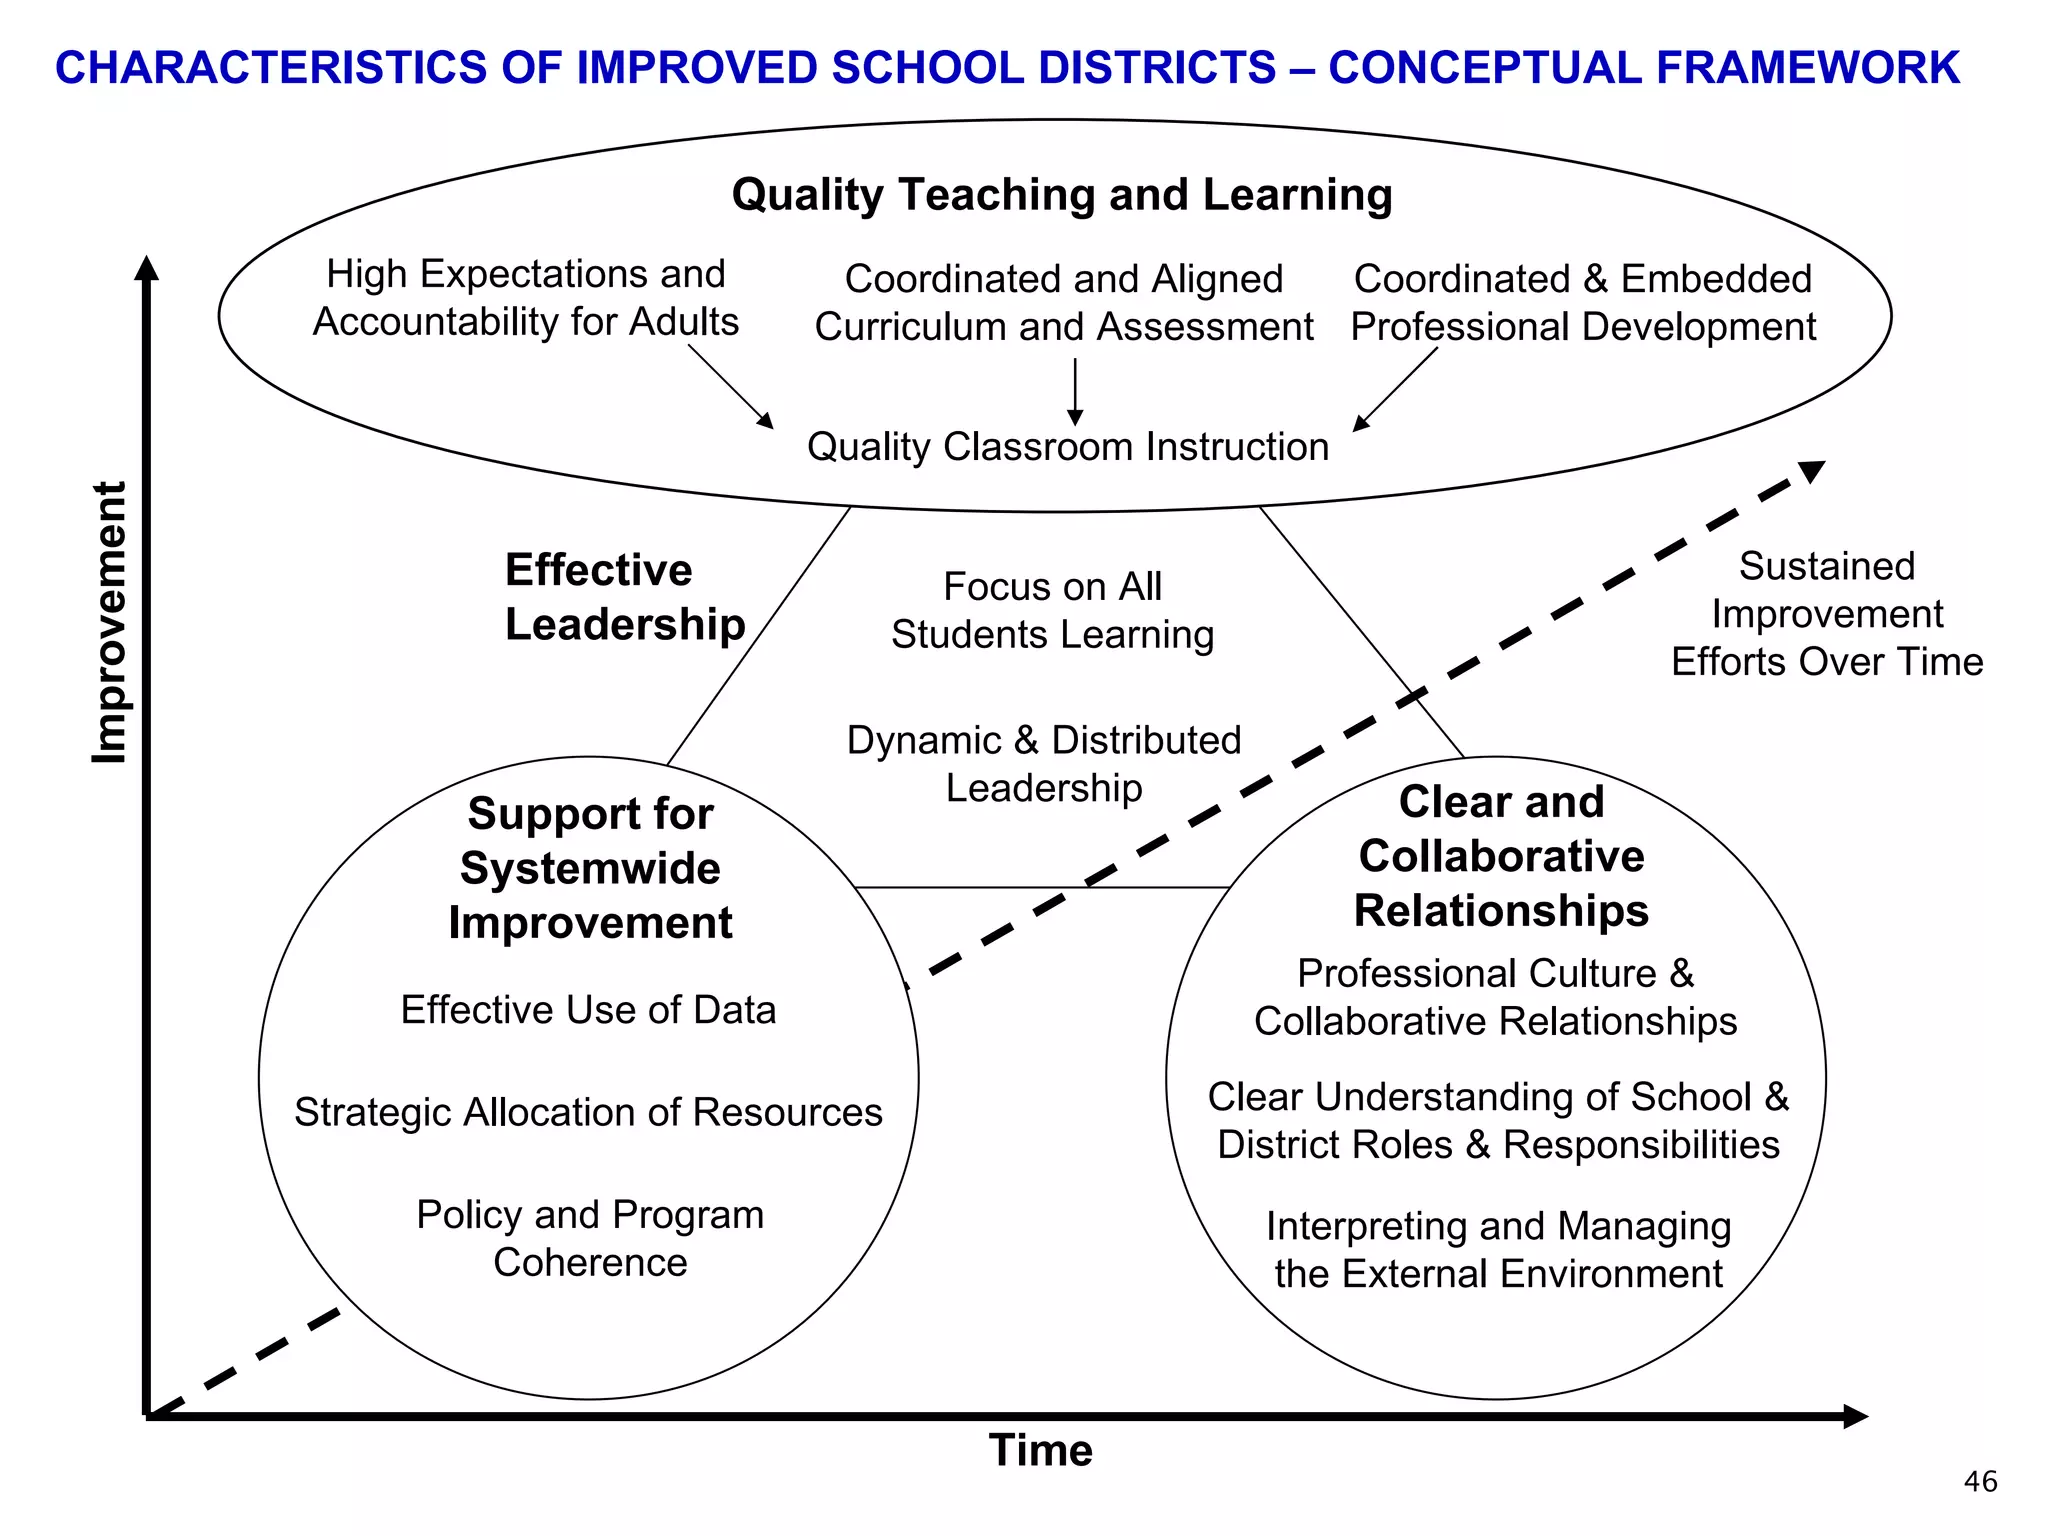
Focus on All
StudentsLearning
Dynamic & Distributed
Leadership
Support for
Systemwide
Improvement
Effective Use of Data
Strategic Allocation of Resources
Policy and Program
Coherence
Clear and
Collaborative
Relationships
Professional Culture &
Collaborative Relationships
Clear Understanding of School &
District Roles & Responsibilities
Interpreting and Managing
the External Environment
Effective
Leadership
Sustained
Improvement
Efforts Over Time
Quality Teaching and Learning
High Expectations and
Accountability for Adults
Coordinated and Aligned
Curriculum and Assessment
Coordinated & Embedded
Professional Development
Quality Classroom Instruction
Time
Improvement
CHARACTERISTICS OF IMPROVED SCHOOL DISTRICTS – CONCEPTUAL FRAMEWORK
46
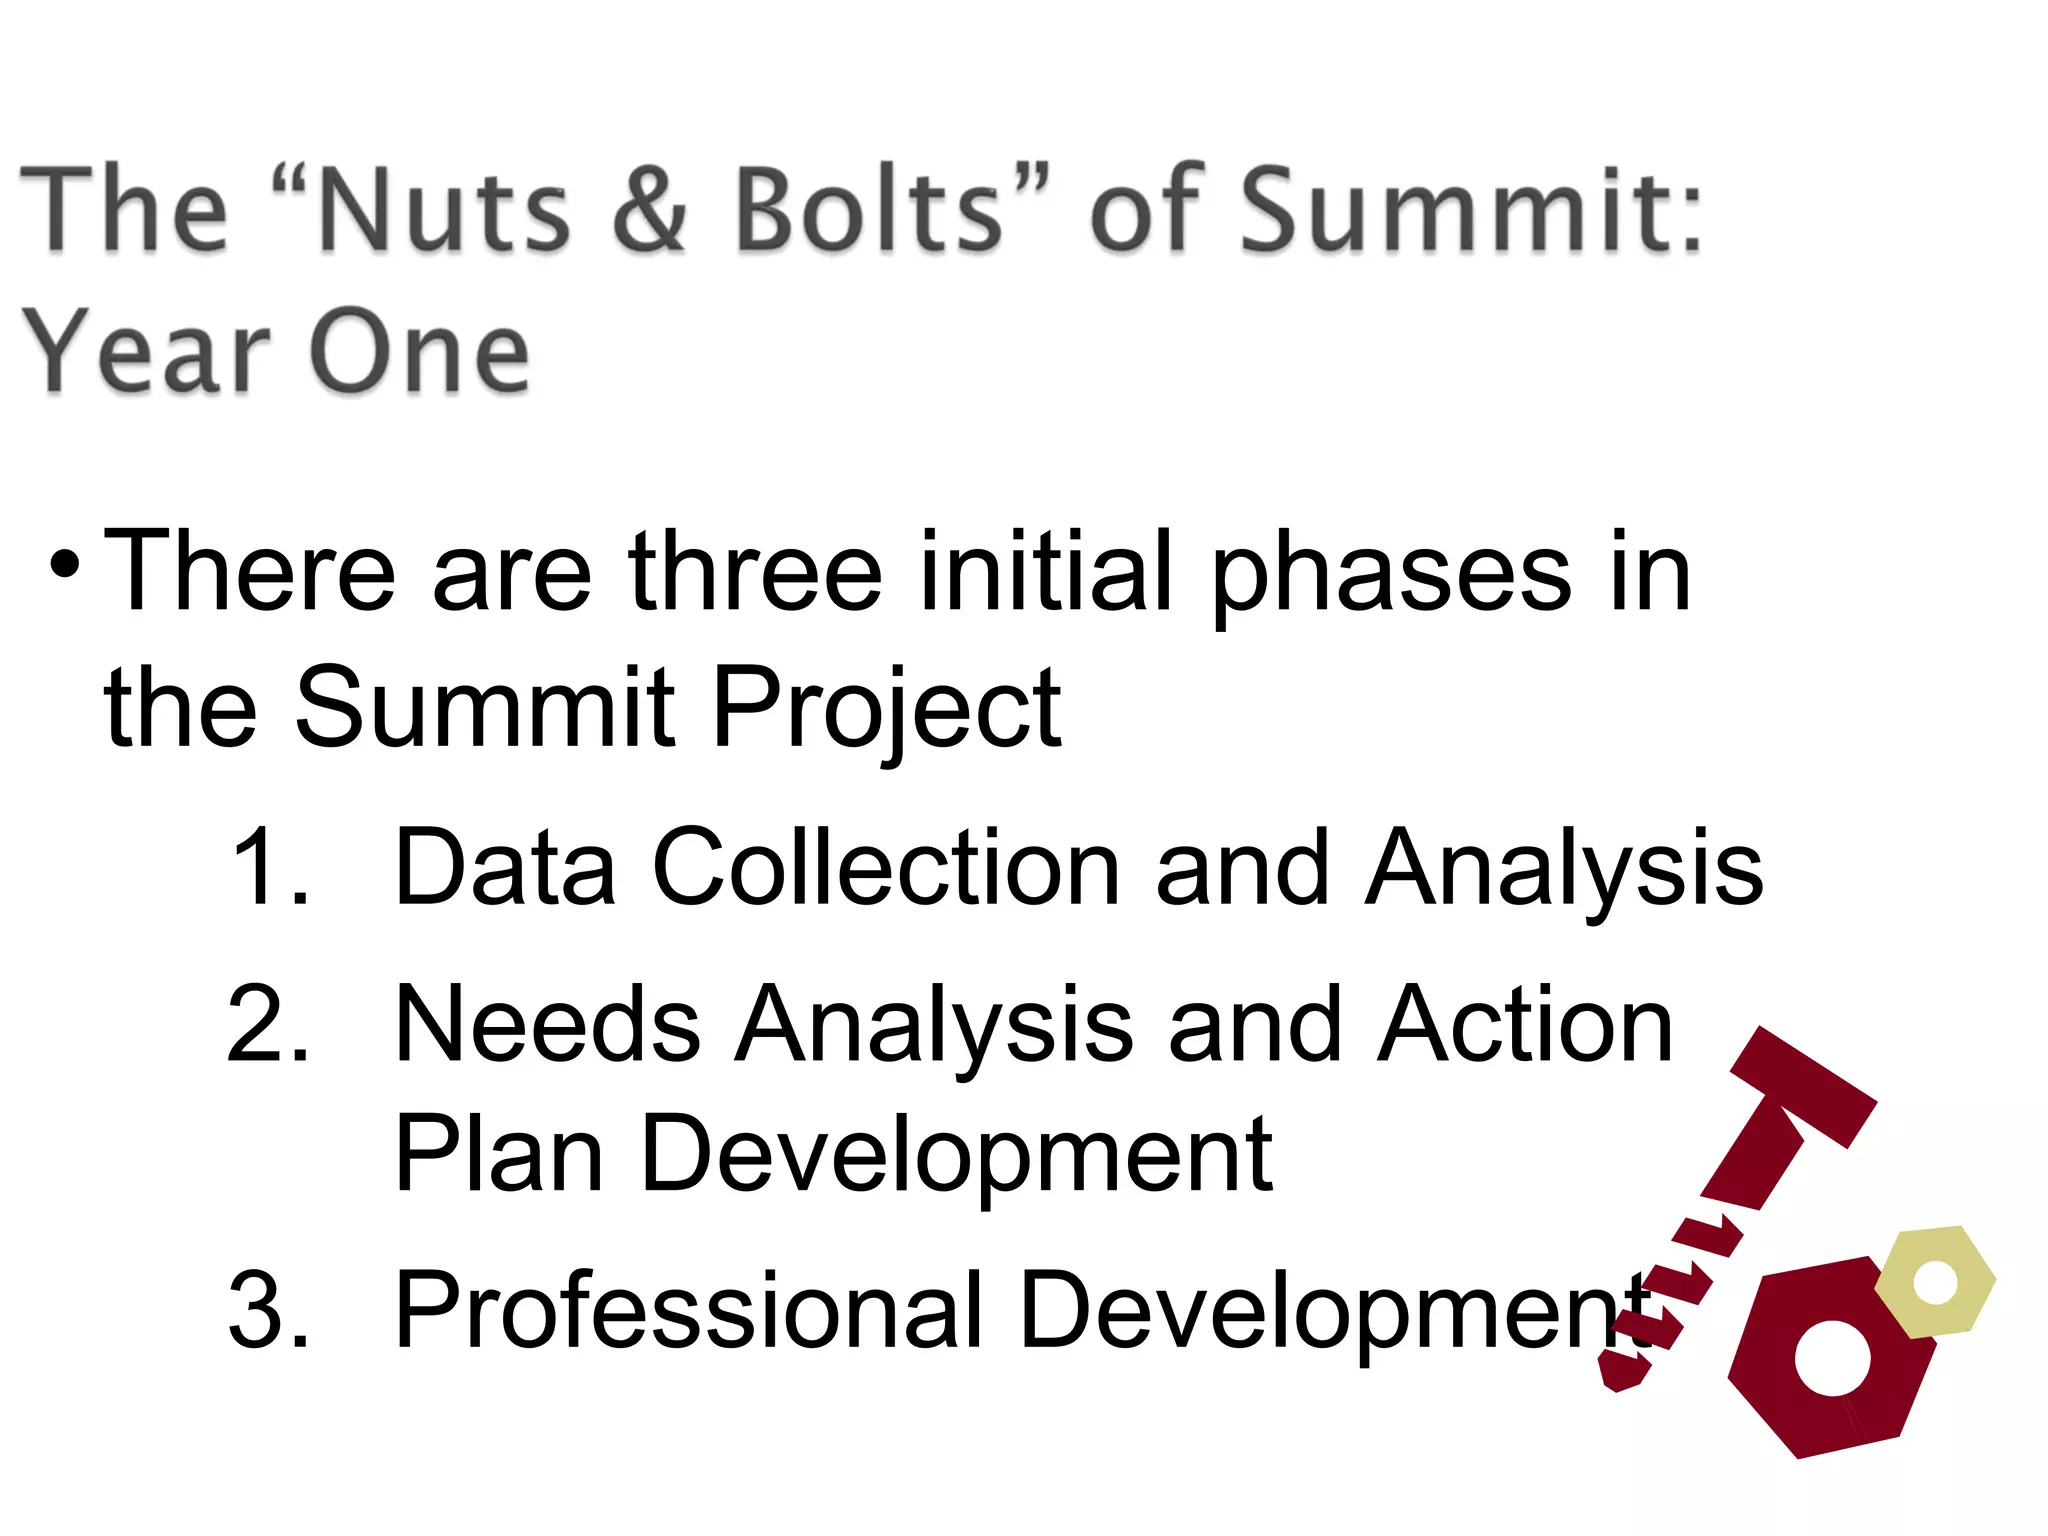
47.
• There arethree initial phases in
the Summit Project
1. Data Collection and Analysis
2. Needs Analysis and Action
Plan Development
3. Professional Development
48.
• External DistrictImprovement Facilitator
(DIF)
• School Improvement Facilitators (SIFs)
serving district SIA schools
• Itinerant SIFs working with non-SIA
schools
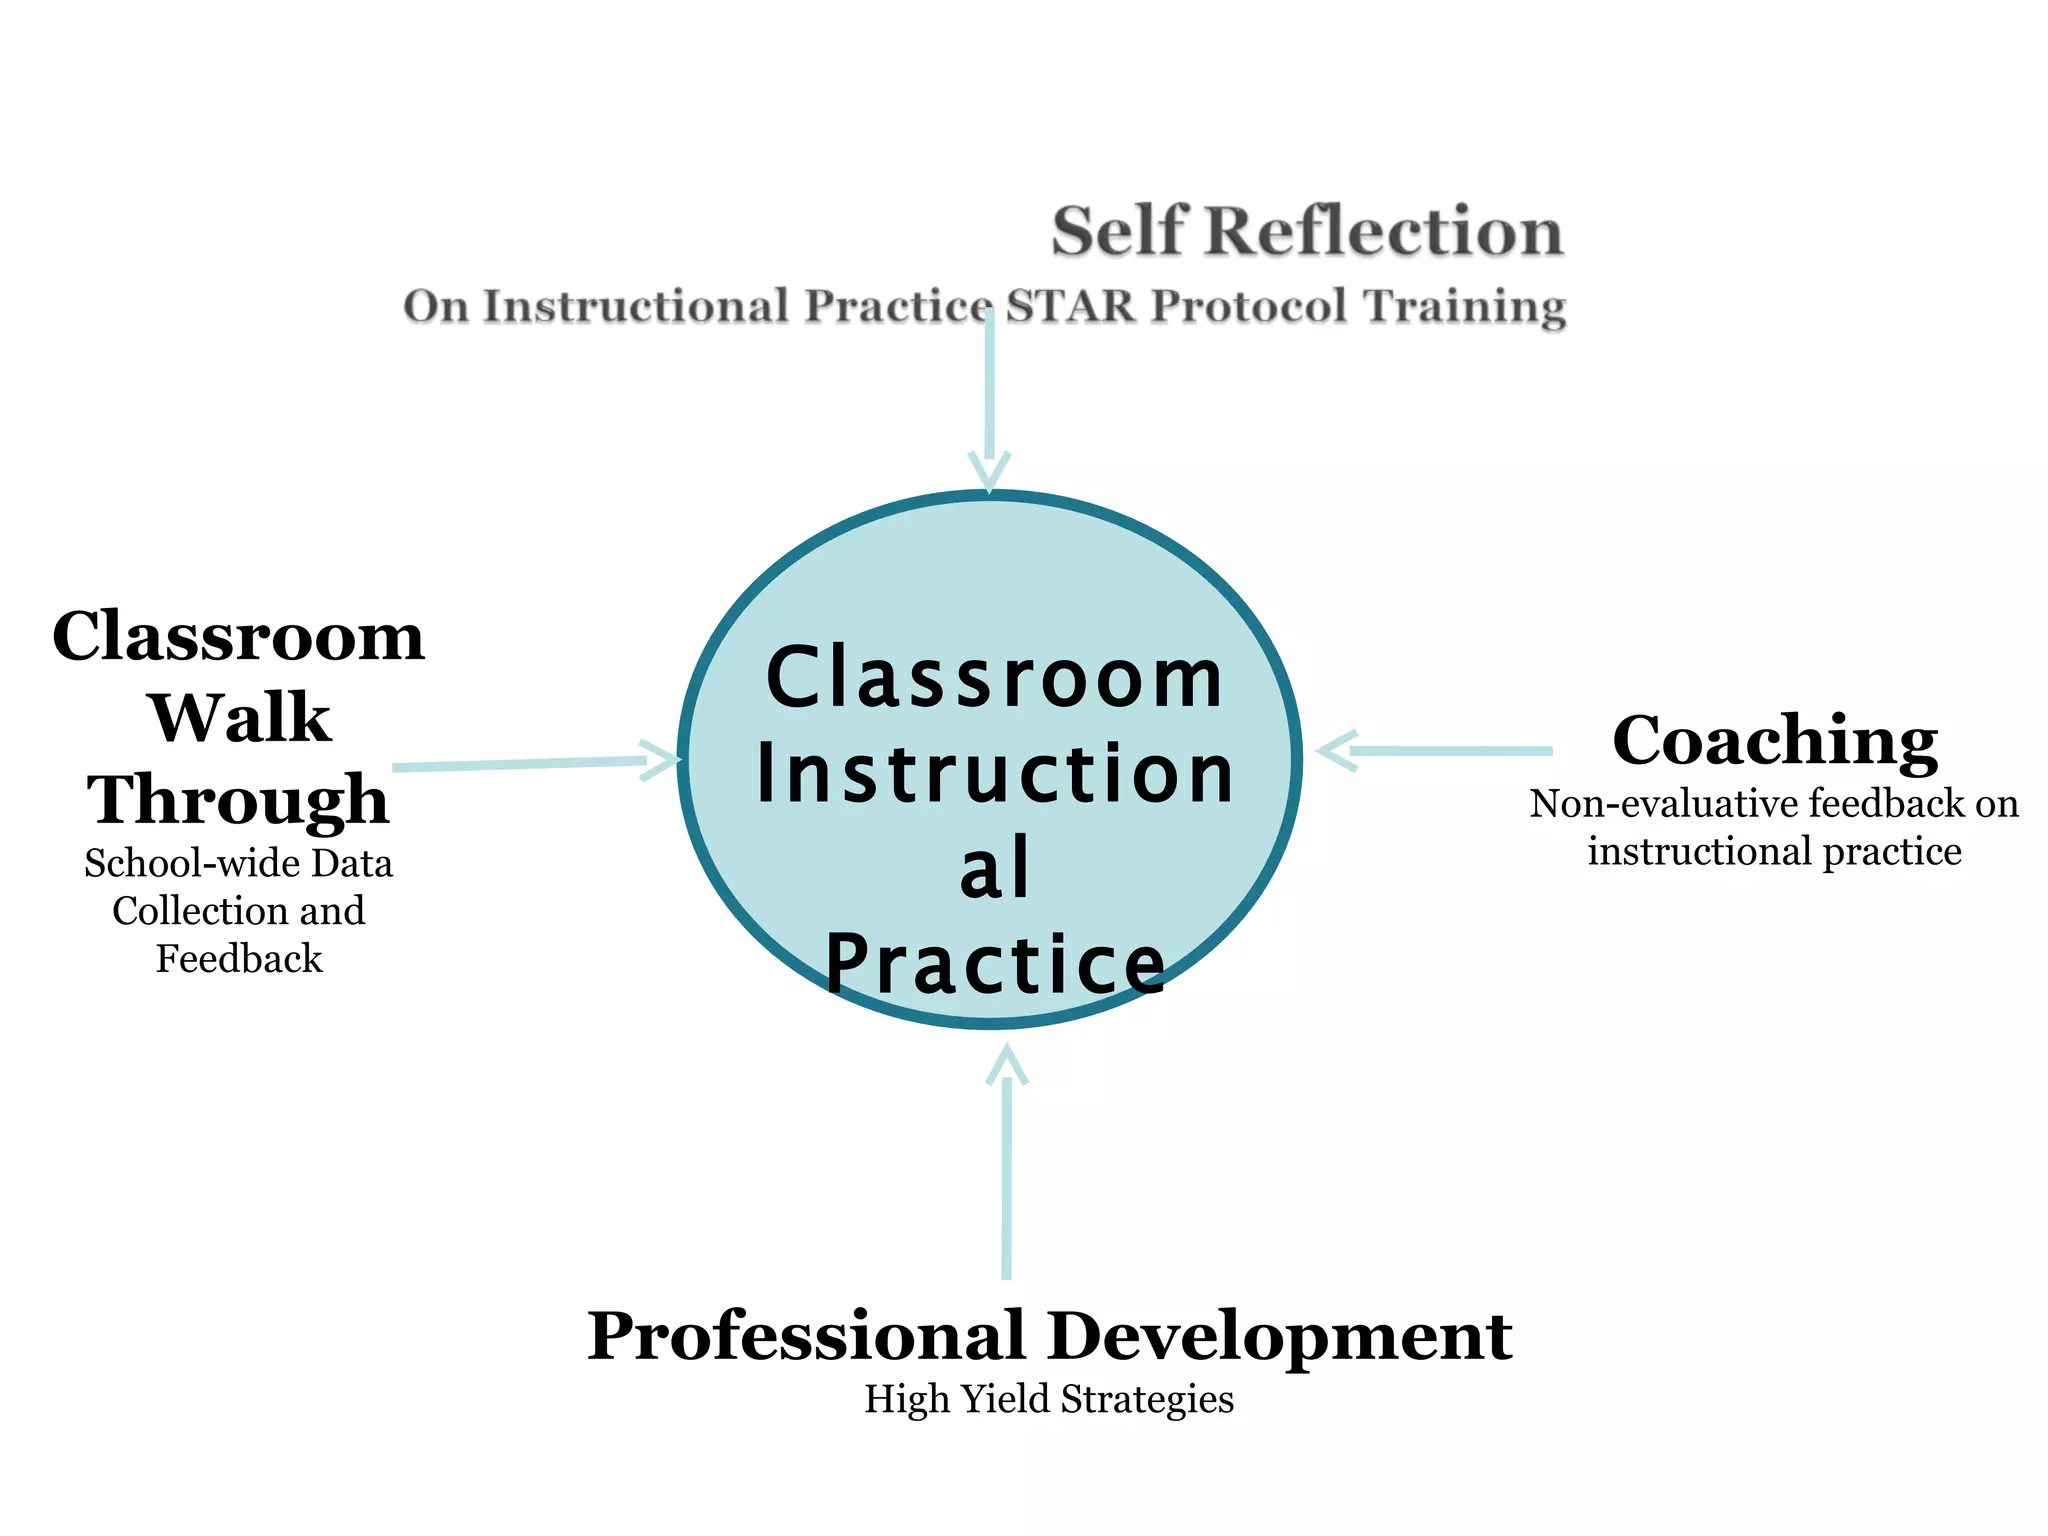
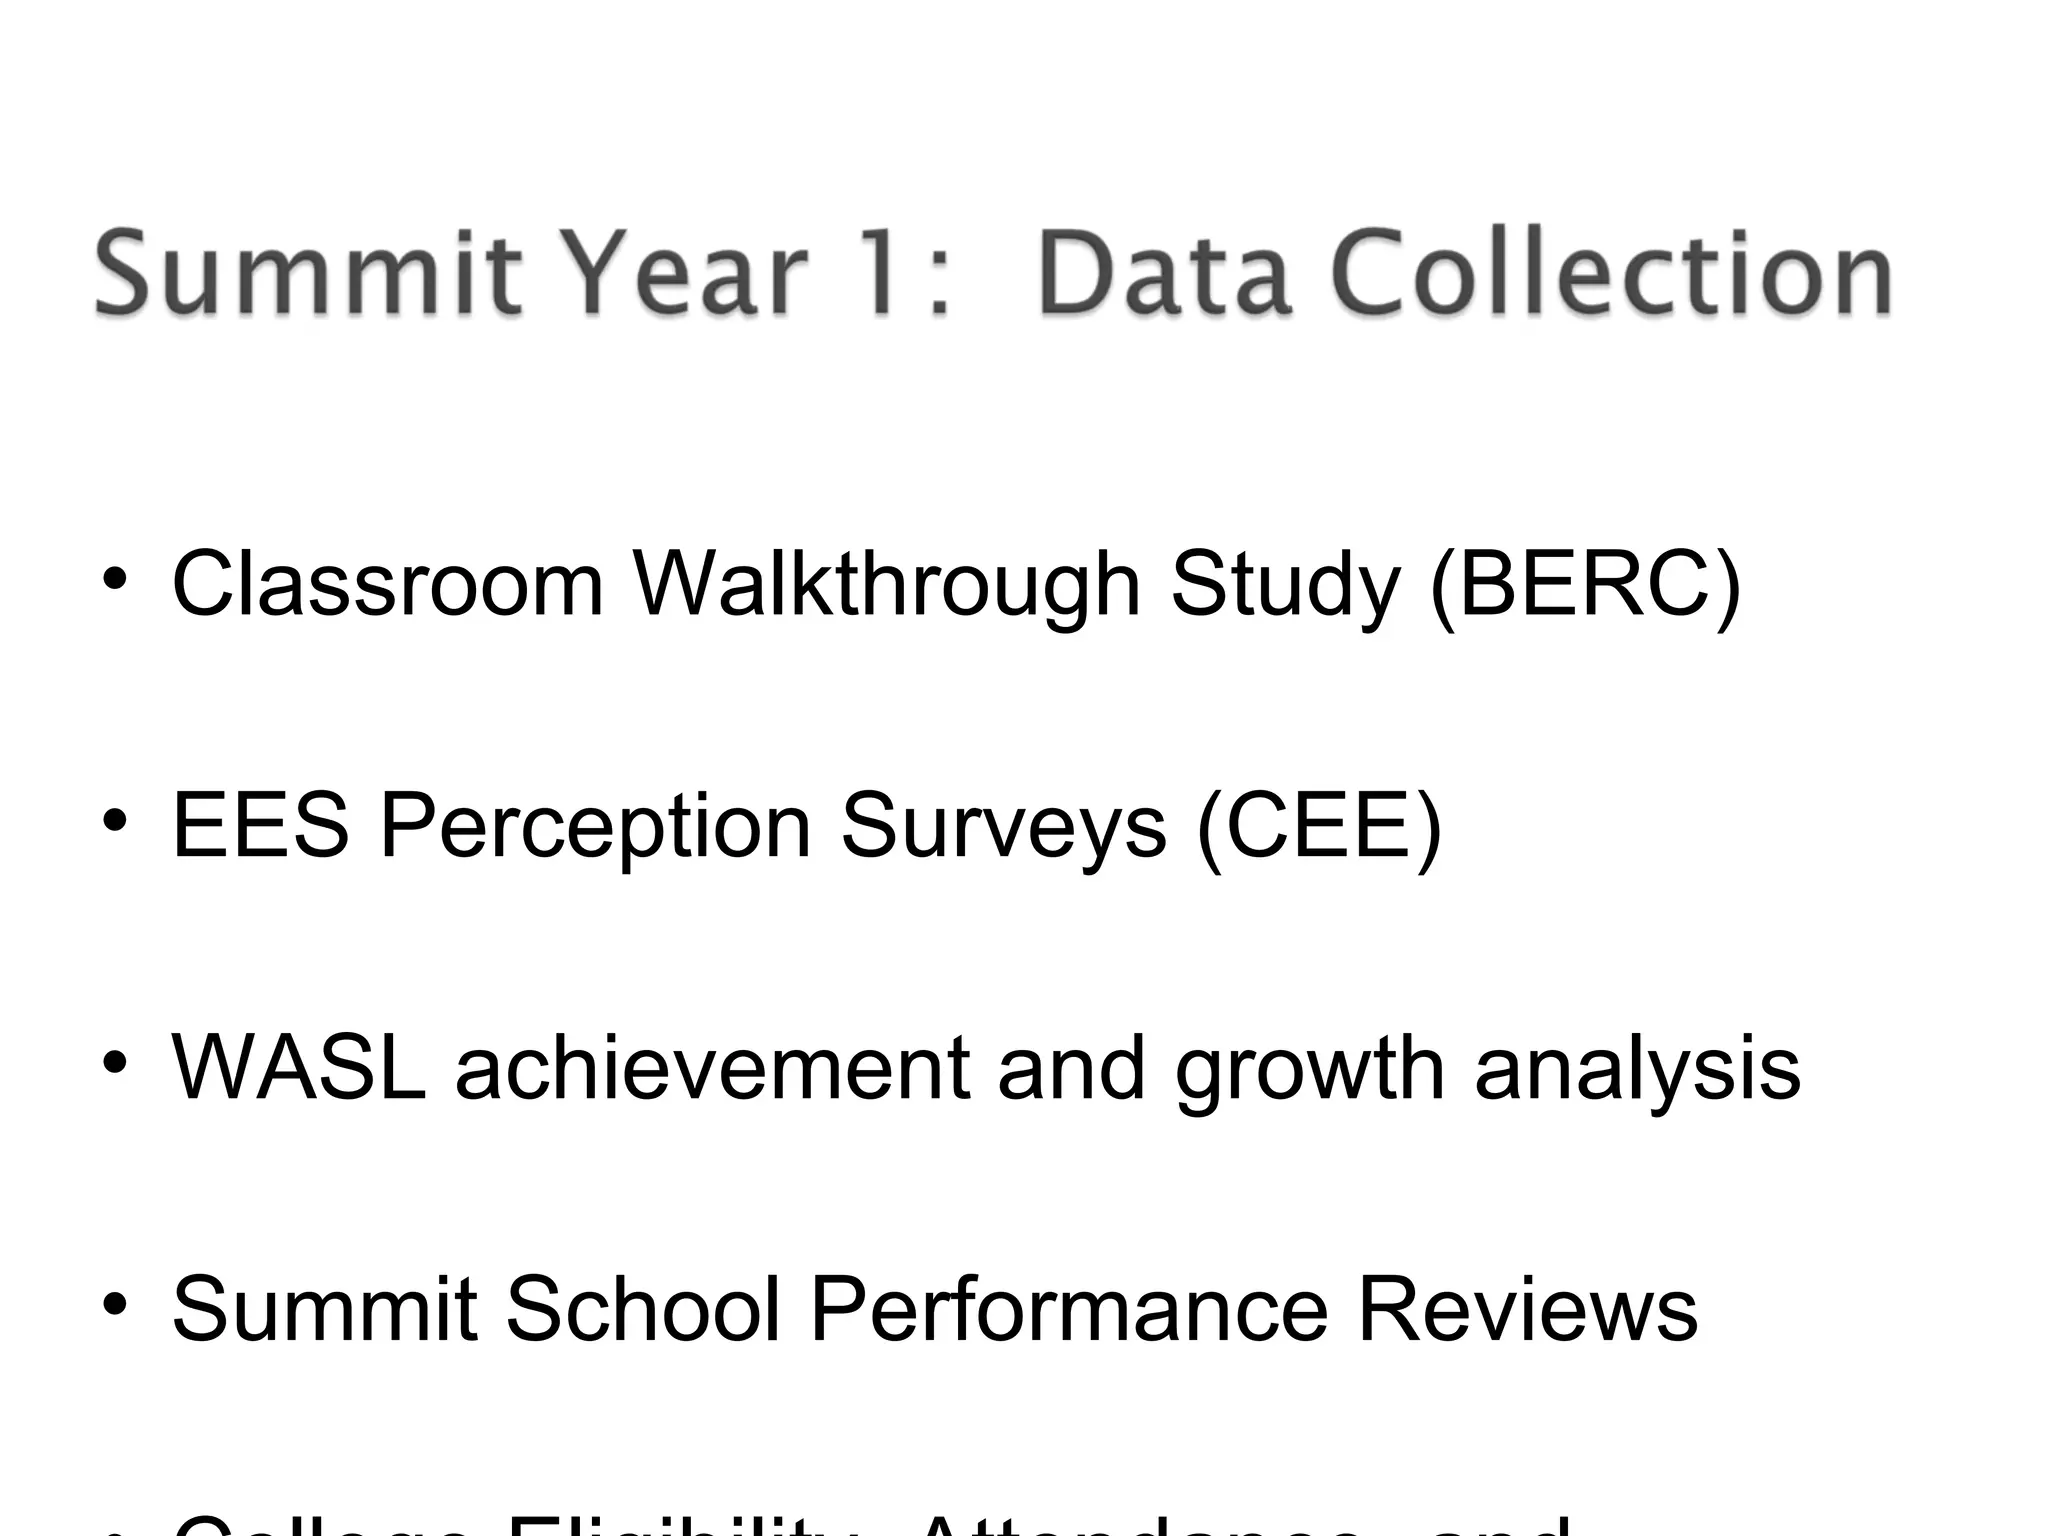
• Classroom WalkthroughStudy (BERC)
• EES Perception Surveys (CEE)
• WASL achievement and growth analysis
• Summit School Performance Reviews
51.
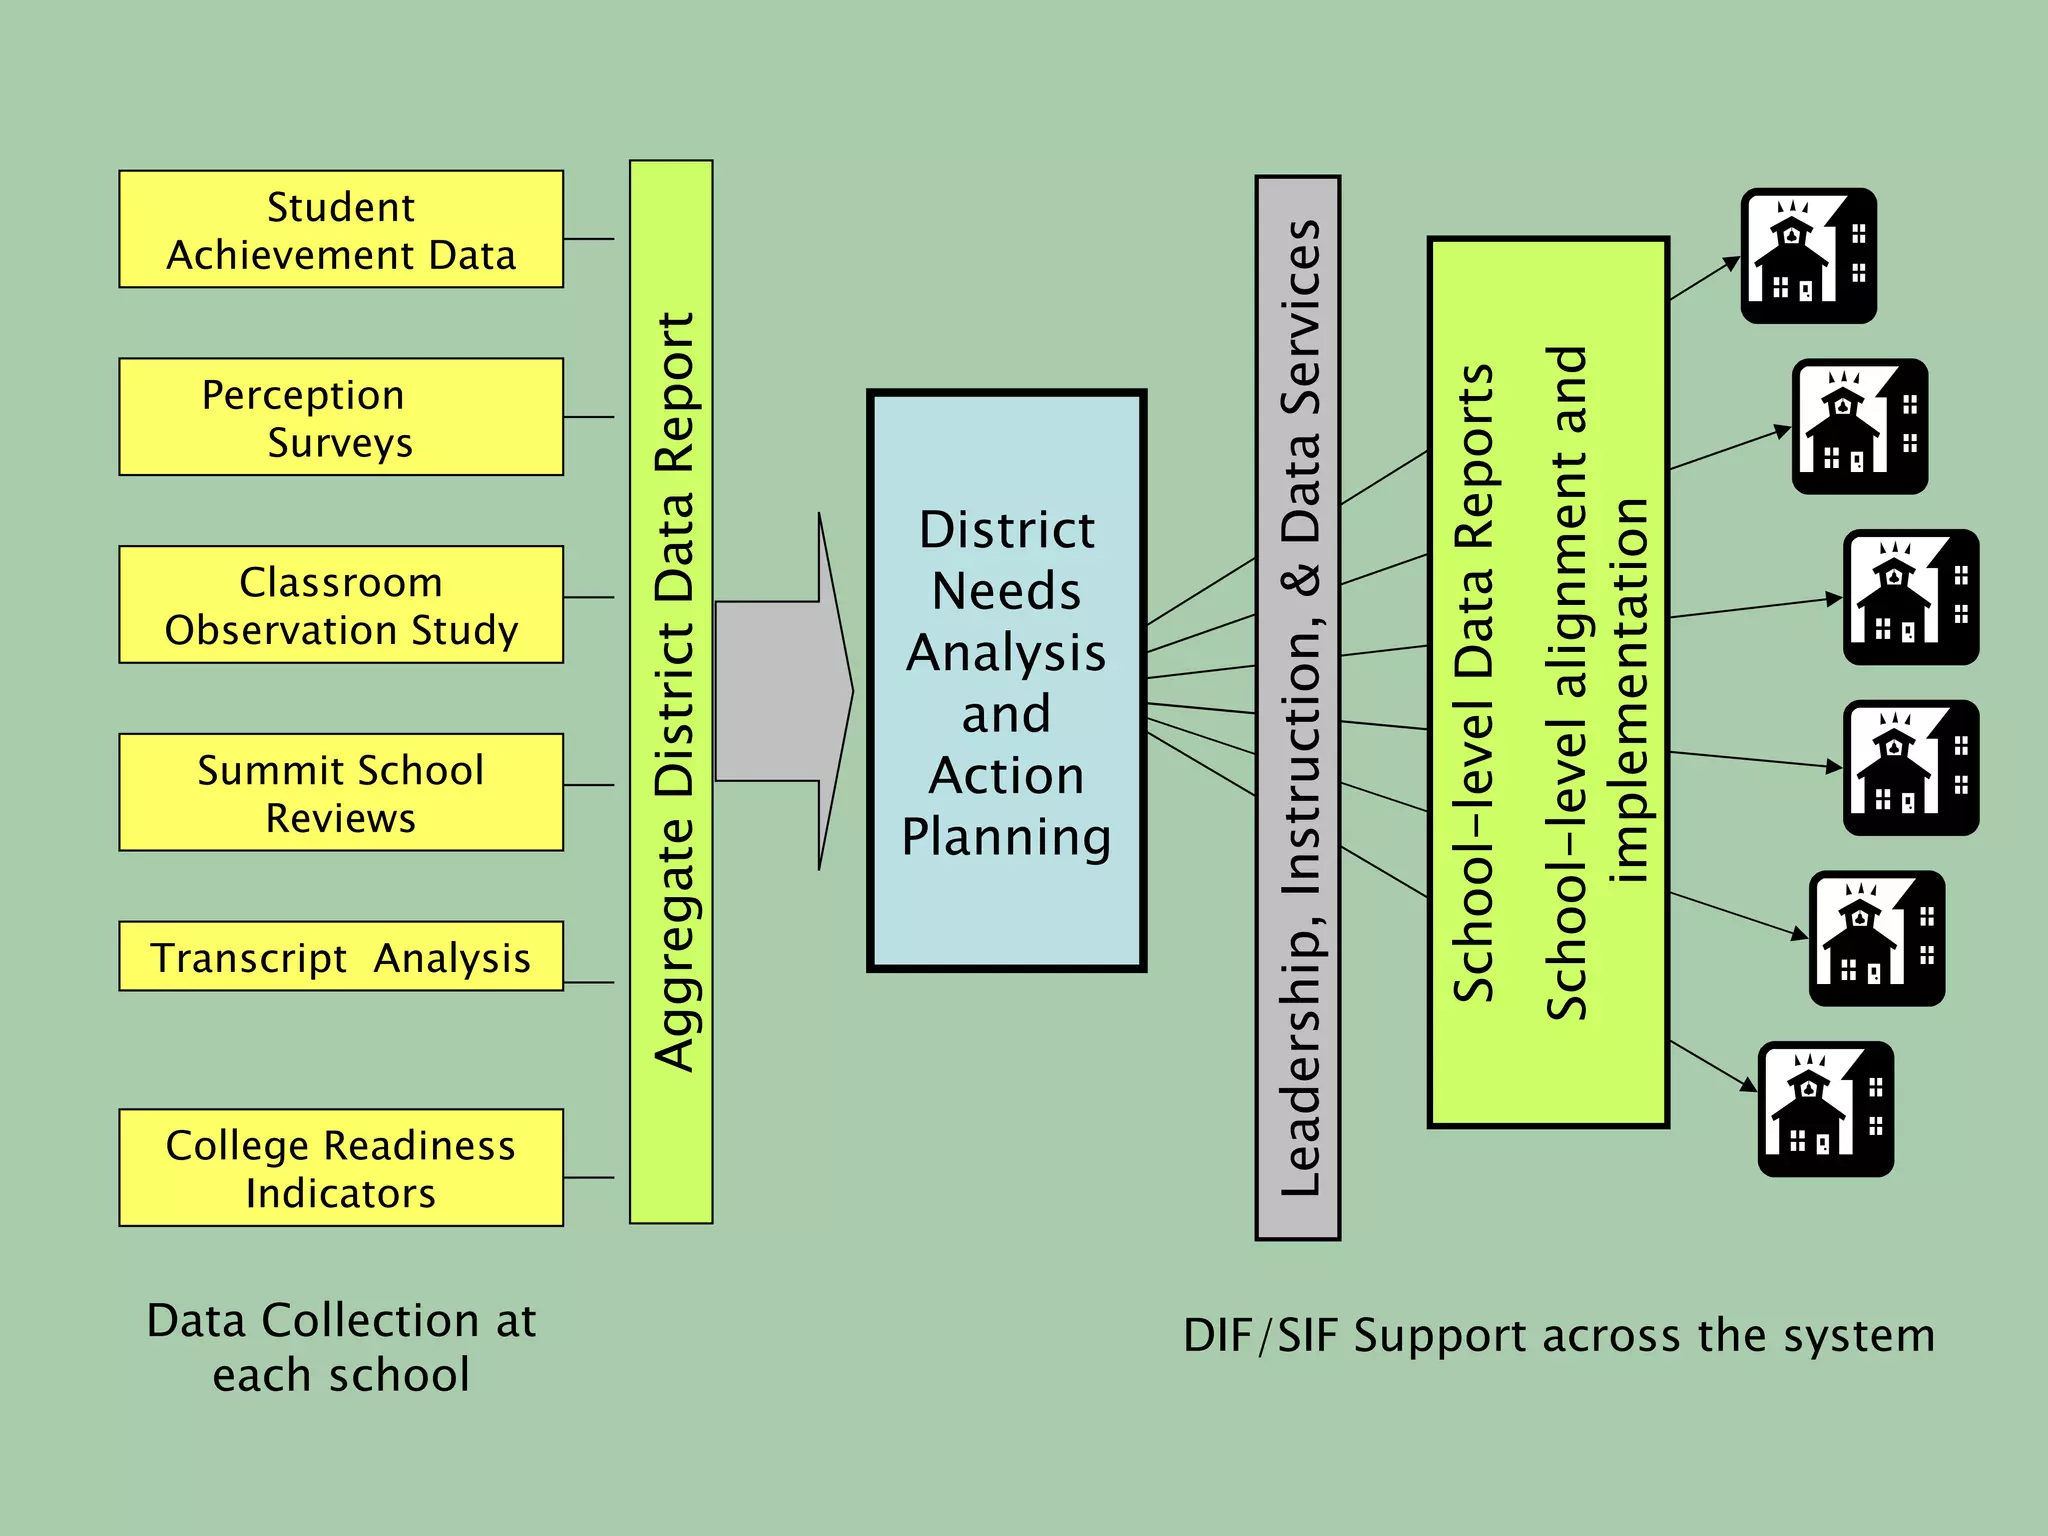
Student
Achievement Data
Perception
Surveys
Classroom
Observation Study
SummitSchool
Reviews
Transcript Analysis
AggregateDistrictDataReport
School-levelDataReports
School-levelalignmentand
implementation
Data Collection at
each school
District
Needs
Analysis
and
Action
Planning
College Readiness
Indicators
Leadership,Instruction,&DataServices
DIF/SIF Support across the system
52.
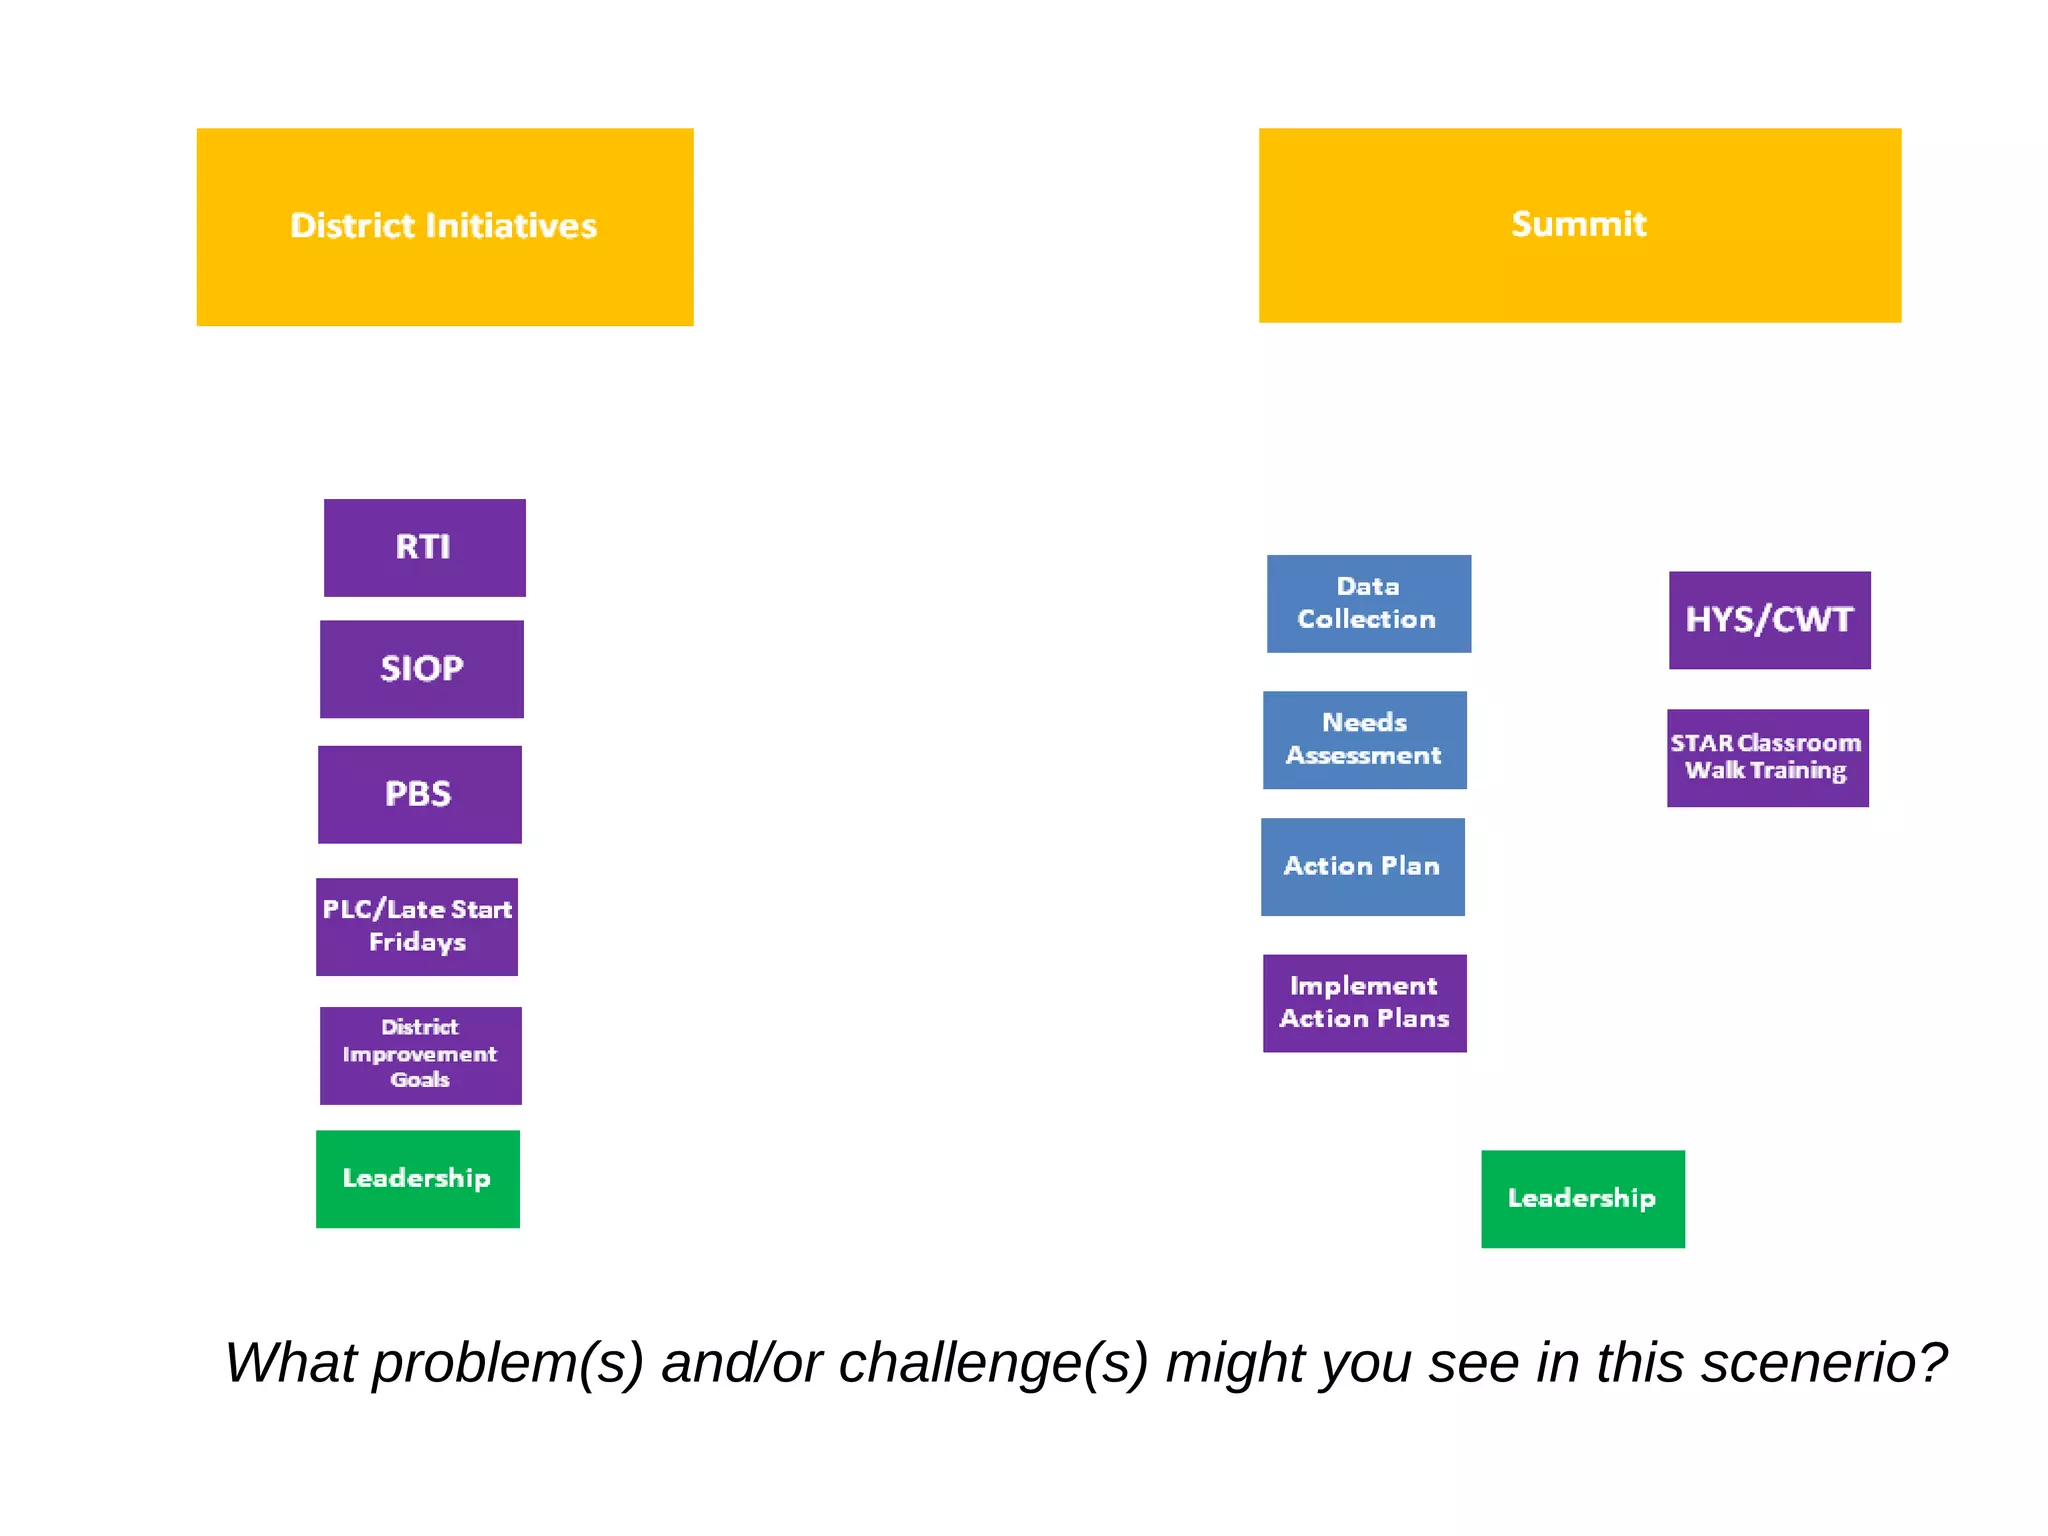
What problems mightyou predict would
come up in the roll out of this initiative in a
district like Renton?
53.
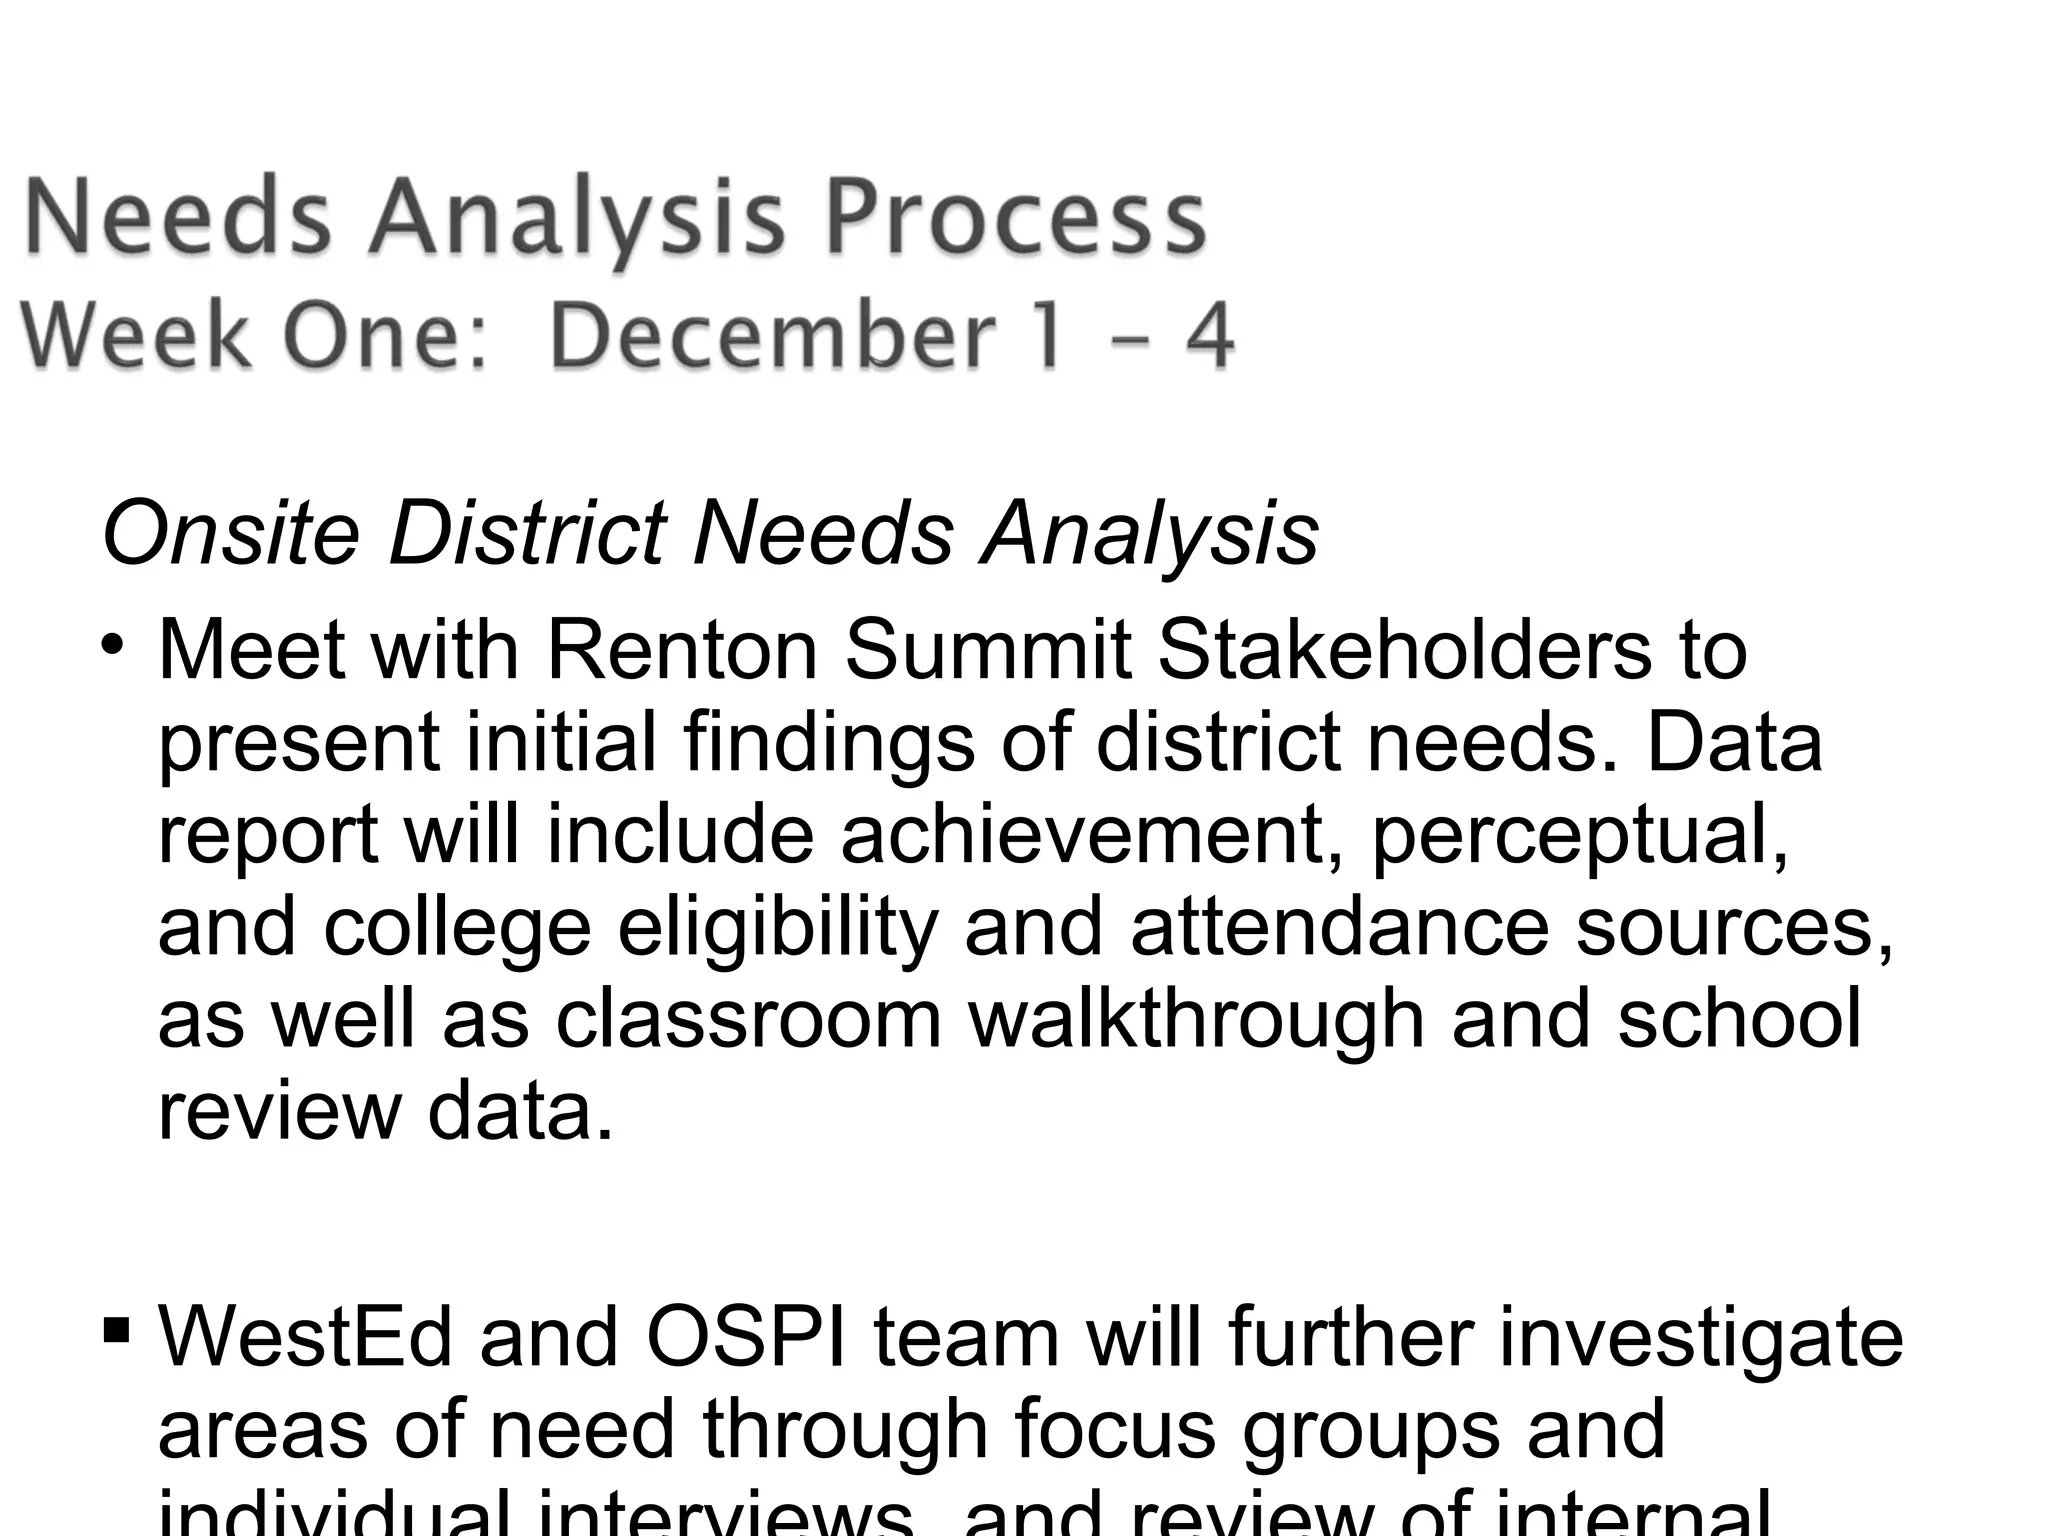
Onsite District NeedsAnalysis
• Meet with Renton Summit Stakeholders to
present initial findings of district needs. Data
report will include achievement, perceptual,
and college eligibility and attendance sources,
as well as classroom walkthrough and school
review data.
WestEd and OSPI team will further investigate
areas of need through focus groups and
54.
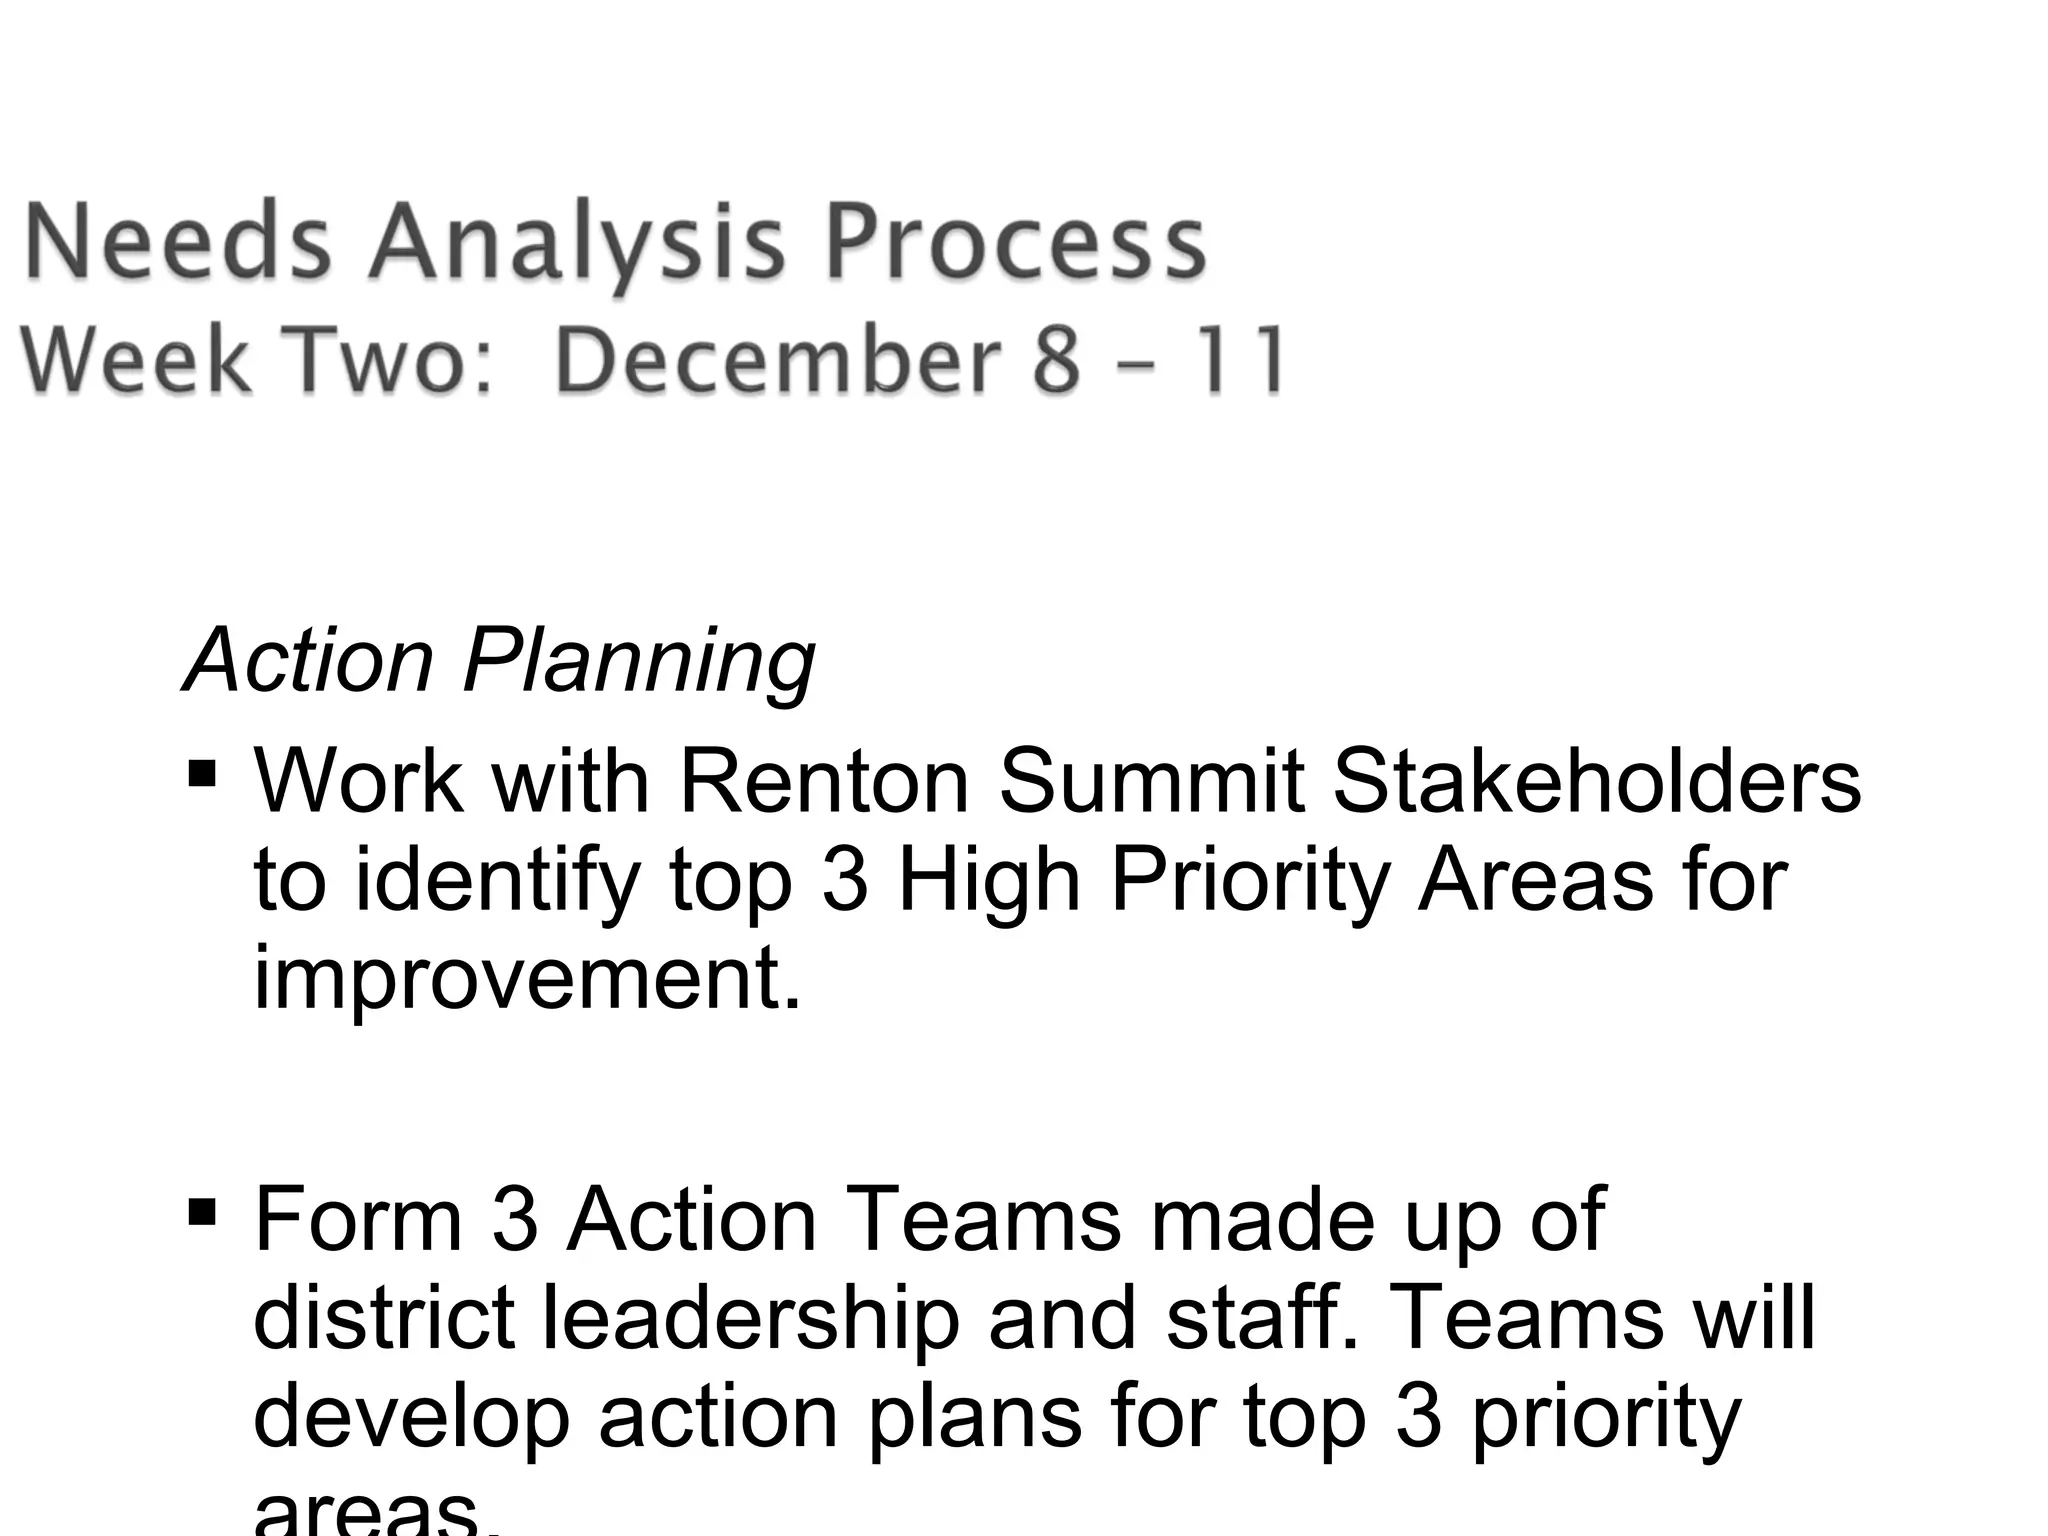
Action Planning
Workwith Renton Summit Stakeholders
to identify top 3 High Priority Areas for
improvement.
Form 3 Action Teams made up of
district leadership and staff. Teams will
develop action plans for top 3 priority
Renton SD FocusAreas Action Questions
•Focus on Student Learning
•Quality Classroom Instruction
•High Expectations and
Accountability for Adults
•Coordinated and Aligned
Curriculum and Assessment
•Effective Use of Data
•Policy and Program Coherence
•How do we build instructional
leadership t support quality
instruction and high levels of
student achievement?
•How do we ensure that all
students engage in effective and
intentional instruction?
•How do we align our policy,
resources, and efforts to support
all students’ rigorous learning
and all students’ readiness for
college and career after
graduation?
57.
1. What didyou learn?
2. What do you wonder about?
3. What suggestions do you have for our
team?
58.
• Lead P.D.
•Schedule regular time to sit with
teachers and just listen
• Adopt one model/theorist and deeply
ground yourself in the model
• Be very smart about what you put into
your mouth
• Make fitness your top priority!
59.
• Implementation Research:A Synthesis of the
Literature, Fixsen, D.L., et al. University of South
Florida, 2005---National Implementation Research
Network
• The Power of Protocols: An educators’ guide t better
practice. McDonald, et al. Teachers College Press
• The Six Secrets of Change: What the best leaders do t
help their organizations survive and thrive. Fullan,
2008
• Classroom Instruction that Works, Marzano, Pickering,
Pollock. ASCD
• Shackleton’s Way: Leadership lessons from the great
Antarctic explorer, Margot Morrel, 2001


![2011 c-oslo [english] - rev 1.1](https://cdn.slidesharecdn.com/ss_thumbnails/2011-c-osloenglish-rev1-1-110330055917-phpapp02-thumbnail.jpg?width=640&height=640&fit=bounds)


![Wsu%20 superintendents%201.6.12[1]](https://cdn.slidesharecdn.com/ss_thumbnails/wsu20superintendents201-6-121-120107230534-phpapp02-thumbnail.jpg?width=640&height=640&fit=bounds)
![Looking back and looking forward[1]](https://cdn.slidesharecdn.com/ss_thumbnails/lookingbackandlookingforward1-120318223505-phpapp02-thumbnail.jpg?width=640&height=640&fit=bounds)


