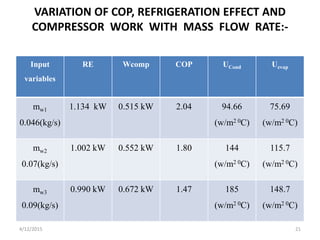
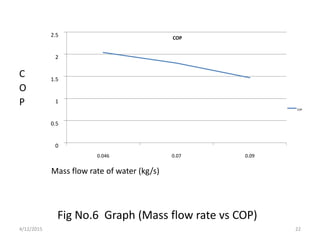
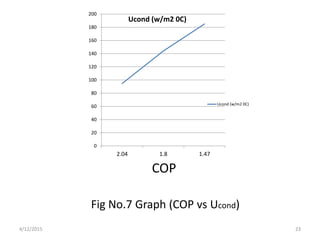
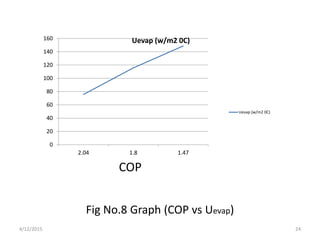
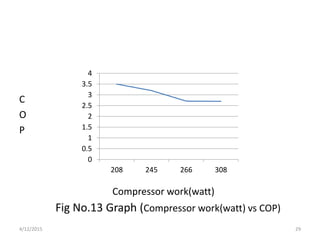
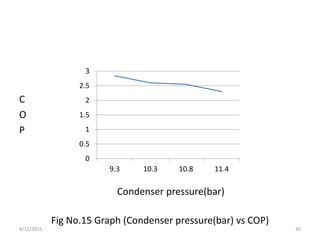
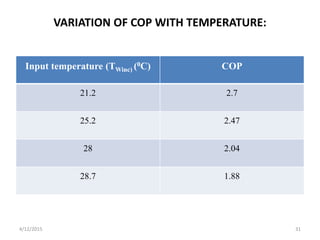
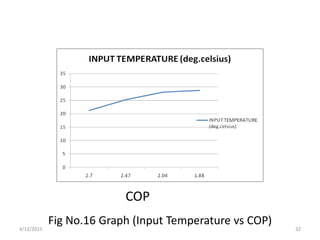
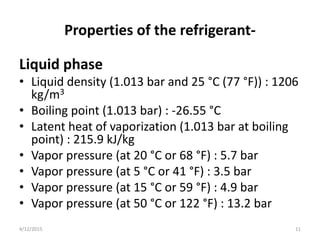
This document summarizes an experimental study on the impact of fouling on vapor compression refrigeration systems (VCRS). It describes the test rig setup, which includes thermocouples, a condenser, evaporator, display devices, stirrers, pressure gauges, expansion valve, compressor, and drier. It then provides properties of the refrigerant used, details the actual refrigeration cycle, and discusses various losses in VCRS. Mathematical calculations are shown for system components like the expansion valve, evaporator, compressor, and condenser. Graphs illustrate how COP, refrigeration effect, and compressor work vary with parameters like mass flow rate and heat exchanger U-values. The results are then compared to experimental data

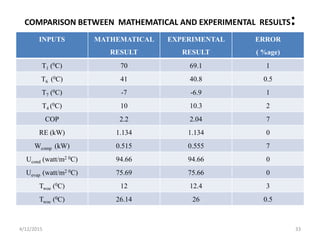
![Fig No. 1 Refrigeration Test Rig [6]
4/12/2015 3](https://image.slidesharecdn.com/2ndprogressreport-150412125753-conversion-gate01/85/Impact-of-Fouling-on-VCR-System-3-320.jpg)
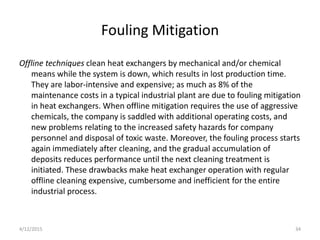
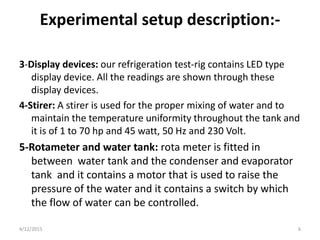
![Experimental setup description[6]
1-Thermocouples: Six thermocouples are used in our test rig.
The readings of the thermocouples are taken by knob by
rotating it .first thermocouple fit at outlet of the condenser.
Second and third thermocouples are fitted in the condenser
tank and evaporator tank respectively. And remaining
thermocouples are fitted in inlet water tank, inlet to
condenser and outlet to evaporator.
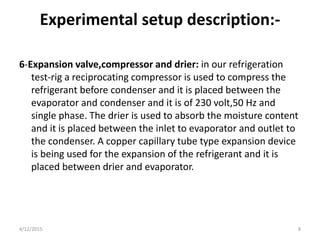
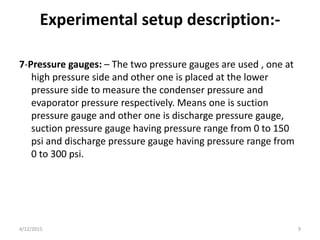
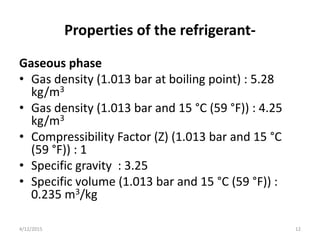
2-Condenser and evaporator: - as shown in the figurethe tub
and tube type condenser and evaporator are used in the kit
and the evaporator having insulator on it. These tanks contain
the two mechanicalagitators as shown in figure, for the
continuous mixture the water,the agitator can be controlled
by switch . These tanks have two valves at the lower side of
tanks for the water outlet. A copper tube is used for the flow
of the refrigerant in spiral form in the tub.
4/12/2015 4](https://image.slidesharecdn.com/2ndprogressreport-150412125753-conversion-gate01/85/Impact-of-Fouling-on-VCR-System-4-320.jpg)
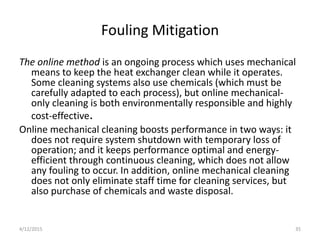
![Fig No.2 Condenser[6]
4/12/2015 5](https://image.slidesharecdn.com/2ndprogressreport-150412125753-conversion-gate01/85/Impact-of-Fouling-on-VCR-System-5-320.jpg)
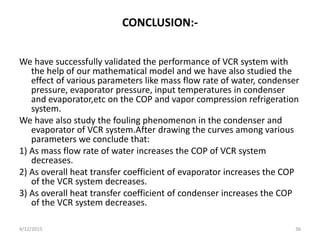
![Fig No.3 Evaporator[6]
4/12/2015 7](https://image.slidesharecdn.com/2ndprogressreport-150412125753-conversion-gate01/85/Impact-of-Fouling-on-VCR-System-7-320.jpg)
![Fig No.4 ACTUAL VAPOR COMPRESSION CYCLE [5]
4/12/2015 13](https://image.slidesharecdn.com/2ndprogressreport-150412125753-conversion-gate01/85/Impact-of-Fouling-on-VCR-System-13-320.jpg)
![Fig No.5 Schematic diagram of a simple refrigeration cycle and various
losses in VCR system. [5]
4/12/2015 14](https://image.slidesharecdn.com/2ndprogressreport-150412125753-conversion-gate01/85/Impact-of-Fouling-on-VCR-System-14-320.jpg)
![MATHEMATICAL CALCULATION [6]
1.Expansion valve:
h6 = h7 , at P1 and T1, h1 = 297.1 kJ/kg from table,
at T6 = 40.8 and P6 = 1040 kPa , h6 = 109.7 kJ/kg from
table,
pressure loss in condenser = P1 – P6
= 1385.4 – 1040
= 345.4 kPa.
Ploss
cond = 25% of Pc
h6 =h7 = 109.7 kj/kg
4/12/2015 15](https://image.slidesharecdn.com/2ndprogressreport-150412125753-conversion-gate01/85/Impact-of-Fouling-on-VCR-System-15-320.jpg)
![MATHEMATICAL CALCULATION[6]
2.Evaporator :-
T7 = -6.90C, h6 =h7 = 109.7 kj/kg, P7 = 225.6 kPa
h7 = hf + x hfg at 225.6 kPa
109.7 = 42.51 + x(246.32 – 42.51)
x = 0.329
T4 = 10.30C, Pe = P4 = 170 kPa , h4 = 262.0 kJ/kg
Pressure loss in evaporator = P7 – P4 =55.6 kPa
Ploss
evap = 25% of Pevap
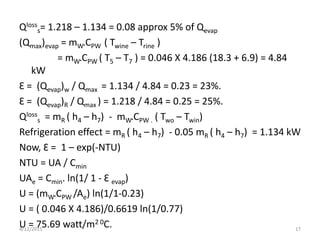
(Qevap) R = mR ( h4 – h7) = 0.008 (262 – 109.7) = 1.218 kW
(Qevap) W = mW.CPW . ( Two – Twin) = mw.Cpw (T5 –T3)
= 0.046 Х 4.186 (18.3 – 12.4) = 1.134 kW
4/12/2015 16](https://image.slidesharecdn.com/2ndprogressreport-150412125753-conversion-gate01/85/Impact-of-Fouling-on-VCR-System-16-320.jpg)