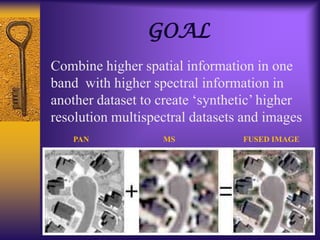
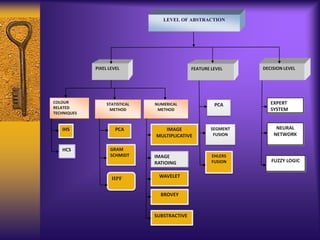
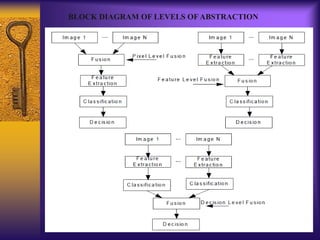
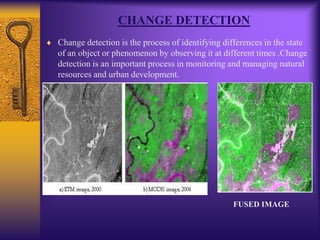
IMAGE
PREPARED BY:
ANSHIKA VERMA (17163)
GARIMA SINGH (17168)
NEHA SINGH(17173)
Under Guidance of:
Mr. Nitin Chauhan
(DoRS)
OUTLINE
•Introduction
•Level of abstractions
 Pixel level
 Feature level
 Decision level
• Image fusion Techniques
•Quality Assessment
•Applications
Fusion: “The union of different
things by, or as if by,
melting……”
Imaging: “Making a
representation or imitation of an
object.
Fusion Imaging
It is defined as “the set of methods,
tools and means of using data from
two or more different images to
improve the quality of information.
GOAL
Combine higher spatial information in one
band with higher spectral information in
another dataset to create „synthetic‟ higher
resolution multispectral datasets and images
PAN MS FUSED IMAGE
Motivation: why fuse ?
Sharper image resolution (display)
Improved classification (and others)
PIXEL LEVEL
LEVEL OF ABSTRACTION
FEATURE LEVEL DECISION LEVEL
COLOUR
RELATED
TECHNIQUES
STATISTICAL
METHOD
NUMERICAL
METHOD
IHS
HCS
PCA
GRAM
SCHMIDT
IMAGE
MULTIPLICATIVE
IMAGE
RATIOING
WAVELET
BROVEY
SUBSTRACTIVE
PCA
SEGMENT
FUSION
EHLERS
FUSION
EXPERT
SYSTEM
NEURAL
NETWORK
FUZZY LOGIC
HPF
BLOCK DIAGRAM OF LEVELS OF ABSTRACTION
MS PAN
Spatial Resolution= 2.44m Spatial Resolution=0.6m
INPUT IMAGES- Quickbird
NUMERICAL METHOD:
1. MULTIPLICATIVE ALGO:
The multiplication model combines two data sets by multiplying each pixel in
each band of the MS data by the corresponding pixel of the pan data
(pohl.C,1997). To compensate for the increased brightness values (BV), the
square root of the mixed data set is taken.
METHODS OF PIXEL LEVEL FUSION
LAYER 1
ADVANTAGES:
• Simple & Straight Forward.
• Fastest.
DISADVANTAGE:
• Alters the spectral information of the
original image.
2.BROVEY ALGO:
Since the original Brovey Transform can only allow three bands to be fused, the
transform has to be modified.
• The Modified Brovey algorithm is a ratio method where the data values of each
band of the MS data set are divided by the sum of the MS data set and then
multiplied by the Pan data set.
LAYER 1
ADVANTAGE:
• Increases the contrast in the low and high
ends of an image histogram.
DISADVANTAGE:
• Three bands at a time should be merged
from multispectral scene.
• It should not be used if preserving the
original scene radiometry is important.
3.SUBSTRACTIVE METHOD:
Subtractive Resolution Merge uses a subtractive algorithm to pan sharpen
multi-spectral (MS) images.
Specifically, it was designed for Quickbird, Ikonos and Formosat images
that have simultaneous acquisition of the pan and MS, with all 4 MS bands
present, and a ratio between the MS and pan image pixels sizes of
approximately 4:1. Other sensors that have similar capabilities should also
work well with this algorithm.
LAYER 1
ADVANTAGE:
• Produces highly preserved spatial and spectral
resolution.
DISADVANTAGE:
• Limited to dual sensor platforms with specific
band ratios between the high-resolution
panchromatic image and the low-resolution
multispectral image .
4. WAVELET METHOD:
The wavelet transform decomposes the signal based on elementary
functions: the wavelets.
By using this, a digital image is decomposed into a set of multi resolution
images with wavelet coefficients. For each level, the coefficients contain
spatial differences between two successive resolution levels.
LAYER 1
ADVANTAGE :
• Minimizing colour distortion.
DISADVANTAGE:
• Poor directional selectivity for diagonal
features, because the wavelet features are
separable and real.
COLOR RELATED TECHNIQUES:
1. IHS METHOD:
The IHS transform separates spatial (intensity) and spectral (hue and
saturation) information from a standard RGB image. The intensity
refers to the total brightness of the image, hue to the dominant or
average wavelength of the light contributing to the colour and
saturation to the purity of colour.
.
LAYER 1
ADVANTAGE:
• preserve more spatial feature and more required
functional information with no color distortion.
DISADVANTAGE:
• only three bands are involved.
STATISTICAL METHODS:
1. PCA:
PC transform is a statistical technique that transforms a multivariate dataset of
correlated variables into a dataset of uncorrelated linear combinations of the
original variables.
For images, it creates an uncorrelated feature space that can be used for further
analysis instead of the original multispectral feature space. The PC is applied to
the multispectral bands. The panchromatic image is histogram matched to the
first PC.
It then replaces the selected component and an inverse PC transform takes the
fused dataset back into the original multi spectral feature space (Chavez et al.
1991).
LAYER 1
ADVANTAGE:
• No. Of bands is not restricted.
DISADVANTAGE:
• Sensitive to the area to be sharpen and
produces fusion result that may vary
depending on the selected image subset.
2. GRAM SCHMIDT:
The GS process transforms a set of vectors into a new set of orthogonal
and linear independent vectors.
By averaging the multispectral bands, the GS fusion simulates a low-
resolution panchromatic band.
As the next step, a GS transform is performed for the simulated
panchromatic band and the multispectral bands with the simulated
panchromatic band applied as the first band.
Then the high spatial resolution panchromatic band replaces the first GS
component.
Finally, an inverse GS transform is applied to create the pan-sharpened
multispectral bands (Laben et al. 2000).
LAYER 1
3. HPF METHOD:
High-pass filter fusion method is a method that make the high frequency
components of high-resolution panchromatic image superimposed on low-
resolution multispectral image, to obtain the enhanced spatial resolution
multispectral image.
LAYER 1
ADVANTAGE:
• preserves a high percentage of the spectral
characteristics, since the spatial information is
associated with the high-frequency information
of the MS, which is from the PAN, and the
spectral information is associated with the low-
frequency information of the MS, which is
from the PAN.
FEATURE LEVEL TECHNIQUES
1.EHLERS METHOD:
It is based on an IHS transform coupled with a Fourier domain filtering.
The principal idea behind a spectral characteristics preserving image
fusion is that the high-resolution image has to sharpen the multispectral
image without adding new grey level information to its spectral
components.
An ideal fusion algorithm would enhance high-frequency changes such
as edges and grey level discontinuities in an image without altering the
multispectral components in homogeneous regions.
To facilitate these demands, two prerequisites have to be addressed.
First, colour and spatial information have to be separated.
Second, the spatial information content has to be manipulated in a way
that allows an adaptive enhancement of the images. This is achieved by
a combination of colour and Fourier transforms.
EHLERS- NORMAL
EHLERS- SPECTRAL
EHLERS- SPATIAL
QUALITY ASSESSMENT
Quality assessment is application dependant so that different applications
may require different aspects of image quality.
Bias of mean
EVALUATION METHODS
QUALITATIVE TEST QUANTITATIVE- STATISTICAL TEST
VISUAL INTERPRETATION SPECTRAL EVALUATION SPATIAL EVALUATION
Correlation
Coefficient
Root Mean Square
Error
HP Correlation
coefficient
Edge detection
Entropy
QUALITATIVE(OR SBJECTIVE) TEST
Qualitative methods involve visual comparison between a
reference image and the fused image
VISUAL INTERPRETATION:
According to prior assessment criteria or individual experiences, personal
judgment or even grades can be given to the quality of an image.
The interpreter analyses the tone, contrast, saturation, sharpness, and
texture of the fused images.
ADVANTAGE:
Easier to interpret.
DISADVANTAGE:
They are subjective and depend heavily on the experience of the
respective interpreter.
Cannot be represented by mathematical models, and their technique is
mainly visual.
QUANTATIVE(OR OBJECTIVE) TEST
Measures spectral and spatial similarity between reference and fused images.
A) Spectral evaluation:
These methods should be objective, reproducible, and of quantitative
nature.
PARAMETERS FOR SPECTRAL EVALUATION :
1. Root mean square error (RMSE) : Proposed by Wald (2002). It is
computed by the difference of the standard deviation and the mean of
the fused and the original image. The best possible value is 0.
2. Correlation coefficient (CC): Measures the correlation b/w original
multispectral bands and the equivalent fused bands. It is the most
frequently used method to evaluate the spectral value preservation.
The values range from -1 to +1. The best correspondence between fused
and original image data shows the highest correlation value and should
be close to 1.
3. Bias of Mean: BM is the difference between the means of the original
MS image and of the fused image (stanislas de bethune,1998).
The value is given relative to the mean value of the original image. The
ideal value is zero.
B) Spatial evaluation:
Parameters:
1. Entropy: Entropy is defined as amount of information contained in an
image. Shannon was the first person to introduce entropy to quantify the
information.
If entropy of fused image is higher than parent image then it indicates
that the fused image contains more information.
2. High-pass correlation (HCC) coefficient: A HP filter is first applied to
the panchromatic image and to each band of the fused image. Then the
correlation coefficients between the HP filtered bands and the HP filtered
panchromatic image are calculated.
3. Edge detection (ED) : An edge detector is applied to the panchromatic
image and each band of the fused multispectral image. The detected
edges are then compared to the panchromatic image edges for each
individual band.
ED correspondence is measured in per cent; 100% means that all the
edges in the panchromatic image are detected in the fused image.
 Standard Deviation: SD is an important index to weight the information
of image, it reflects the deviation degree of values relative to the mean of
the image. The greater SD represents greater amount of variation.
APPLICATIONS
Object identification
Classification
Change Detection
Other fields:
1. Intelligent robots
2. Medical image
3. Manufacturing
4. Military and law enforcement
Object identification
MS PAN
FUSED
IMAGE
Increases the capability for enhancing features.
CLASSIFICATION
LU Classification of MS image LU Classification of fused image
ACCURACY FOR BUILD UP AREAS:
MS=82%
FUSED IMAGE=92%
Increases classification accuracy.
CHANGE DETECTION
Change detection is the process of identifying differences in the state
of an object or phenomenon by observing it at different times .Change
detection is an important process in monitoring and managing natural
resources and urban development.
FUSED IMAGE
REFERENCES:
Manfred Ehlers , Sascha Klonus , Pär Johan Åstrand & Pablo Rosso (2010)
Multisensor image fusion for pansharpening in remote sensing, International
Journal of Image and Data Fusion, 1:1, 25-45,
DOI:10.1080/19479830903561985
Aiazzi, B., L. Alparone, S. Baronti, and A. Garzelli (2002). Context-driven
fusion of high spatial and spectral resolution data based on oversampled
multiresolution analysis. IEEE Trans. Geosci. Remote Sensing 40(10), 2300–
2312.
Ehlers, M., Klonus, S., Åstrand, P.J., 2008. Quality assessment for multi-
sensor multi-date image fusion. The International Archives of the
Photogrammetry, Remote Sensing and Spatial Information Sciences. Vol.
XXXVII. Part B4.
Dr. Nikolaos Mitianoudis, “Image fusion: theory and application,”
http://www.iti.gr/iti/files/document/seminars/iti_mitianoudis_280410.pdf
THANKS

IMAGE FUSION IN IMAGE PROCESSING

  • 1.
    IMAGE PREPARED BY: ANSHIKA VERMA(17163) GARIMA SINGH (17168) NEHA SINGH(17173) Under Guidance of: Mr. Nitin Chauhan (DoRS)
  • 2.
    OUTLINE •Introduction •Level of abstractions Pixel level  Feature level  Decision level • Image fusion Techniques •Quality Assessment •Applications
  • 3.
    Fusion: “The unionof different things by, or as if by, melting……” Imaging: “Making a representation or imitation of an object.
  • 4.
    Fusion Imaging It isdefined as “the set of methods, tools and means of using data from two or more different images to improve the quality of information.
  • 5.
    GOAL Combine higher spatialinformation in one band with higher spectral information in another dataset to create „synthetic‟ higher resolution multispectral datasets and images PAN MS FUSED IMAGE
  • 6.
    Motivation: why fuse? Sharper image resolution (display) Improved classification (and others)
  • 7.
    PIXEL LEVEL LEVEL OFABSTRACTION FEATURE LEVEL DECISION LEVEL COLOUR RELATED TECHNIQUES STATISTICAL METHOD NUMERICAL METHOD IHS HCS PCA GRAM SCHMIDT IMAGE MULTIPLICATIVE IMAGE RATIOING WAVELET BROVEY SUBSTRACTIVE PCA SEGMENT FUSION EHLERS FUSION EXPERT SYSTEM NEURAL NETWORK FUZZY LOGIC HPF
  • 8.
    BLOCK DIAGRAM OFLEVELS OF ABSTRACTION
  • 9.
    MS PAN Spatial Resolution=2.44m Spatial Resolution=0.6m INPUT IMAGES- Quickbird
  • 10.
    NUMERICAL METHOD: 1. MULTIPLICATIVEALGO: The multiplication model combines two data sets by multiplying each pixel in each band of the MS data by the corresponding pixel of the pan data (pohl.C,1997). To compensate for the increased brightness values (BV), the square root of the mixed data set is taken. METHODS OF PIXEL LEVEL FUSION LAYER 1 ADVANTAGES: • Simple & Straight Forward. • Fastest. DISADVANTAGE: • Alters the spectral information of the original image.
  • 11.
    2.BROVEY ALGO: Since theoriginal Brovey Transform can only allow three bands to be fused, the transform has to be modified. • The Modified Brovey algorithm is a ratio method where the data values of each band of the MS data set are divided by the sum of the MS data set and then multiplied by the Pan data set. LAYER 1 ADVANTAGE: • Increases the contrast in the low and high ends of an image histogram. DISADVANTAGE: • Three bands at a time should be merged from multispectral scene. • It should not be used if preserving the original scene radiometry is important.
  • 12.
    3.SUBSTRACTIVE METHOD: Subtractive ResolutionMerge uses a subtractive algorithm to pan sharpen multi-spectral (MS) images. Specifically, it was designed for Quickbird, Ikonos and Formosat images that have simultaneous acquisition of the pan and MS, with all 4 MS bands present, and a ratio between the MS and pan image pixels sizes of approximately 4:1. Other sensors that have similar capabilities should also work well with this algorithm. LAYER 1 ADVANTAGE: • Produces highly preserved spatial and spectral resolution. DISADVANTAGE: • Limited to dual sensor platforms with specific band ratios between the high-resolution panchromatic image and the low-resolution multispectral image .
  • 13.
    4. WAVELET METHOD: Thewavelet transform decomposes the signal based on elementary functions: the wavelets. By using this, a digital image is decomposed into a set of multi resolution images with wavelet coefficients. For each level, the coefficients contain spatial differences between two successive resolution levels. LAYER 1 ADVANTAGE : • Minimizing colour distortion. DISADVANTAGE: • Poor directional selectivity for diagonal features, because the wavelet features are separable and real.
  • 14.
    COLOR RELATED TECHNIQUES: 1.IHS METHOD: The IHS transform separates spatial (intensity) and spectral (hue and saturation) information from a standard RGB image. The intensity refers to the total brightness of the image, hue to the dominant or average wavelength of the light contributing to the colour and saturation to the purity of colour. . LAYER 1 ADVANTAGE: • preserve more spatial feature and more required functional information with no color distortion. DISADVANTAGE: • only three bands are involved.
  • 15.
    STATISTICAL METHODS: 1. PCA: PCtransform is a statistical technique that transforms a multivariate dataset of correlated variables into a dataset of uncorrelated linear combinations of the original variables. For images, it creates an uncorrelated feature space that can be used for further analysis instead of the original multispectral feature space. The PC is applied to the multispectral bands. The panchromatic image is histogram matched to the first PC. It then replaces the selected component and an inverse PC transform takes the fused dataset back into the original multi spectral feature space (Chavez et al. 1991). LAYER 1 ADVANTAGE: • No. Of bands is not restricted. DISADVANTAGE: • Sensitive to the area to be sharpen and produces fusion result that may vary depending on the selected image subset.
  • 16.
    2. GRAM SCHMIDT: TheGS process transforms a set of vectors into a new set of orthogonal and linear independent vectors. By averaging the multispectral bands, the GS fusion simulates a low- resolution panchromatic band. As the next step, a GS transform is performed for the simulated panchromatic band and the multispectral bands with the simulated panchromatic band applied as the first band. Then the high spatial resolution panchromatic band replaces the first GS component. Finally, an inverse GS transform is applied to create the pan-sharpened multispectral bands (Laben et al. 2000). LAYER 1
  • 18.
    3. HPF METHOD: High-passfilter fusion method is a method that make the high frequency components of high-resolution panchromatic image superimposed on low- resolution multispectral image, to obtain the enhanced spatial resolution multispectral image. LAYER 1 ADVANTAGE: • preserves a high percentage of the spectral characteristics, since the spatial information is associated with the high-frequency information of the MS, which is from the PAN, and the spectral information is associated with the low- frequency information of the MS, which is from the PAN.
  • 19.
    FEATURE LEVEL TECHNIQUES 1.EHLERSMETHOD: It is based on an IHS transform coupled with a Fourier domain filtering. The principal idea behind a spectral characteristics preserving image fusion is that the high-resolution image has to sharpen the multispectral image without adding new grey level information to its spectral components. An ideal fusion algorithm would enhance high-frequency changes such as edges and grey level discontinuities in an image without altering the multispectral components in homogeneous regions. To facilitate these demands, two prerequisites have to be addressed. First, colour and spatial information have to be separated. Second, the spatial information content has to be manipulated in a way that allows an adaptive enhancement of the images. This is achieved by a combination of colour and Fourier transforms.
  • 20.
  • 21.
    QUALITY ASSESSMENT Quality assessmentis application dependant so that different applications may require different aspects of image quality. Bias of mean EVALUATION METHODS QUALITATIVE TEST QUANTITATIVE- STATISTICAL TEST VISUAL INTERPRETATION SPECTRAL EVALUATION SPATIAL EVALUATION Correlation Coefficient Root Mean Square Error HP Correlation coefficient Edge detection Entropy
  • 22.
    QUALITATIVE(OR SBJECTIVE) TEST Qualitativemethods involve visual comparison between a reference image and the fused image VISUAL INTERPRETATION: According to prior assessment criteria or individual experiences, personal judgment or even grades can be given to the quality of an image. The interpreter analyses the tone, contrast, saturation, sharpness, and texture of the fused images. ADVANTAGE: Easier to interpret. DISADVANTAGE: They are subjective and depend heavily on the experience of the respective interpreter. Cannot be represented by mathematical models, and their technique is mainly visual.
  • 23.
    QUANTATIVE(OR OBJECTIVE) TEST Measuresspectral and spatial similarity between reference and fused images. A) Spectral evaluation: These methods should be objective, reproducible, and of quantitative nature. PARAMETERS FOR SPECTRAL EVALUATION : 1. Root mean square error (RMSE) : Proposed by Wald (2002). It is computed by the difference of the standard deviation and the mean of the fused and the original image. The best possible value is 0. 2. Correlation coefficient (CC): Measures the correlation b/w original multispectral bands and the equivalent fused bands. It is the most frequently used method to evaluate the spectral value preservation. The values range from -1 to +1. The best correspondence between fused and original image data shows the highest correlation value and should be close to 1. 3. Bias of Mean: BM is the difference between the means of the original MS image and of the fused image (stanislas de bethune,1998). The value is given relative to the mean value of the original image. The ideal value is zero.
  • 24.
    B) Spatial evaluation: Parameters: 1.Entropy: Entropy is defined as amount of information contained in an image. Shannon was the first person to introduce entropy to quantify the information. If entropy of fused image is higher than parent image then it indicates that the fused image contains more information. 2. High-pass correlation (HCC) coefficient: A HP filter is first applied to the panchromatic image and to each band of the fused image. Then the correlation coefficients between the HP filtered bands and the HP filtered panchromatic image are calculated. 3. Edge detection (ED) : An edge detector is applied to the panchromatic image and each band of the fused multispectral image. The detected edges are then compared to the panchromatic image edges for each individual band. ED correspondence is measured in per cent; 100% means that all the edges in the panchromatic image are detected in the fused image.  Standard Deviation: SD is an important index to weight the information of image, it reflects the deviation degree of values relative to the mean of the image. The greater SD represents greater amount of variation.
  • 25.
    APPLICATIONS Object identification Classification Change Detection Otherfields: 1. Intelligent robots 2. Medical image 3. Manufacturing 4. Military and law enforcement
  • 26.
    Object identification MS PAN FUSED IMAGE Increasesthe capability for enhancing features.
  • 27.
    CLASSIFICATION LU Classification ofMS image LU Classification of fused image ACCURACY FOR BUILD UP AREAS: MS=82% FUSED IMAGE=92% Increases classification accuracy.
  • 28.
    CHANGE DETECTION Change detectionis the process of identifying differences in the state of an object or phenomenon by observing it at different times .Change detection is an important process in monitoring and managing natural resources and urban development. FUSED IMAGE
  • 29.
    REFERENCES: Manfred Ehlers ,Sascha Klonus , Pär Johan Åstrand & Pablo Rosso (2010) Multisensor image fusion for pansharpening in remote sensing, International Journal of Image and Data Fusion, 1:1, 25-45, DOI:10.1080/19479830903561985 Aiazzi, B., L. Alparone, S. Baronti, and A. Garzelli (2002). Context-driven fusion of high spatial and spectral resolution data based on oversampled multiresolution analysis. IEEE Trans. Geosci. Remote Sensing 40(10), 2300– 2312. Ehlers, M., Klonus, S., Åstrand, P.J., 2008. Quality assessment for multi- sensor multi-date image fusion. The International Archives of the Photogrammetry, Remote Sensing and Spatial Information Sciences. Vol. XXXVII. Part B4. Dr. Nikolaos Mitianoudis, “Image fusion: theory and application,” http://www.iti.gr/iti/files/document/seminars/iti_mitianoudis_280410.pdf
  • 30.