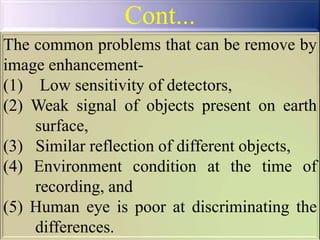
Chapter SIX
Image Enhancement
The aim of digital enhancement is to amplify the slight
differences for better clarity of the image scene. This
means digital enhancement increases the separability
(contrast) between the interested classes or features.
The digital image enhancement may be defined as
some mathematical operation that are to be applied to
digital remote sensing input data to improve the visual
appearance of an image for better interpretability or
subsequent digital analysis.
• .
Cont...
• To improve the visual interpretability of an image by increasing
the apparent/noticeable distinction between the features of the
scene.
• This objective is to create new image from the original image in
order to increase the amount of information that can be visually
interpreted from the data.
• Enhancement operations are normally applied to image data after
the appropriate restoration procedures have been performed.
The common problems that can be remove by
image enhancement-
(1) Low sensitivity of detectors,
(2) Weak signal of objects present on earth
surface,
(3) Similar reflection of different objects,
(4) Environment condition at the time of
recording, and
(5) Human eye is poor at discriminating the
differences.
Cont...
1. Linear contrast stretch It is simplest type of enhancement
which involves identifying lower and upper bounds from
the histogram (usually the minimum and maximum DN in
the image) and applying a transformation to stretch this
range to fill the full range. A DN in the low range of the
original histogram is assigned to extreme black, and a value
at the high end is assigned to extreme white.
 The remaining pixel values are distributed linearly between
these two extremes
Methods of Contrast Enhancement
.The full dynamic range of sensor will be used and the
corresponding image is dull and lacking in contrast or
over bright.
.The result is an image lacking in contrast - but by
remapping the DN distribution to the full display
capabilities of an image processing system, we can
recover a beautiful image.
Contrast Stretching can be displayed in two categories:
1 Linear Contrast Stretching
2 Histogram Equalization
Contrast Stretching
Contrast Tools
• Histogram Equalization
• Linear Stretch
Tries to put equal
numbers of pixels in a
set of bins.
Linear stretch between a
lower and a upper value
0 255
Frequency
10 Bins
255 Bins
2 SD
Image Contrast
0 255
Frequency
0 255
Frequency
• Dark
• Little CONTRAST
between features
• Brighter
• More CONTRAST between
features
Image Contrast
0 255
Frequency
Pixel Values of raw
image
Values as they could
appear in display
Dark Bright
Stretching Image Histograms
0 255
Frequency
• Fits the narrow range of
raw data into the larger
range of the display device
0 255
Frequency
IMAGE
Converts the continuous gray tone of an image
into a series of density intervals, or slices, each
corresponding to a specified range of DNs.
Each digital slice is displayed as a separate
color or outlined by contour lines.
It emphasizes subtle gray-scale differences that
may be imperceptible to the viewer
2.Density Slicing
Histogram Equalization(or nonlinear
stretch): Input pixels are redistributed to
produce a uniform population density of pixels
along the output axis, which results in the
output histogram having a wide spacing of bins
(all pixels having the same DN) in the center of
the distribution curve and a close spacing of
the less-populated bins at the head and tail of
the histogram.
3.Histogram
Equalization
Original Image with no contrast
enhancement
Cont...
Linear contrast Stretch
 To expand the narrow range of brightness values of an input
image over a wider range of gray values
 Certain features may reflect more energy than others. This
results in good contrast within the image and features that
are easy to distinguish
 The contrast level between the features in an image is low
when features reflect nearly the same level of energy
 When image data are acquired, the detected energy does not
necessarily fill the entire grey level range that the sensor is
capable of. This can result in a large concentration of values
in a small region of grey levels producing an image with
very little contrast among the features.
Cont...
Cont...
• Linear stretch:
DN' ( DNMIN
MAXMIN
)255
Where
DN’= Digital no. assigned to pixel in output
image
DN= Original DN of pixel in input image
MIN= Minimum value of input image (0)
MAX=Maximum value of input image (255)
Cont...
Linear stretch
Example of linear
stretching
Cont...
Non-linear
4.Gaussian Contrast Stretch
 Stretching based on histogram of pixel values
 Involves fitting of observed histogram to a normal or Gaussian histogram.
Highlight the tail parts of the histogram
 Variations in nature are commonly distributed in normal(gaussian)pattern,
which is the familiar bell-shaped curve.
 The original pixels are reassigned to fit a gaussian distribution curve.
Spatial filtering
Encompasses another set of digital processing
functions which are used to enhance the
appearance of an image. Spatial filters are
designed to highlight or suppress specific
features in an image based on their spatial
frequency.
Spatial Feature Manipulation
• Spatial filters pass (emphasize) or suppress (de-emphasize) image data of various spatial
frequencies
• Spatial frequency refers to the number of changes in brightness value for any area within a
scene
• High spatial frequency  rough areas
– High frequency corresponds to image elements of smallest size
– An area with high spatial frequency will have rapid change in digital values with distance
(i.e. dense urban areas and street networks)
• Low spatial frequency  smooth areas
– Low frequency corresponds to image elements of (relatively) large size.
– An object with a low spatial frequency only changes slightly over many pixels and will
have gradual transitions in digital values (i.e. a lake or a smooth water surface).
Numerical Filters-Low Pass Filters
• A low-pass filter is designed to emphasize larger,
homogeneous areas of similar tone and reduce the
smaller detail in an image.
• Thus, low-pass filters generally serve to smooth the
appearance of an image. Average and median of
3x3 pixels.
Low-pass Filters
Low-pass Filters
Details are “smoothed”
and DNs are averaged
after a low pass filter
is applied to an image.
High-pass Filter
Streets and highways, and some
streams and ridges, are greatly
emphasized. The trademark of a
high pass filter image is that linear
features commonly are defined as
bright lines with a dark border.
High-pass filters do the opposite and serve to
sharpen the appearance of fine detail in an
image.
One implementation of a high-pass filter first
applies a low-pass filter to an image and then
subtracts the result from the
original, leaving behind only
the high spatial frequency information.
High-pass Filter
THE END OF TODAY’S LECTURE…
image_enhancement-NDVI-5.pptx

image_enhancement-NDVI-5.pptx

  • 1.
    Chapter SIX Image Enhancement Theaim of digital enhancement is to amplify the slight differences for better clarity of the image scene. This means digital enhancement increases the separability (contrast) between the interested classes or features. The digital image enhancement may be defined as some mathematical operation that are to be applied to digital remote sensing input data to improve the visual appearance of an image for better interpretability or subsequent digital analysis. • .
  • 2.
    Cont... • To improvethe visual interpretability of an image by increasing the apparent/noticeable distinction between the features of the scene. • This objective is to create new image from the original image in order to increase the amount of information that can be visually interpreted from the data. • Enhancement operations are normally applied to image data after the appropriate restoration procedures have been performed.
  • 3.
    The common problemsthat can be remove by image enhancement- (1) Low sensitivity of detectors, (2) Weak signal of objects present on earth surface, (3) Similar reflection of different objects, (4) Environment condition at the time of recording, and (5) Human eye is poor at discriminating the differences. Cont...
  • 4.
    1. Linear contraststretch It is simplest type of enhancement which involves identifying lower and upper bounds from the histogram (usually the minimum and maximum DN in the image) and applying a transformation to stretch this range to fill the full range. A DN in the low range of the original histogram is assigned to extreme black, and a value at the high end is assigned to extreme white.  The remaining pixel values are distributed linearly between these two extremes Methods of Contrast Enhancement
  • 5.
    .The full dynamicrange of sensor will be used and the corresponding image is dull and lacking in contrast or over bright. .The result is an image lacking in contrast - but by remapping the DN distribution to the full display capabilities of an image processing system, we can recover a beautiful image. Contrast Stretching can be displayed in two categories: 1 Linear Contrast Stretching 2 Histogram Equalization Contrast Stretching
  • 6.
    Contrast Tools • HistogramEqualization • Linear Stretch Tries to put equal numbers of pixels in a set of bins. Linear stretch between a lower and a upper value 0 255 Frequency 10 Bins 255 Bins 2 SD
  • 7.
    Image Contrast 0 255 Frequency 0255 Frequency • Dark • Little CONTRAST between features • Brighter • More CONTRAST between features
  • 8.
    Image Contrast 0 255 Frequency PixelValues of raw image Values as they could appear in display Dark Bright
  • 9.
    Stretching Image Histograms 0255 Frequency • Fits the narrow range of raw data into the larger range of the display device 0 255 Frequency IMAGE
  • 10.
    Converts the continuousgray tone of an image into a series of density intervals, or slices, each corresponding to a specified range of DNs. Each digital slice is displayed as a separate color or outlined by contour lines. It emphasizes subtle gray-scale differences that may be imperceptible to the viewer 2.Density Slicing
  • 11.
    Histogram Equalization(or nonlinear stretch):Input pixels are redistributed to produce a uniform population density of pixels along the output axis, which results in the output histogram having a wide spacing of bins (all pixels having the same DN) in the center of the distribution curve and a close spacing of the less-populated bins at the head and tail of the histogram. 3.Histogram Equalization
  • 12.
    Original Image withno contrast enhancement Cont... Linear contrast Stretch
  • 13.
     To expandthe narrow range of brightness values of an input image over a wider range of gray values  Certain features may reflect more energy than others. This results in good contrast within the image and features that are easy to distinguish  The contrast level between the features in an image is low when features reflect nearly the same level of energy  When image data are acquired, the detected energy does not necessarily fill the entire grey level range that the sensor is capable of. This can result in a large concentration of values in a small region of grey levels producing an image with very little contrast among the features. Cont...
  • 14.
    Cont... • Linear stretch: DN'( DNMIN MAXMIN )255 Where DN’= Digital no. assigned to pixel in output image DN= Original DN of pixel in input image MIN= Minimum value of input image (0) MAX=Maximum value of input image (255)
  • 15.
  • 16.
  • 17.
  • 18.
  • 19.
    4.Gaussian Contrast Stretch Stretching based on histogram of pixel values  Involves fitting of observed histogram to a normal or Gaussian histogram. Highlight the tail parts of the histogram  Variations in nature are commonly distributed in normal(gaussian)pattern, which is the familiar bell-shaped curve.  The original pixels are reassigned to fit a gaussian distribution curve.
  • 20.
    Spatial filtering Encompasses anotherset of digital processing functions which are used to enhance the appearance of an image. Spatial filters are designed to highlight or suppress specific features in an image based on their spatial frequency.
  • 21.
    Spatial Feature Manipulation •Spatial filters pass (emphasize) or suppress (de-emphasize) image data of various spatial frequencies • Spatial frequency refers to the number of changes in brightness value for any area within a scene • High spatial frequency  rough areas – High frequency corresponds to image elements of smallest size – An area with high spatial frequency will have rapid change in digital values with distance (i.e. dense urban areas and street networks) • Low spatial frequency  smooth areas – Low frequency corresponds to image elements of (relatively) large size. – An object with a low spatial frequency only changes slightly over many pixels and will have gradual transitions in digital values (i.e. a lake or a smooth water surface).
  • 22.
    Numerical Filters-Low PassFilters • A low-pass filter is designed to emphasize larger, homogeneous areas of similar tone and reduce the smaller detail in an image. • Thus, low-pass filters generally serve to smooth the appearance of an image. Average and median of 3x3 pixels.
  • 23.
  • 24.
    Low-pass Filters Details are“smoothed” and DNs are averaged after a low pass filter is applied to an image.
  • 25.
    High-pass Filter Streets andhighways, and some streams and ridges, are greatly emphasized. The trademark of a high pass filter image is that linear features commonly are defined as bright lines with a dark border. High-pass filters do the opposite and serve to sharpen the appearance of fine detail in an image. One implementation of a high-pass filter first applies a low-pass filter to an image and then subtracts the result from the original, leaving behind only the high spatial frequency information.
  • 26.
    High-pass Filter THE ENDOF TODAY’S LECTURE…