Download to read offline
![A Case Study of Implementing Last planner System in Tiruchirappalli District of Tamil
Nadu - India
http://www.iaeme.com/IJCIET/index.asp 1919 editor@iaeme.com
a construction business, such as lack of initiative in implementing new techniques, inadequate
details and documents of preceding data concern risks and lack of adopting modern
techniques for minimizing the effect of risk factors on projects objectives. The objective of
Lean construction(LC) is to utilize the value-adding resources as labour and material better to
get less waste, fewer delays and lower costs or, in other words, to minimize the Non-Value
adding Activity [1]. One way of contributing to improve performance and increase
productivity is to implement lean construction tool, Last Planner System. The four principles
of lean construction are all incorporated in LPS and is, therefore, LPS is a crucial concept for
the implementations of LC. Hence, Planning and control in LC can be achieved through the
implementation of the LPS. It was identified that there was a huge potential of solving the
problems associated with the Indian construction sector if the Lean construction tools were
practically implemented in Indian construction projects. Hence, in carrying out this research,
LPS which is an existing solution is being utilized in a new domain (i.e. the Indian
construction sector; which is fragmented in nature and characterized by poor project
definitions, inadequate project designs, uncompleted projects and poorly completed ones) had
a positive impact on improving the productivity and performance.
2. LAST PLANNER SYSTEM
The LPS is a crucial method of lean project management, which is inspired by the lean
production philosophy. The elaboration of this system shows the adaptation of lean principles
and methods to the project area [2]. It consists of workflow control and production unit
control. Workflow control is accomplished primarily through the look-ahead process, while
production unit control is accomplished primarily through weekly work planning [3]. LPS is
based on a traditional planning system, the condition of SHOULD-CAN-WILL-DID is
implemented. Fig. 1 represented the diagram of the Last Planner System. A reliable
assignment, one that gets done at the required time, determines what WILL be done, after
considering both what SHOULD from higher-level schedules and what CAN be done based
on the situation at hand. Assignments are likely to get done when they are well defined,
resource sound, in the right sequence, and within the capacity of the crew. The team (last
planner’s) job is to make the certain task in the assignment that meets these criteria and to
reject assignments that do not. Last planners can reasonably commit to completing the tasks
on weekly work plans that meet these criteria [1]. To be effective, production management
systems must tell what should be done, what can be done, and what will be done; then, they
compare what was done to improve planning [3]. Fig. 1 illustrates the possible relationships
among SHOULD, CAN, and WILL. Referring to Fig. 2a, a reliable assignment determines
what WILL be done, after considering what SHOULD and CAN get done based on the
situation at hand [3].
Figure 1 Last Planner System. [3]](https://image.slidesharecdn.com/ijciet0804218-170519053742/85/Ijciet-08-04_218-2-320.jpg)
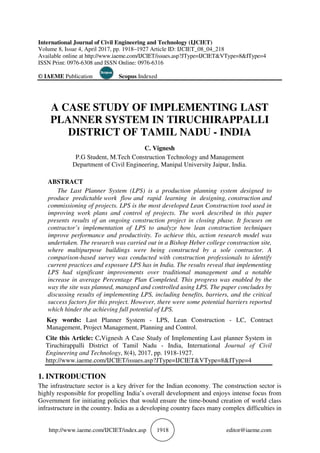
![C. Vignesh
http://www.iaeme.com/IJCIET/index.asp 1920 editor@iaeme.com
Figure 2A Philosophy of lean planning B. Philosophy of traditional planning
In general Construction projects require planning by different people, in different positions,
possibly at a different organization and during different moments of the life cycle of the
work. The LPS defines definite standards of obligation that require advanced commitments of
production in order to protect the productive units from uncertainty and variability. One of
the founders of lean construction UK, Mossman [4], explains about five key conversations of
the LPS. When all are working together they reinforce each other and the overall benefits are
greater. The conversations are:
1. Collaborative Programming - Creating and agreeing with the production sequence. This
helps the project team get to know each other, identify issues with the project and agree how
to resolve them and design and plan handovers [3-4].
2. Make Ready - Making tasks in the Look Ahead period ready (i.e. constraint-free). This
ensures that the work can be done when they want to do it [3-4].
3. Production Planning - Collaboratively agreeing to the production tasks for the next day or
week. First Run Studies are an opportunity to rehearse critical handovers and understand
where failures might occur so that they can be planned to counteract [3-4].
4. Production Management - Collaboratively monitoring production to keep activities on track.
Weekly or daily production planning meetings lets team check for interdependencies before
they promise [3-4].
5. Measurement, learning and continual improvement - Learning together about and
improving project, planning and production processes. It helps them adjust plans in the light
of new information, & the learning element encourages learning from success & reduces
repeated failures [3-4].
The planning reliability is directly related to productivity [2]. The reliability of the last
planner system is measured in terms of the Percentage of Plan Completed (PPC) as planned at
the end of each week. The causes of failures of assignments fulfillment are identified and also
investigated each week in order to avoid them in the future.
2. METHODOLOGY
This case study reports the implementation process of the LPS as a possible reference for
continuous improvement in Indian construction management practices. In order to study the
impact of LPS, an action research model was conducted. Action research involves actively
participating in a change situation, often via an existing organization, whilst simultaneously
conducting research. As designers and stakeholders, researchers work with others to propose
a new course of action to help their community improve its work practices, assisted or guided](https://image.slidesharecdn.com/ijciet0804218-170519053742/85/Ijciet-08-04_218-3-320.jpg)
![A Case Study of Implementing Last planner System in Tiruchirappalli District of Tamil
Nadu - India
http://www.iaeme.com/IJCIET/index.asp 1921 editor@iaeme.com
by professional, with the aim of improving their strategies, practices and knowledge of the
environments within which they practice [5]. The study was performed in an “action
research” environment where author has actually joined in the project as a team coordinator
to collect data, analyze and evaluate the data with the team and examined for beneficial
patterns in order to establish several improvement alternatives, and tested these improvements
dynamically. The implementation process adopted in this study are based on following seven
vital steps[6-7].
1. The last planner participants review the contract and designs, in order to fully understand the
client needs, and consequently develops a schedule. This schedule is going to be used by the
construction manager only as a reference for the second step and it does not have to be
distributed to the other stakeholders.
2. The site manager summons the last planner for a pull session meeting where the construction
schedule is discussed among the subcontractor and other participants. As an output of the pull
session, a master plan is approved with the commitment of all parties, and distributed to the
stakeholders if necessary.
3. Within the master plan, the look-ahead plan is produced by the last planner. The look-ahead
plan identifies the constraints and it proposes a path to avoid or delete bottlenecks. This plan
forecasts six weeks in advance approximately, and identifies the work that has to be cleared of
any constraints. It looks forward to increase the construction flow.
4. The weekly plan is produced every seven days with the involvement of the last planners. The
weekly plan established the detailed work that will be done during the following week as
assignments through promises for PPC.
5. During the weekly meeting, the last planners check the compliancy of the weekly plan
through value stream mapping and identify the reasons of non-compliancy.
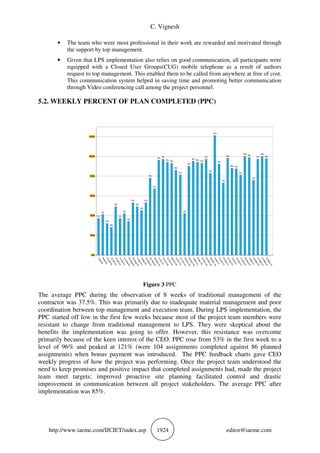
6. Percentage of Plan Complete (PPC) is a measure of workflow reliability [2] and is calculated
weekly by dividing the number of tasks completed by the total number of tasks(assignments)
made for the plan period [2]. The causes of non-compliancy are investigated weekly in order
to avoid them in the future. The reliability of the plan is directly related to the productivity
[8]. The equation for PPC is as follows:
PCC (%)= [No. of Task Completed / No. of Task Assigned] x 100
Results are made publicly visibility in the construction site, indicating the performance of
every party for each task implicated. This publicity of results either good or bad is a key
factor to reinforce the commitment.
There is feedback in every step of the process to update the master plan and to get lessons
learned.
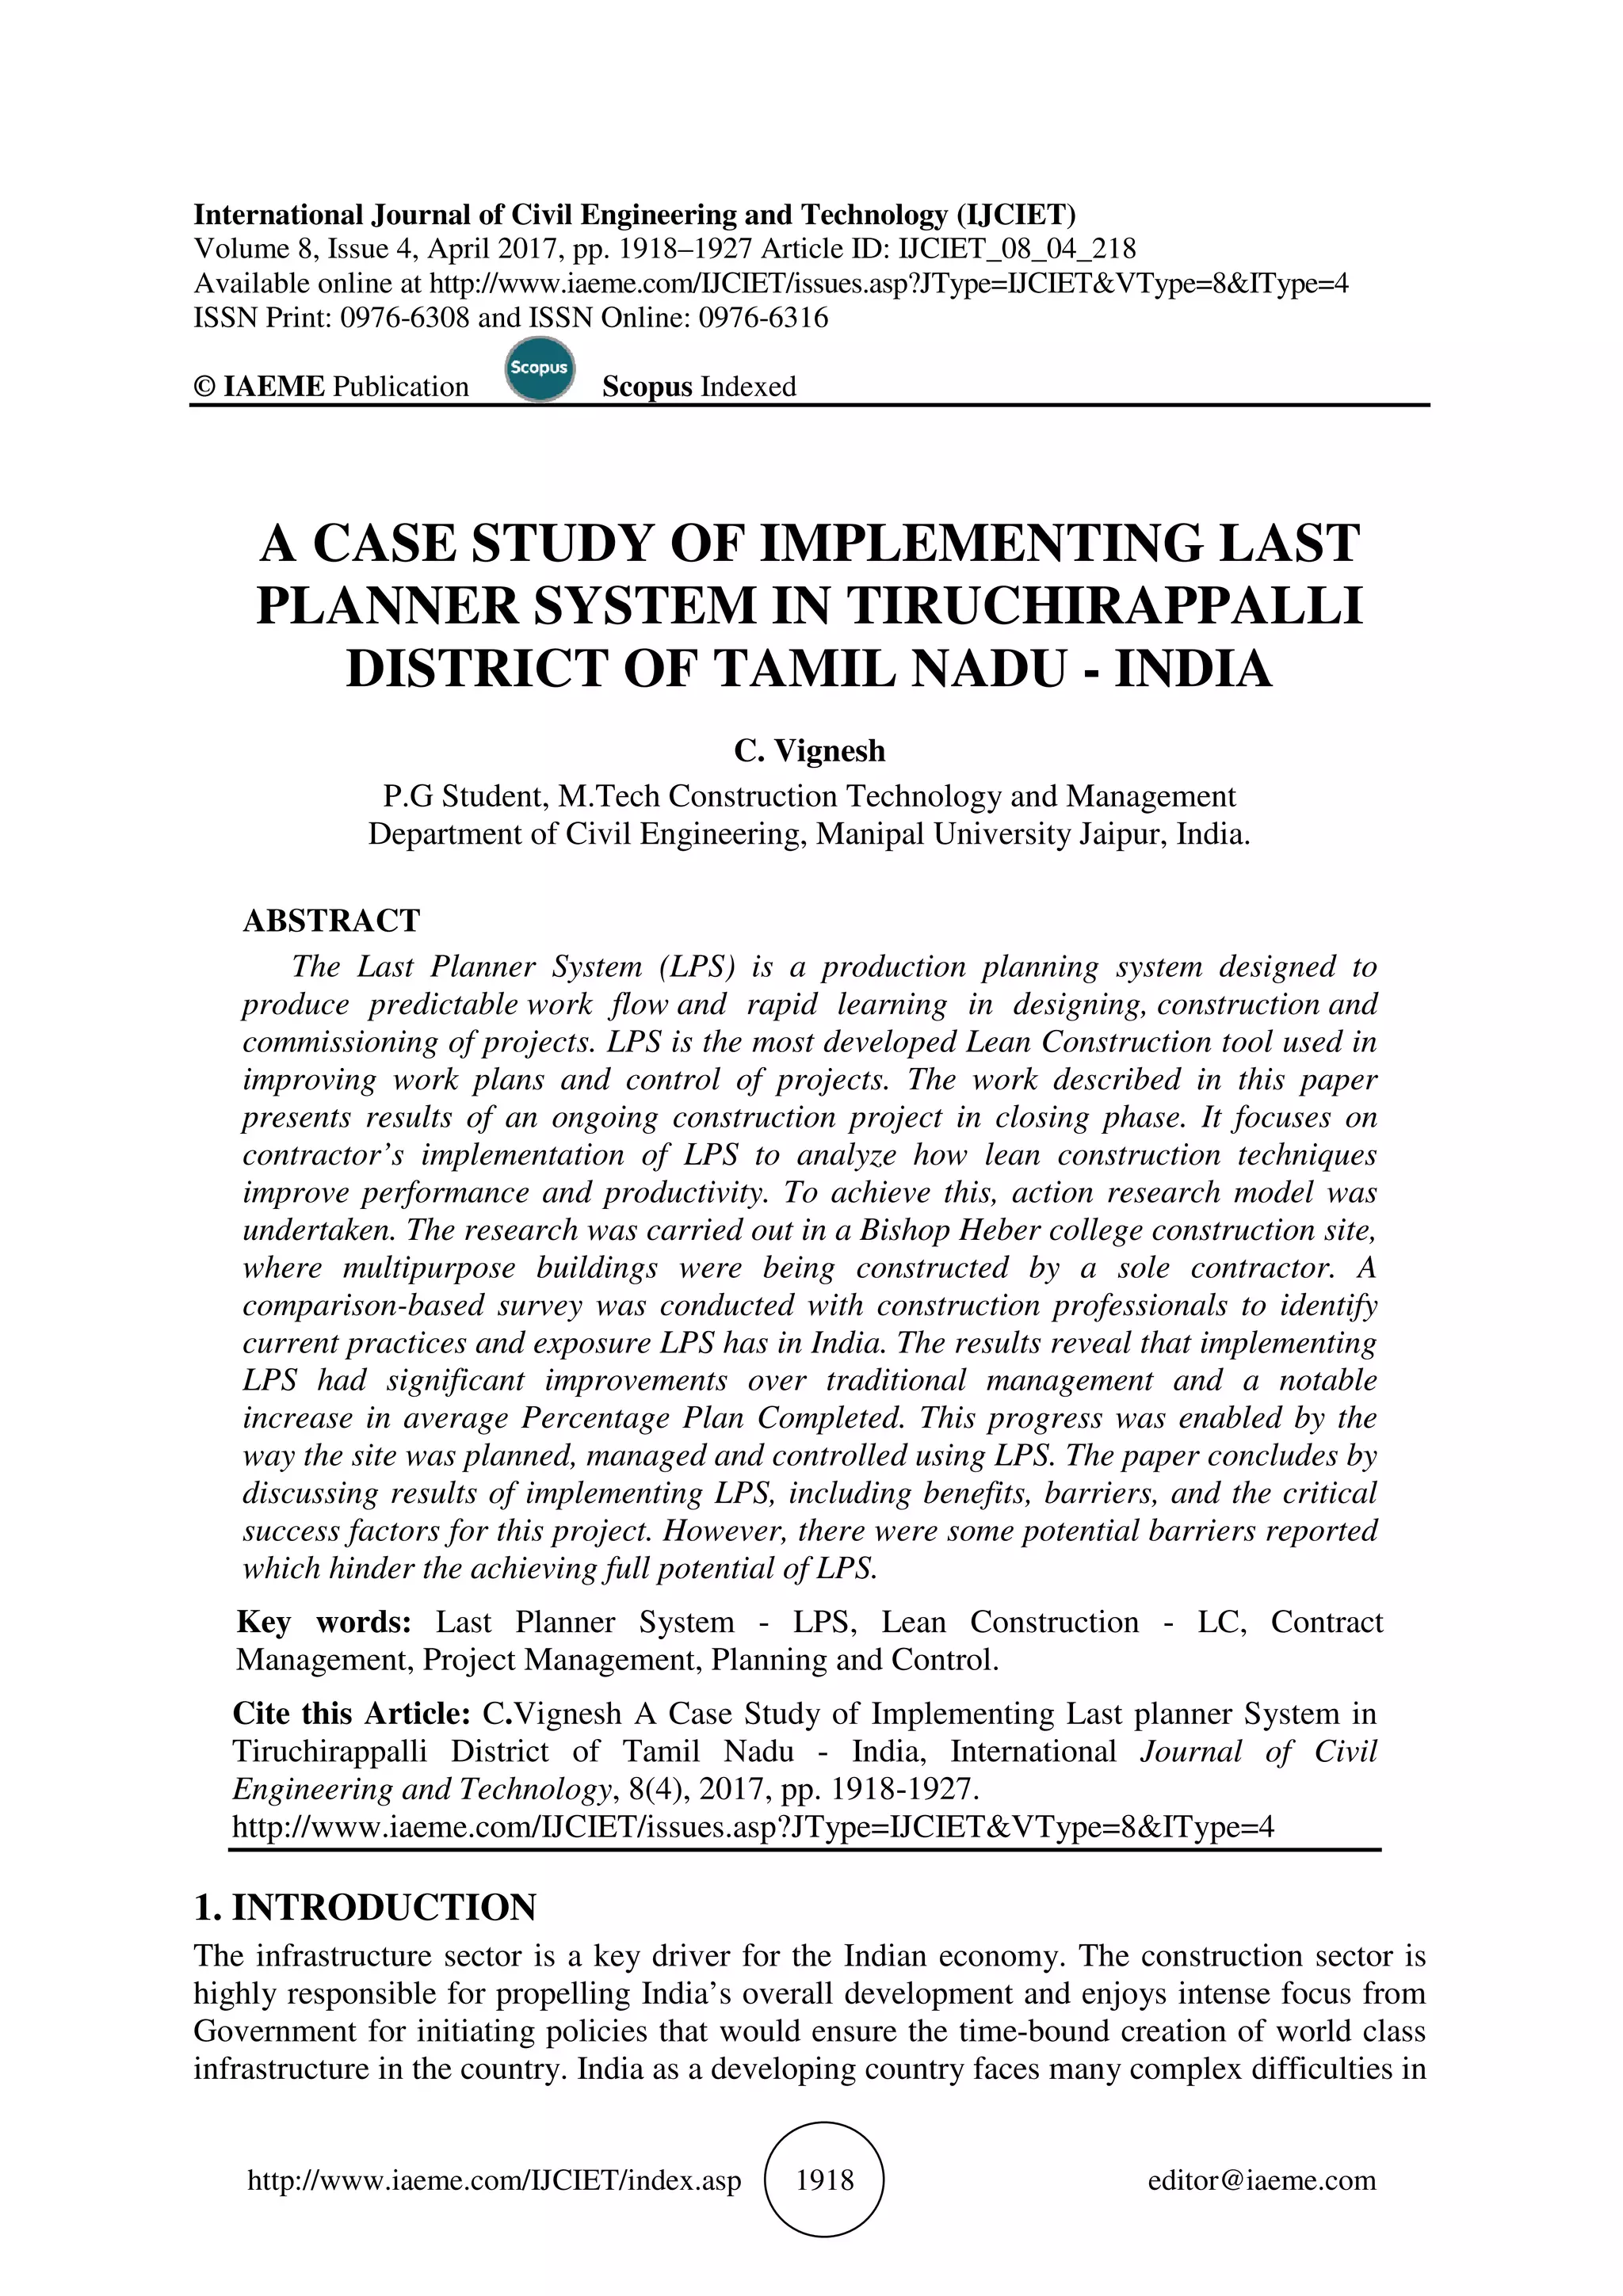
4. CASE STUDY BACKGROUND
The case study was carried out with the support of top management from the contractor side
in Bishop Heber college campus in tamilnadu, a southern region of India. The contract value
was approximately 8 cores in INR and with an estimated project duration of 22 months. The
LPS was only implemented half-way through the projects which was already 2 months
behind schedule. For initial 8 weeks, the author undertaking non-participant observations of
traditional management to familiarize how site activities were coordinated. During 8 weeks of
observation, the author found that the average PPC is 37.5%. Meanwhile, interview sessions
with one foreman and four superintendents were undertaken to ascertain the available
planning, control and management practice from neighboring organization to identify the
exposure and practices of LPS to help the implementation strategy of this study.](https://image.slidesharecdn.com/ijciet0804218-170519053742/85/Ijciet-08-04_218-4-320.jpg)
![A Case Study of Implementing Last planner System in Tiruchirappalli District of Tamil
Nadu - India
http://www.iaeme.com/IJCIET/index.asp 1923 editor@iaeme.com
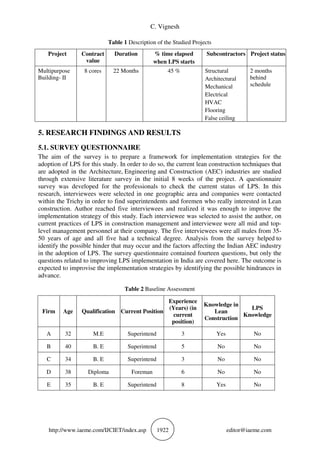
5.1.1. CROSS-PATTERN ANALYSIS
Table 3 Cross Pattern Analysis
(MS-Master Schedule, PPS-Pull Phase Schedule, LAP-Look ahead Planning, WWP-Weekly Work
Planning, PPC- Percentage Plan Complete)
As observed from literature and case organizations [1], only a few organizations
succeeded in implementing pull phase planning and look ahead planning functions. This led
to a situation where, in scheduling, a transition from the master plan level (i.e. high
level milestones) directly occurred to the monthly or weekly task level. This resulted in sub-
optimal plan performance, resulting in overall confusion since the constraint's analysis was
not carried out, and tasks were not analyzed for appropriate sequencing logic. In some cases,
the project manager and the site supervisor who would normally take responsibility for the
overall planning and scheduling felt that they were no longer responsible when the last
planners coordinated the project. A notable advice commonly given by all interviewees was
to educate participants about LPS, whether that meant breaking LPS down area-by-area or
just explaining how and why the company runs the jobs the way they do according to LPS.
5.1.2. OUTCOME OF THE SURVEY QUESTIONNAIRE
Some salient initiatives taken to effectively implement and improvise the LPS from the
survey are:
• For better communication and understanding, Training participants involved in the project
become a top priority.
• Establishing the foremen as one of the Last Planner to planning what “will” be done as
opposed to what “should”, highly improved the reliability of planning.
• Driving improvement was made when the majority of workers understand the analysis of
PPC, resulting in coordinating themselves accordingly in keeping or completing the
promises.
• It is being understood that the documentation needs to be user-friendly, demystified and
with reduced jargon since some subcontractor were uneducated. Hence, a standard excel
based A3 spreadsheet was used which included a bar chart of the week’s work, a list of
make ready needs and a make ready checklist and PPC column with a reason for the non-
completion section.
• The client or representative of client was expected to be involved in Last Planner system.
LPS
Component
Firm A Firm B Firm C Firm D Firm E
MS Implemented Implemented Implemented Implemented Implemented
PPS
Not
Implemented
Partial
Implementation
Not
Implemented
Partial
Implementation
Implemented
LAP Implemented Implemented Implemented Implemented Implemented
WWP Implemented Implemented Implemented Implemented Implemented
PPC
Partial
Implementation
Partial
Implementation
Implemented
Not
Implemented
Implemented](https://image.slidesharecdn.com/ijciet0804218-170519053742/85/Ijciet-08-04_218-6-320.jpg)
![A Case Study of Implementing Last planner System in Tiruchirappalli District of Tamil
Nadu - India
http://www.iaeme.com/IJCIET/index.asp 1927 editor@iaeme.com
REFERENCES
[1] Vignesh.C, Lean Construction - Approach Capable of Dealing with Complexity and
Uncertainty, International Journal of Engineering Research and Application , Vol. 6, Issue
11, ( Part -2) 2016, 22-29.
[2] Ballard, G. and Tommelein, I., Lean management methods for complex projects.
Engineering project organizational journal, 2(1),2012, 85-96.
[3] Aziz, R.F., Hafez, S.M. Applying lean thinking in construction and performance
improvement, Alexandria Eng. Journal, 2014.
[4] Mossman, Last Planner Overview: Collaborative Production Planning, Collaborative
Programme Coordination, Lean Construction Institute, 2005.
[5] McNiff, J; Whitehead, All You Need to Know About Action Research. London, UK:
Sage 2007 3–5.
[6] Rodriguez, A.D., Alarcón, L.F., Pellicer, E., Lagestión de la obradesde la perspectiva del
últimoplanificador. Revista de ObrasPúblicas, 2011, 35-44.
[7] Eugenio Pellicer, Fernando Cerveró, Alicia Lozano, José Luis Ponz-Tienda, The Last
Planner System Of Construction Planning And Control As A Teaching And Learning
Tool, Retrived from
http://www.academia.edu/28031708/The_Last_Planner_System_of_Construction_
Planning_and_Control_as_a_Teaching_and_Learning_Tool on 7-04-2017.
[8] González, V., Alarcón, L.F., Mundaca, F. “Investigating the relationship between
planning reliability and project performance”. Production Planning and Control, 2008,
461-474.](https://image.slidesharecdn.com/ijciet0804218-170519053742/85/Ijciet-08-04_218-10-320.jpg)

This document summarizes a case study on implementing the Last Planner System (LPS) in a construction project in Tiruchirappalli District, Tamil Nadu, India. The study focused on a contractor's use of LPS to improve performance and productivity on a multipurpose building project. Data was collected through non-participant observation, interviews, and surveys of construction professionals. Results showed that implementing LPS led to significant improvements over traditional management, including a notable increase in the average Percentage Plan Completed (PPC) metric. However, barriers to fully realizing the benefits of LPS in the Indian construction context were also identified.