20th Century Development: Unequal and Unsustainable
•
2 likes•859 views

This document discusses 20th century development and inequality. It notes that global economic development has created unequal development and unsustainable impacts. Waves of economic change from agriculture to manufacturing to services have created pockets of inequality and poverty within countries like the US. Global inequality is also discussed, with the top 1% owning 46% of global wealth. Achieving sustainable development goals while limiting warming to 2 degrees Celsius is presented as an immense challenge given the scale of emissions reductions required and accounting for historical emissions. Resistance and system change may be needed to transition to a sustainable path.

Recommended
Recommended
More Related Content
What's hot
What's hot (20)
Viewers also liked
Viewers also liked (20)
Similar to 20th Century Development: Unequal and Unsustainable
Similar to 20th Century Development: Unequal and Unsustainable (20)
Recently uploaded
Recently uploaded (20)
20th Century Development: Unequal and Unsustainable
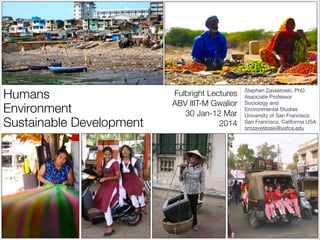
- 1. Humans Environment Sustainable Development Fulbright Lectures ABV IIIT-M Gwalior 30 Jan-12 Mar 2014 Stephen Zavestoski, PhD Associate Professor Sociology and Environmental Studies University of San Francisco San Francisco, California USA smzavestoski@usfca.edu
- 2. Lecture 2 Lecture 2 20th Century Development: Unequal and Unsustainable Stephen Zavestoski, PhD Associate Professor Sociology and Environmental Studies University of San Francisco San Francisco, California USA smzavestoski@usfca.edu
- 3. Inequality Within • Global inequalities often overshadow inequalities within countries • Paradoxically, obesity in the U.S. is partially an outcome of inequality and poverty • • • Poor people may have limited or no access to fresh and healthy food Affordable food options are usually junk foods with low nutritional value Waves of economic change, from agriculture to manufacturing to service and information exchange, have created pockets of inequality and poverty around the U.S. • • The city of Detroit, known for making cars in the 20th century, is dealing with the fallout of massive population loss and abandonment of buildings and infrastructure The U.S. economy’s transition to information or knowledge exchange has left behind not only less developed countries, but segments of its own population as well
- 4. U.S. Economic Activity, Split in Half Analysis by Andy Woodruff, “It’s Just a Population Map!” http://andywoodruff.com/blog/its-just-apopulation-map/ based on original map http://visual.ly/united-states-economic-activity-split-half
- 5. Inequality across the globe • "Our estimates suggest that the lower half of the global population possesses barely 1% of global wealth, while the richest 10% of adults own 86% of all wealth, and the top 1% account for 46% of the total." From Oxfam report “Working for the Few: Political Capture and Economic Inequality” (PDF)
- 6. How did we get here?! ! Can we get out of this mess?
- 7. Homo sapiens is not a physically imposing species—and in terms of biomass does not take up much room. If the bodies of all 6.5 billion human beings alive on earth today were log-stacked, they would fill less than a cubic mile. They could be lowered out of sight in some small corner or other of the Grand Canyon. Our musculature is even less imposing. Thin and wobbly-headed, we appear to have arisen by natural selection to run marathons across African savannas in pursuit of antelope and other strongly built but short-winded animal prey.
- 8. How did such frail creatures come to be a geophysical force and dominate the world? Brains, obviously. Somehow, by a process still not well understood, we mastered fire, invented weaponry, and learned to talk to one another in arbitrarily devised symbolic languages. But in rising to power, beginning with the invention of agriculture a scant 10 millennia ago, we carried along with us the heavy baggage of ancient primate instincts. Today, as a result, we live in Star Wars civilizations ruled by Stone Age emotions, medieval institutions, and god-like technology.
- 9. We haven't really figured out yet, as a species, what we are, where we are going, and what we will be when we get there. But at least we have discovered that we are fast ruining the global environment. The scientific evidence for that conclusion is now massive and compelling. The following kaleidoscope of maps ... exhibit the ghastly power of humanity's planetary engineering—and the importance of envisioning the planet as a whole.
- 10. The bottom line is that we have created a real mess. In order to avoid wrecking our planetary home, we have to settle down and together devise the means to achieve sustainable development while preserving our biosphere. The good news is that the same thing that has gotten us into trouble—those brains of ours—can get us out. We're smart. We can do it. —E. O. WILSON (“Problems without Borders,” Vanity Fair, 2007)
- 11. Welcome to the Anthropocene
- 12. ANTHROPOCENE: A NEW GEOLOGIC EPOCH New geological ages are characterized by changes in global environmental conditions and large scale shifts in types of species. Recently Earth has entered into a new geological age: • The Anthropocene, from anthropo (man) and cene (new), defines a new [geological age]. • • Humans are now changing the world on a global scale and ushering in the new era in geologic time. "The biosphere itself, at all levels from genetic to the landscape, is increasingly a human product" (Allenby 2000: 15).
- 13. Where has all this change occurred? Forest Loss This map shows the proportion of worldwide net forest loss that occurred in countries between 1990 and 2000…
- 14. And who is responsible? Wood and Paper Imports … while this map shows the proportion of worldwide net imports of wood and paper in U.S. dollars. Deforestation accounts for 25 percent of global carbon emissions.
- 15. Fuel Imports Territory size shows the proportion of worldwide fuel imports. In the next 20 years, the U.S. demand for oil is expected to jump 30 percent, with demand for natural gas jumping by more than 50 percent.
- 16. Fuel Consumption
- 17. (Unequal) Problems Without Borders Our “mess” was not created by all of us equally. Nor do we share equally in the consequences of the mess we’ve created. Environmental studies with a social justice lens goes beyond focusing on how to use our brains simply to devise technical solutions; instead focusing our attention on equitable solutions– solutions whose burdens and benefits are proportionate to our contributions to the problem.
- 18. ! Worldwide fuel consumption averages 1853 kilograms of oil equivalent per person per year. The highest per person fuel users (in Luxembourg) use almost a hundred times more fuel per person than the lowest fuel users (in Bangladesh). ! (1kg of oil produces about 4 kilowatt hours)
- 20. Climate-Development Vulnerability Index (CDVI)
- 21. Can a climate agreement be reached in a world of such inequality?
- 22. UNFCCC Goals • The ultimate objective… is stabilization of greenhouse gas concentrations in the atmosphere at a level that would prevent dangerous anthropogenic interference with the climate system. Such a level should be achieved within a time frame sufficient…to enable economic development to proceed in a sustainable manner. (Article 2, 1992)
- 23. UNFCCC Goals • The more recent Copenhagen Accord states the goal as to ‘hold the increase in global temperature below 2 degrees Celsius, and take action to meet this objective consistent with science and on the basis of equity’ (UNFCCC 2010) • Reiterated in the Cancun Agreements (UNFCC 2011) • EU and UK statements emphatically support 2º goal see Kevin Anderson, 2012, “Climate change going beyond dangerous–Brutal numbers and tenuous hope,” Development Dialogue. Accessed at: http://www.dhf.uu.se/publications/development-dialogue/dd61/
- 24. Is 2º feasible? ❖ The disastrous collapse of the Soviet Union triggered 5 per cent year-on-year emission reductions for about 10 years – a rate just half to a quarter of what is necessary to give us a 50:50 chance of achieving the 2°C goal see Kevin Anderson, 2012, “Climate change going beyond dangerous–Brutal numbers and tenuous hope,” Development Dialogue. Accessed at: http://www.dhf.uu.se/publications/development-dialogue/dd61/
- 25. Is 2º feasible? ❖ “Reduction rates of 10-20 per cent are unprecedented–there are no appropriate analogues for this level of mitigation The Stern report (Stern, 2006) concludes that cuts in emissions greater than 1 per cent have historically been associated only with economic recession or upheaval.”! ❖ “The disastrous collapse of the Soviet Union triggered 5 per cent year-on-year emission reductions for about 10 years–a rate just half to a quarter of what is necessary to give us a 50:50 chance of achieving the 2°C goal.”
- 26. The Climate Divide Questions ❖ Who gets the remaining atmospheric space for carbon?! ❖ How do we account for historical emissions? (Climate Debt)! ❖ ❖ Allow non-Annex I countries a grace period before beginning annual reductions! Even allowing for a slower curtailment of emissions, can non-Annex I countries reach the human development threshold?
- 27. Climate Debt: ! Ethical Perspectives ❖ Deontological (rights-based) “Everyone has a right to an equal share of the remaining atmospheric space” (South)! ❖ Consequentialist (goal-based) “The goal is sustainable human development, however we may get there” (North)! ❖ Can agreement be reached from these divergent perspectives?
- 28. History of Climate Debt as a Concept ❖ 1991 CSE report “Global Warming in an Unequal World” (Agarwal and Narain)! ❖ argued need to account for sources of emissions and terrestrial sinks when determining CO2 contributions; and each nation’s “just and fair share of oceanic and atmospheric sinks–a common heritage of humankind.”! ❖ “survival emissions” vs “luxury emissions”! ❖ Pachauri, then at TERI, applauded CSE’s report for “making public certain fallacies…currently guiding the thinking of…countries of the North.” ! ❖ Development Alternatives: hold developed countries liable based on concept of “natural debt” (K. Chatterjee, interview with Jasanoff, 1991) ! ❖ Beijing Declaration on Environment and Development (1991)! ❖ Placed primary blame on developed countries as “mainly responsible for excessive emissions…historically and currently”
- 29. gapminder.org
- 30. 2º: Is it possible? ❖ Kevin Anderson and Alice Bows have analysed how far it is possible to push non-Annex 1 emissions, and then looked at what would be left for the Annex 1 countries. Analyses are based on an emissions budget corresponding to a 40 per cent likelihood of exceeding 2°C. They note that this is ”not a very ambitious scenario in relation to the risks involved.” ! ❖ The following figure illustrates what they found Next three slides: Kevin Anderson, 2012, “Climate change going beyond dangerous–Brutal numbers and tenuous hope,” Development Dialogue.
- 31. Realistic Scenario for a 2º Solution ❖ Emissions grow to a peak in 2025, at a growth rate of 3.5 per cent per annum, much lower than China’s actual 6-8 per cent growth! ❖ Following the peak in 2025, emissions decrease at 7 per cent every year, twice the rate that the Stern review and most economists claim is the limit within a growing economy.!
- 32. Is a rights-based climate debt frame viable? ❖ Stern (2009): ‘if the allocation of rights to emit in any given year took greater account both of history and of equity in stocks rather than in flows, then rich countries would have rights to emit which were lower than 2 tonnes per capita (possibly even negative)’ (p. 154).! ❖ Are non-Annex 1 countries asking for negative emissions?! ❖ No, but “assertions of climate debt are likely to be interpreted more as aggrieved political rhetoric than as considered policy proposals.” ! ❖ Bonding vs. Bridging see Jonathan Pickering and Christian Barry, 2012. On the concept of climate debt: its moral and political value, Critical Review of International Social and Political Philosophy Vol. 15, No. 5: 667–685.
- 33. The low-carbon solution ❖ How is economic growth compatible with this reality? ❖ For Annex I, it’s really a NO carbon solution requiring immediate transition to a steady-state economy. ❖ For non-Annex I, this aggressive target requires a lowcarbon solution, presumably dependent on adoption of high-efficiency technologies.! ❖ How much improvement in CO2 intensity per unit of economic output depends on how much economies are expected to/need to grow to achieve human development
- 34. gapminder.org Cumulative CO2 emissions and HDI In the last 40 years, improvements in human well-being have been mostly driven by increasing GDPs which have consistently carried increases in CO2 ! Continuing on this path requires reducing carbon intensity of economies
- 35. gapminder.org kg CO2 per 2005 PPP $US and GDP All of the easy efficiency gains have been realized
- 36. Why is this so stark? ❖ Previous analyses assumed! ❖ 1-2% annual CO2e increases before peaking; and! ❖ a peak reached around 2015 or 2016! ❖ ❖ ❖ The assumed reduction rates are dictated by economists, which is why the early years of these analyses are unrealistic (Anderson)! The split between Annex 1 and non-Annex 1 countries is neglected or hidden in many analyses (disregard for HDI goals and capabilities)! A global 2015 peak would require China and India to peak by 2017/18; “yet no analysts suggest this is, in any respects, either reasonable or equitable.”
- 37. Can development goals be reached when linked to GDP growth? ❖ How effective or efficient has GDP been at driving down poverty?
- 38. Conversion of GDP growth into poverty reduction (1981-2011) 1981-2011 1981-2011 Pop. below % GDP inc. GDP % Population poverty line for 1% change % change (% change) poverty dec. (billions) Bangladesh 321% 81% 13% 25% China 1,750% 35% 68% 25% India 508% 68% 17% 30%
- 39. Estimated economic growth needed to eliminate poverty by 2044 2011 % in poverty Pop. below poverty line (% change) % GDP inc. for 1% poverty decline 2044 % change in GDP to end poverty Est. CO2 emissions 2044* (millions of mt) Bangladesh 77% 13% 25% 1,925% 171 China 30% 68% 25% 750% 9,287 India 69% 17% 30% 2,070% 4,674 * at 2005 carbon intensity level; assumes doubling of efficiency and no population growth
- 40. So are we “f**ked”? At Fall 2012 meeting of the American Geophysical Union, geophysicist Brad Werner presented a paper titled: ❖ “Is Earth F**ked? Dynamical Futility of Global Environmental Management and Possibilities for Sustainability via Direct Action Activism”
- 41. Werner’s answer? ❖ “More or less.”! ❖ Werner’s computer model incorporated system boundaries, perturbations, dissipation, attractors, bifurcations, etc.; but it also pointed to a new component atypical for a serious scientific meeting… see Naomi Klein, “How science is telling us all to revolt,” New Statesman, Oct 29, 2013. ! Accessed at: http://www.newstatesman.com/2013/10/science-says-revolt)
- 42. Werner’s answer? ❖ “Resistance”! ❖ “environmental direct action, resistance taken from outside the dominant culture, as in protests, blockades and sabotage by indigenous peoples, workers, anarchists and other activist groups”.! ❖ mass uprisings…represent the likeliest source of “friction” to slow down an economic machine that is careening out of control. ! ❖ “if we’re thinking about the future of…our coupling to the environment, we have to include resistance as part of that dynamics.” That, Werner argues, is not a matter of opinion, but “really a geophysics problem”. see Naomi Klein, “How science is telling us all to revolt,” New Statesman, Oct 29, 2013. ! Accessed at: http://www.newstatesman.com/2013/10/science-says-revolt)
- 43. An Alternative Development Path A cultural tunnel through the Environmental Kuznets Curve Source: adapted from Munasinghe 1995a (also see http://www.eoearth.org/view/article/155728/)
- 44. A Cultural Tunneling Through… • What would it look like? What would be required? • • • Transformation of the Social Life Processes Identity transformation driving technological, political, economic and other transformations Recall the “Social World-Biophysical World Communication” diagram from Lecture 1…
- 45. Social World-Biophysical World Communication ECOLOGICAL PROCESSES SOCIAL LIFE PROCESSES Water and air purification Cultural beliefs Material culture Value systems Economic systems Political systems Social institutions Self-concept Socialization Social control Social structure Social World Technology Ecological Processes Biophysical World Social Life Processes Drought and flood mitigation Decomposition and detoxification of wastes Generation and renewal of fertile soil Pollination Seed dispersal and translocation of nutrients Maintenance of biodiversity Protection from UV rays Climate stability Moderation of extremes (e.g., temp., waves, wind) (Daily 1997)