Downloaded 146 times

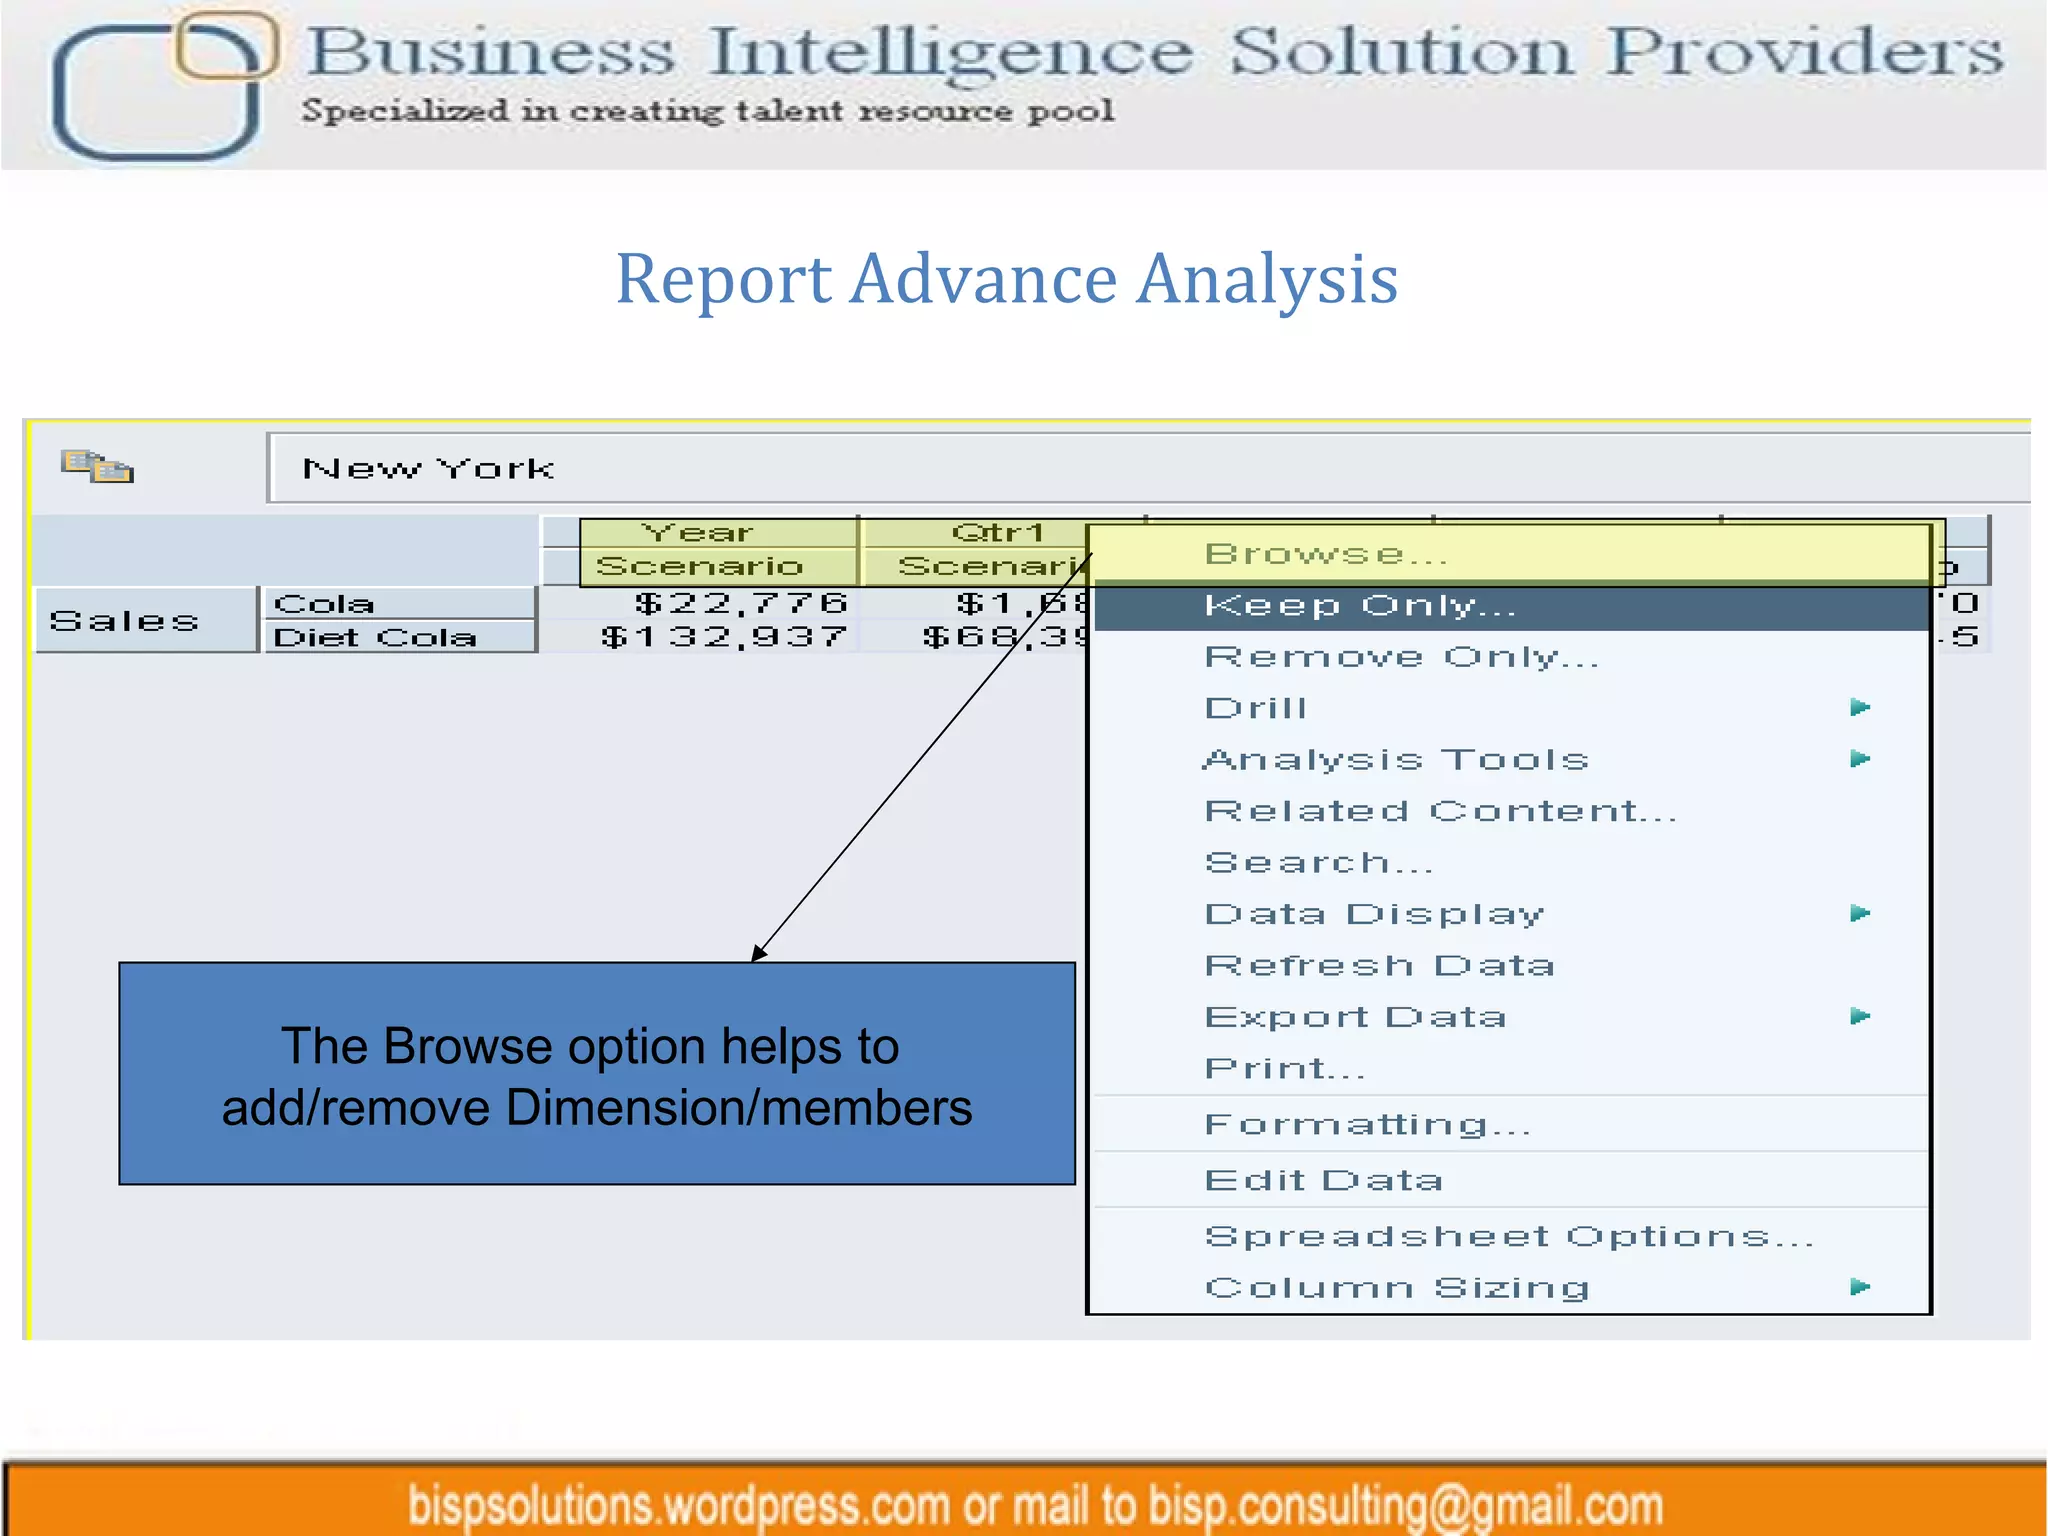
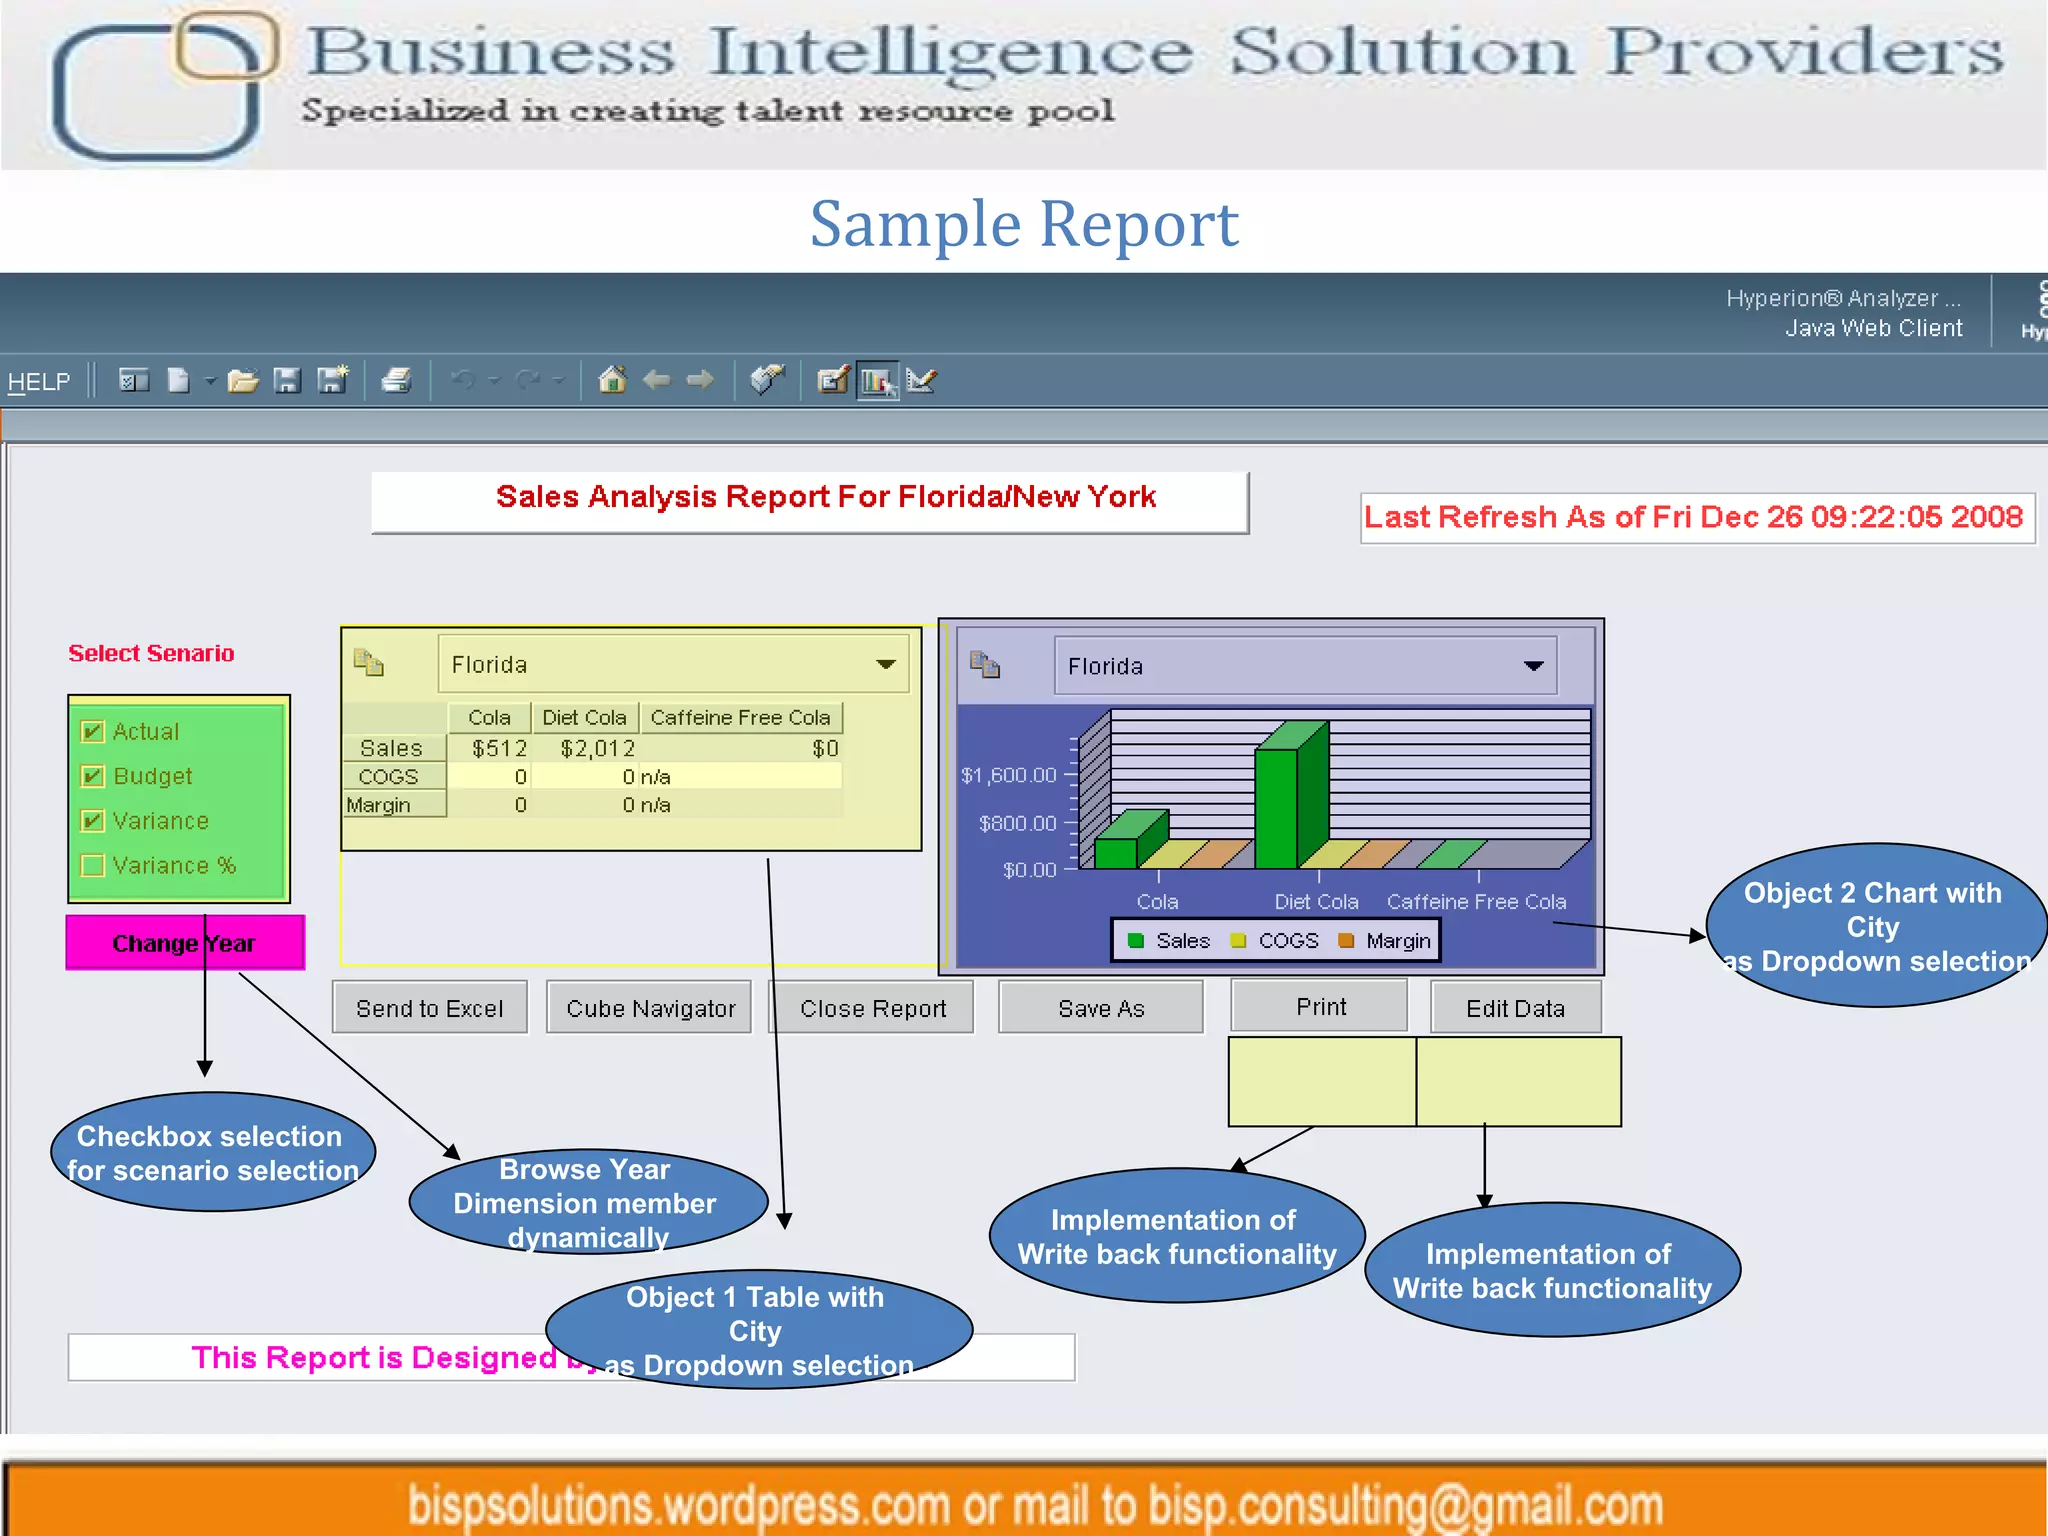
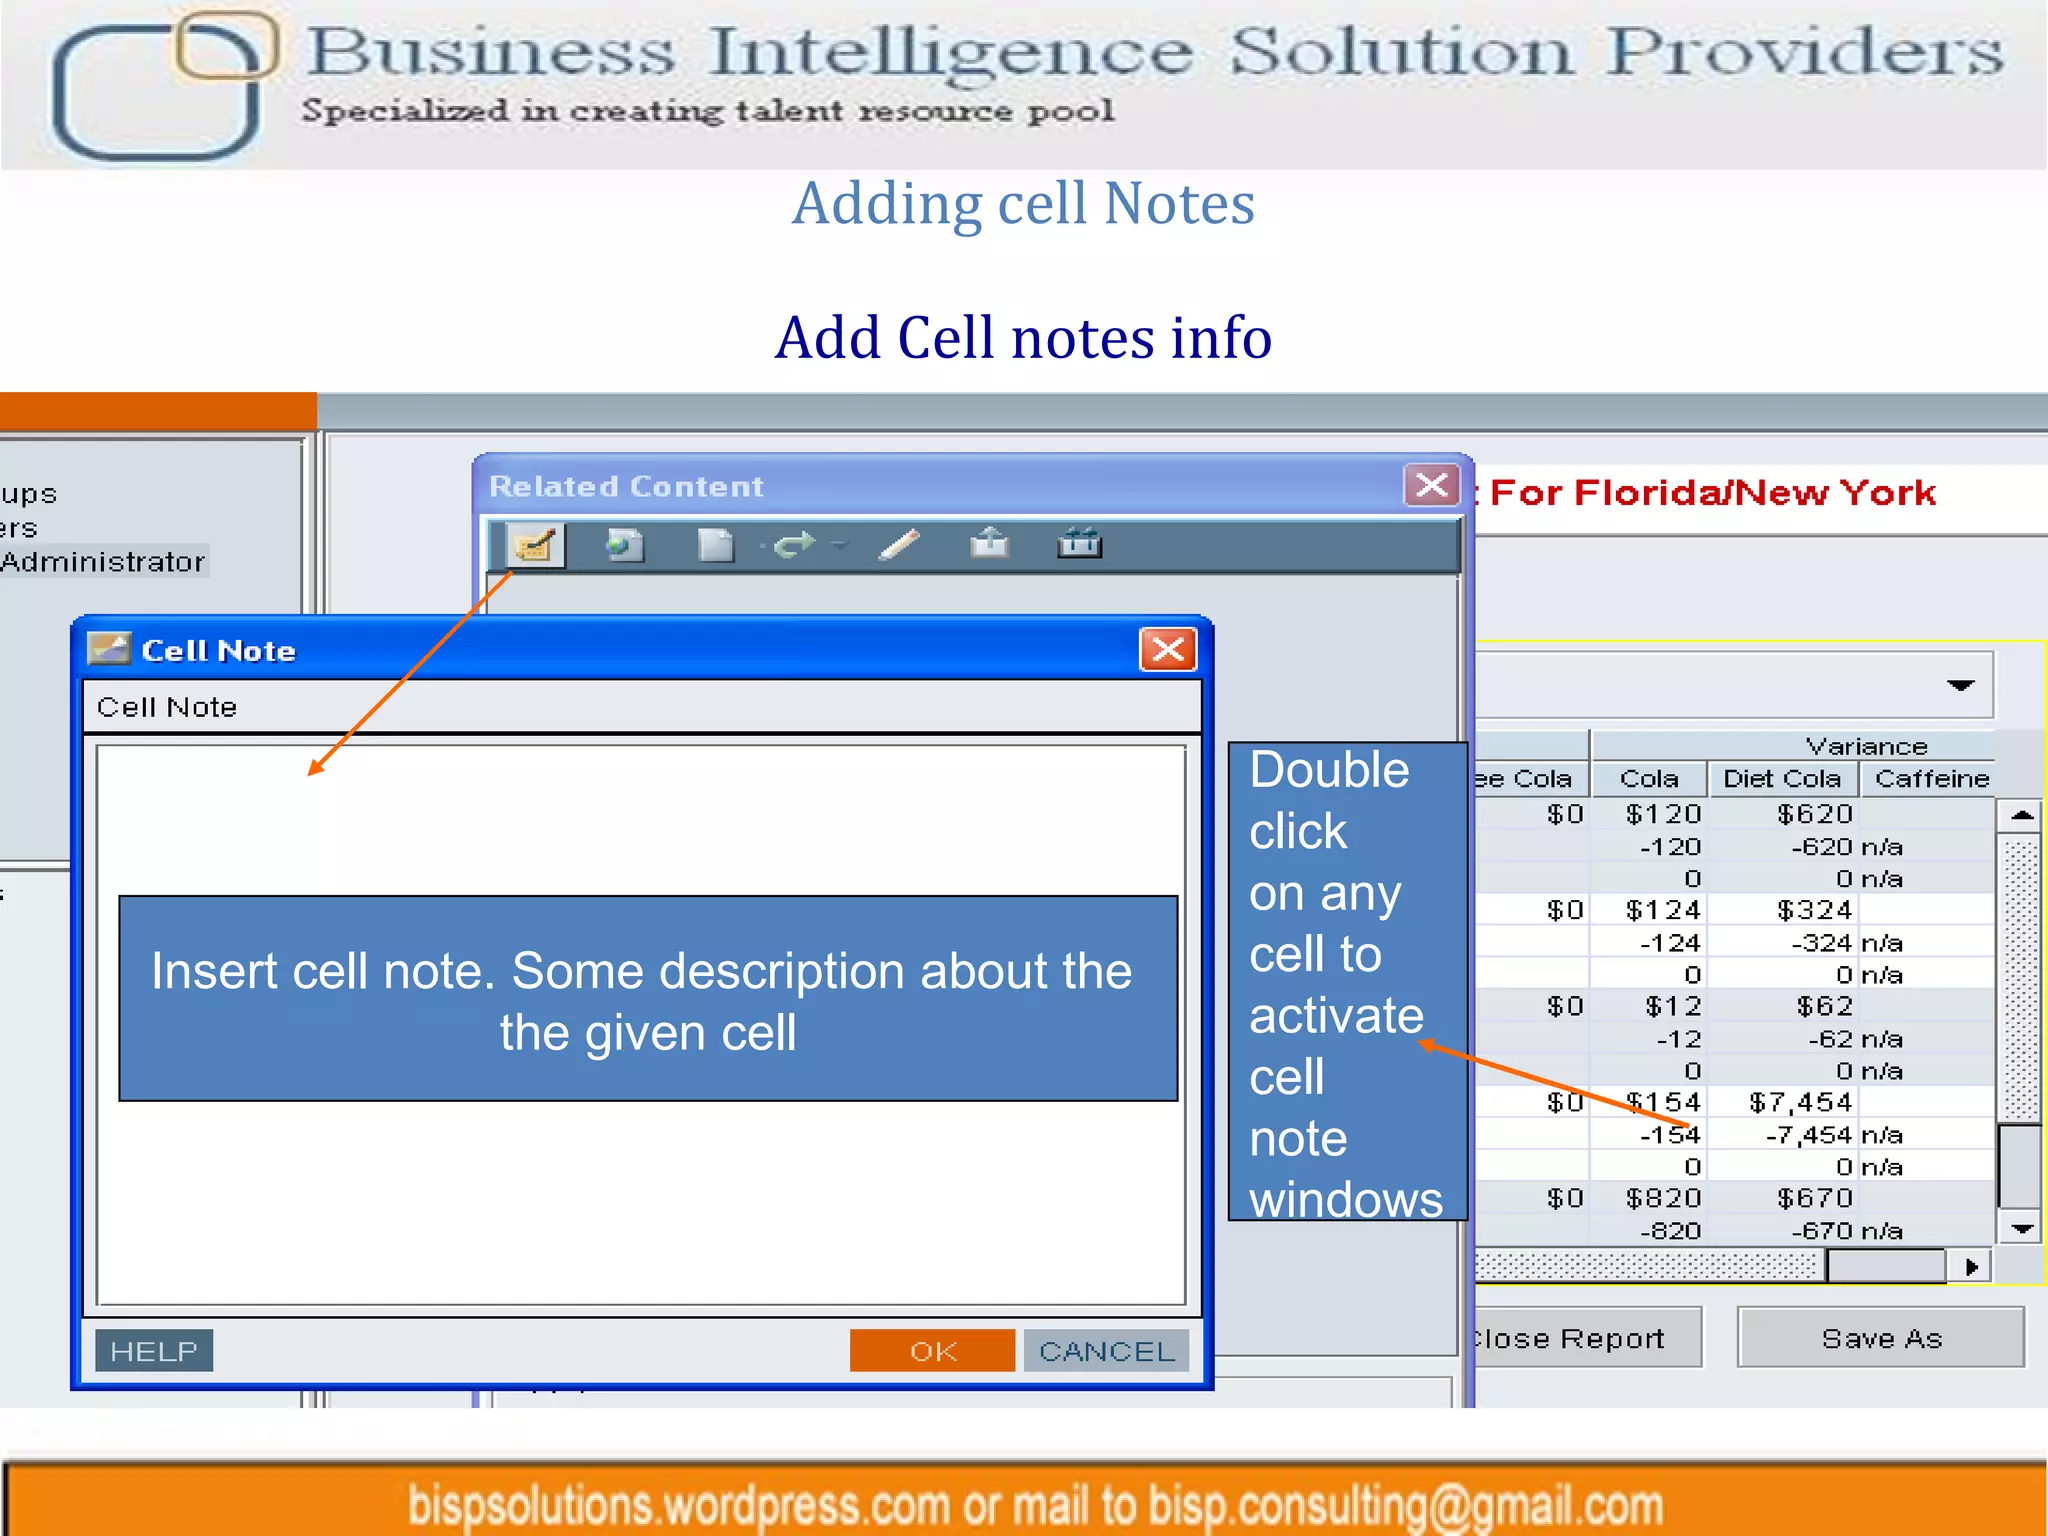
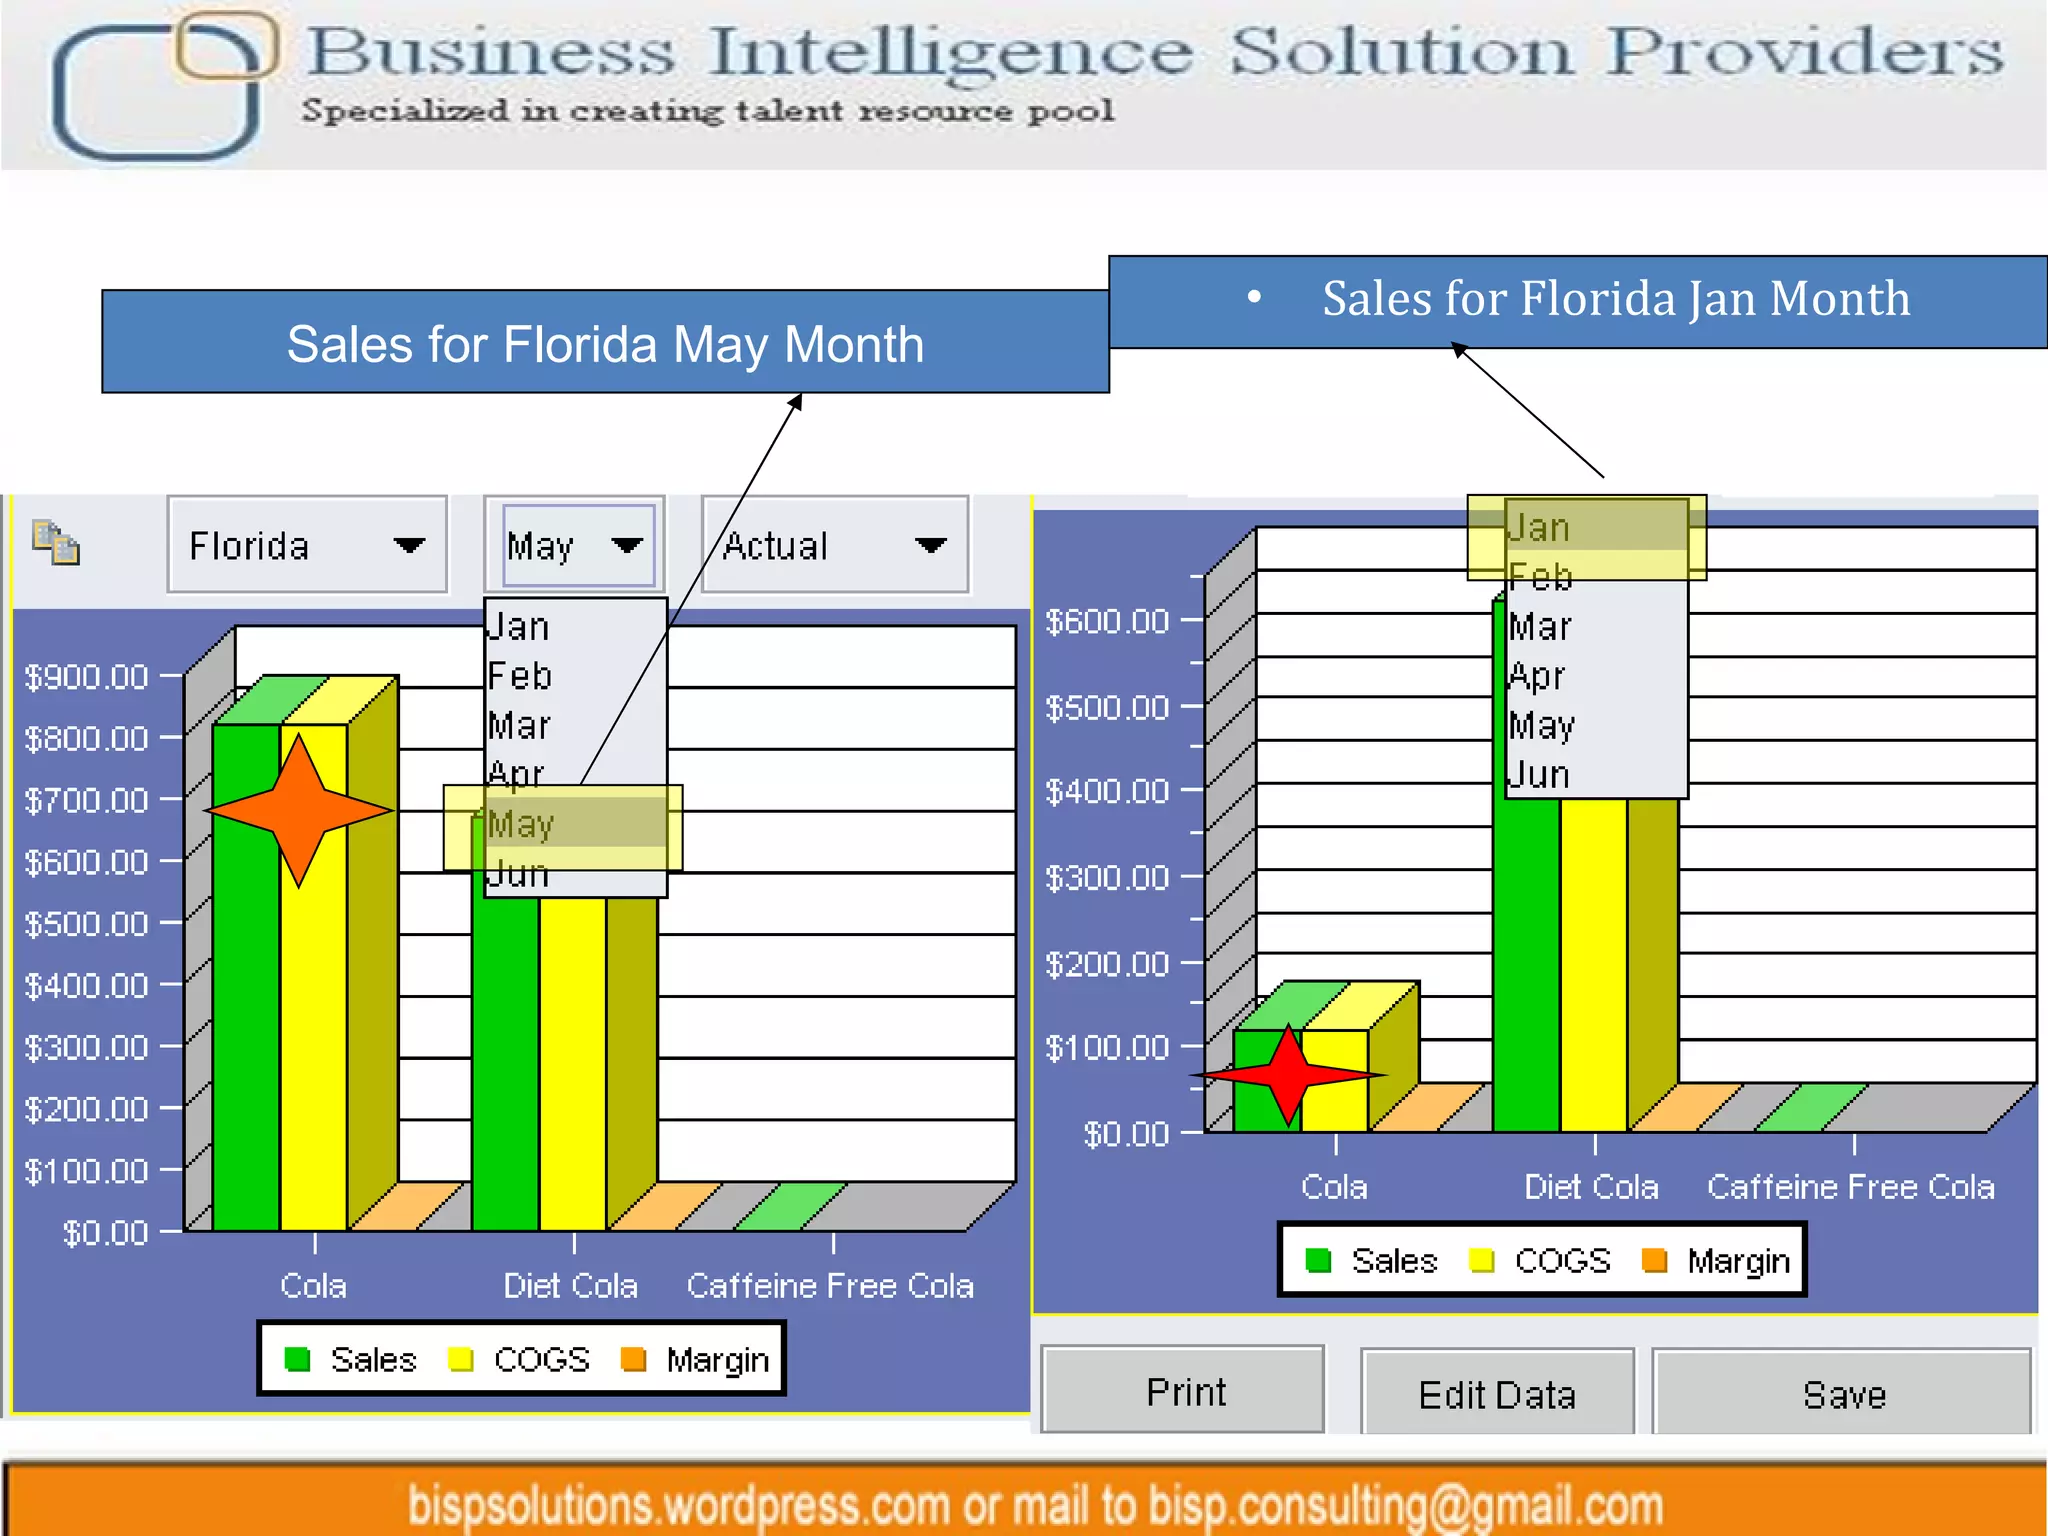
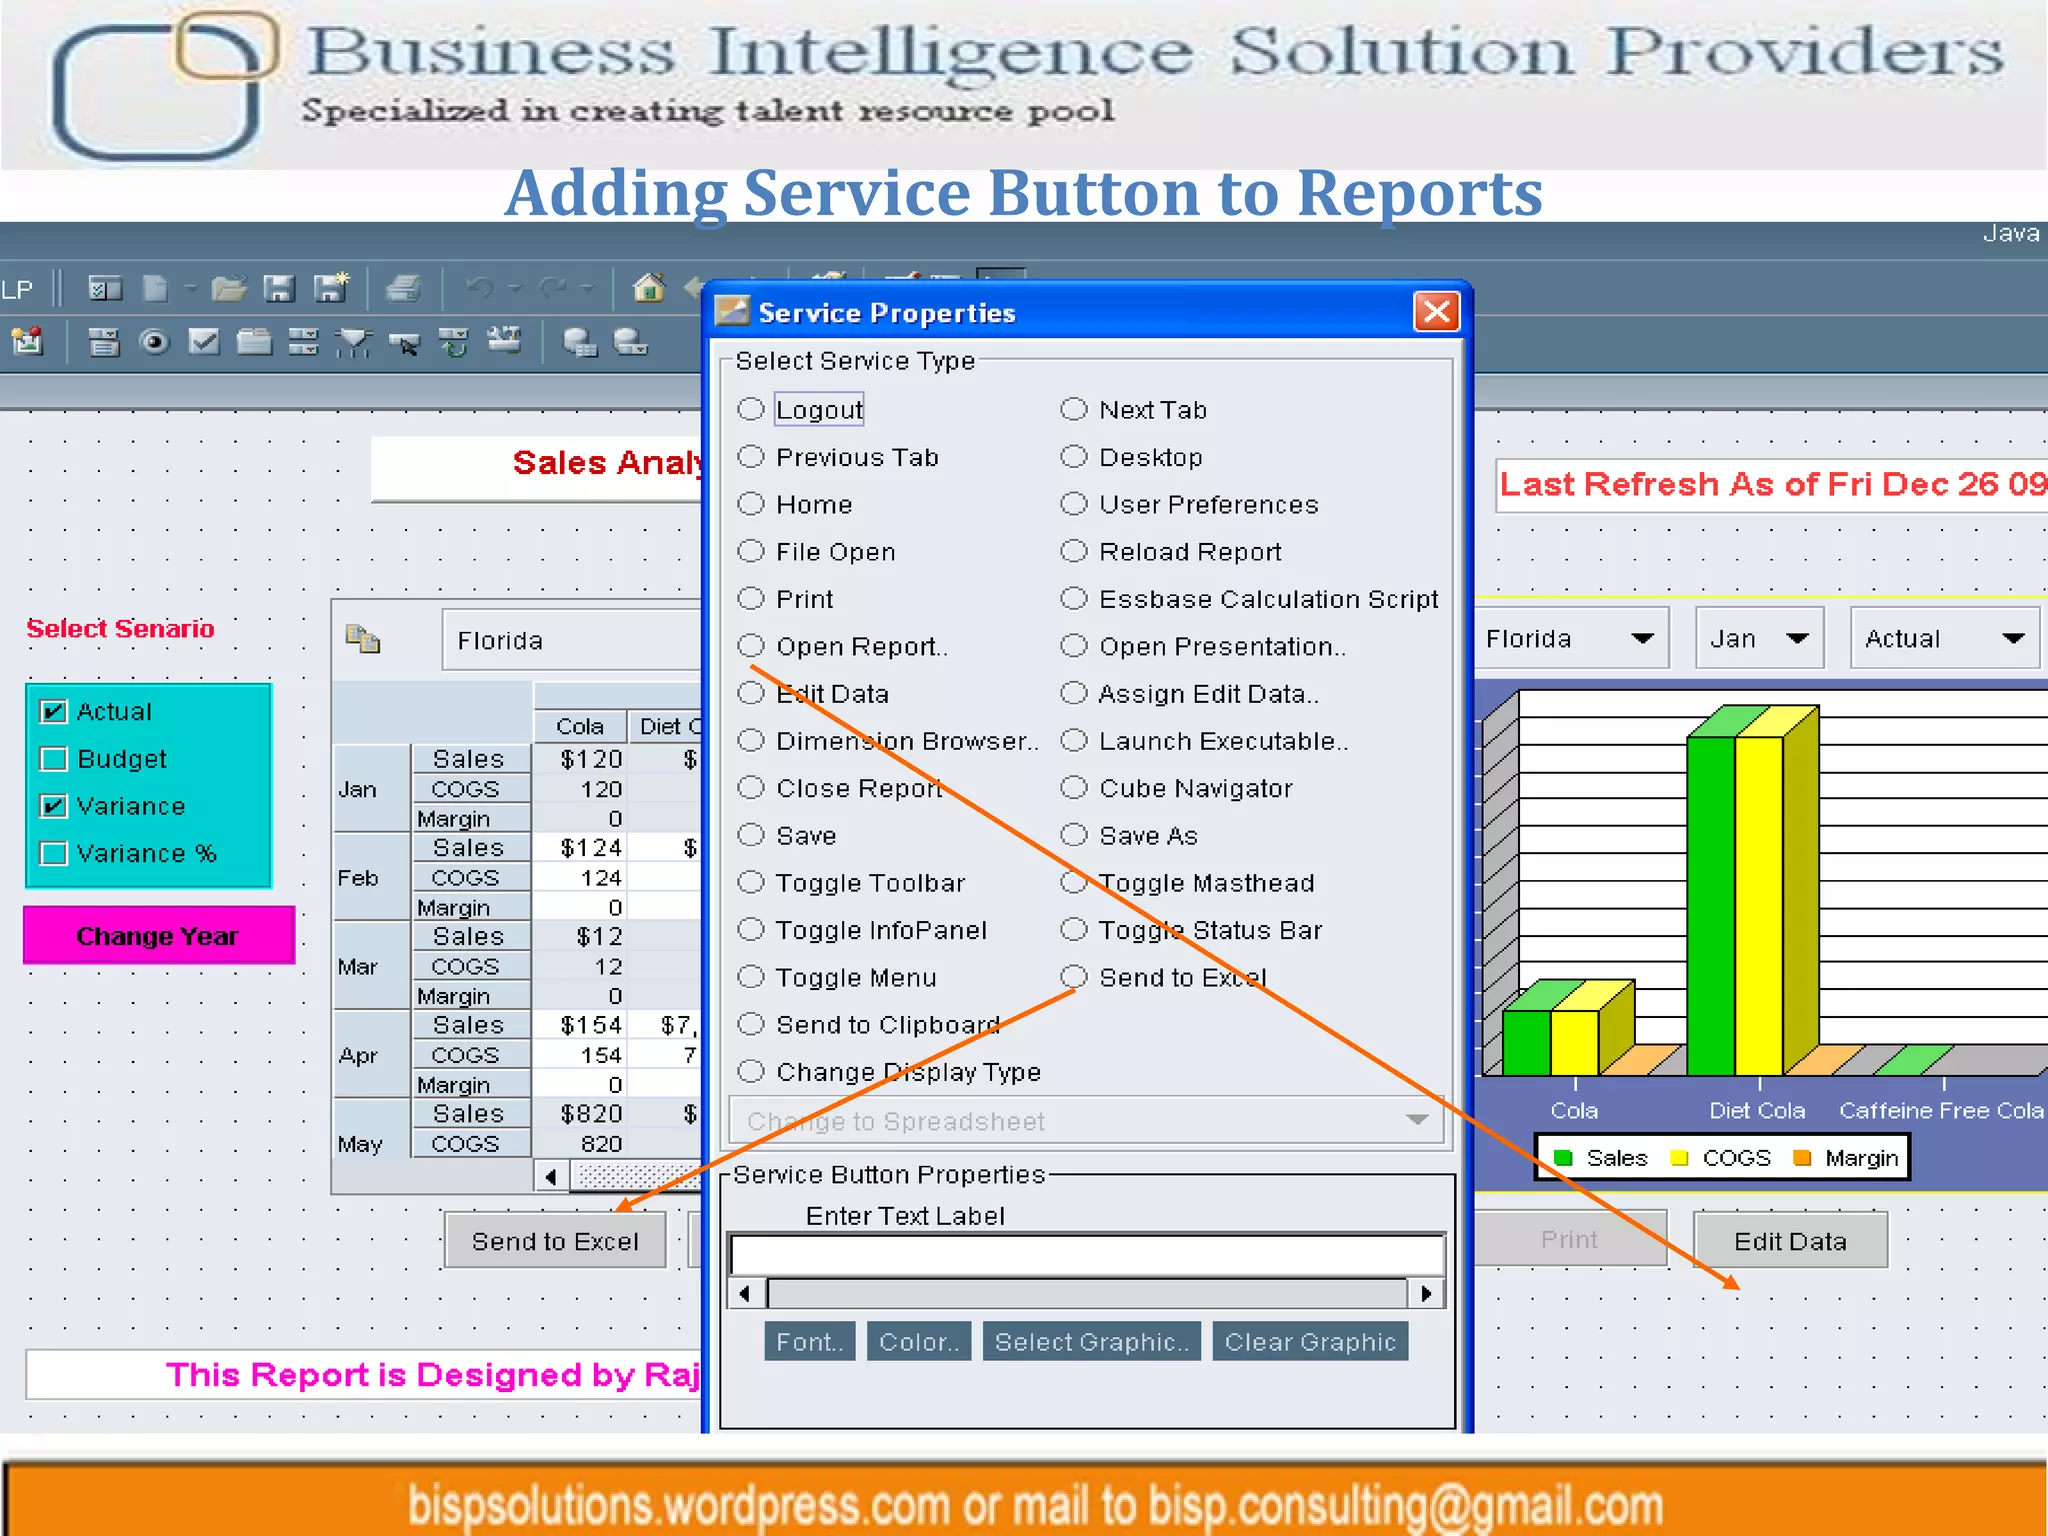
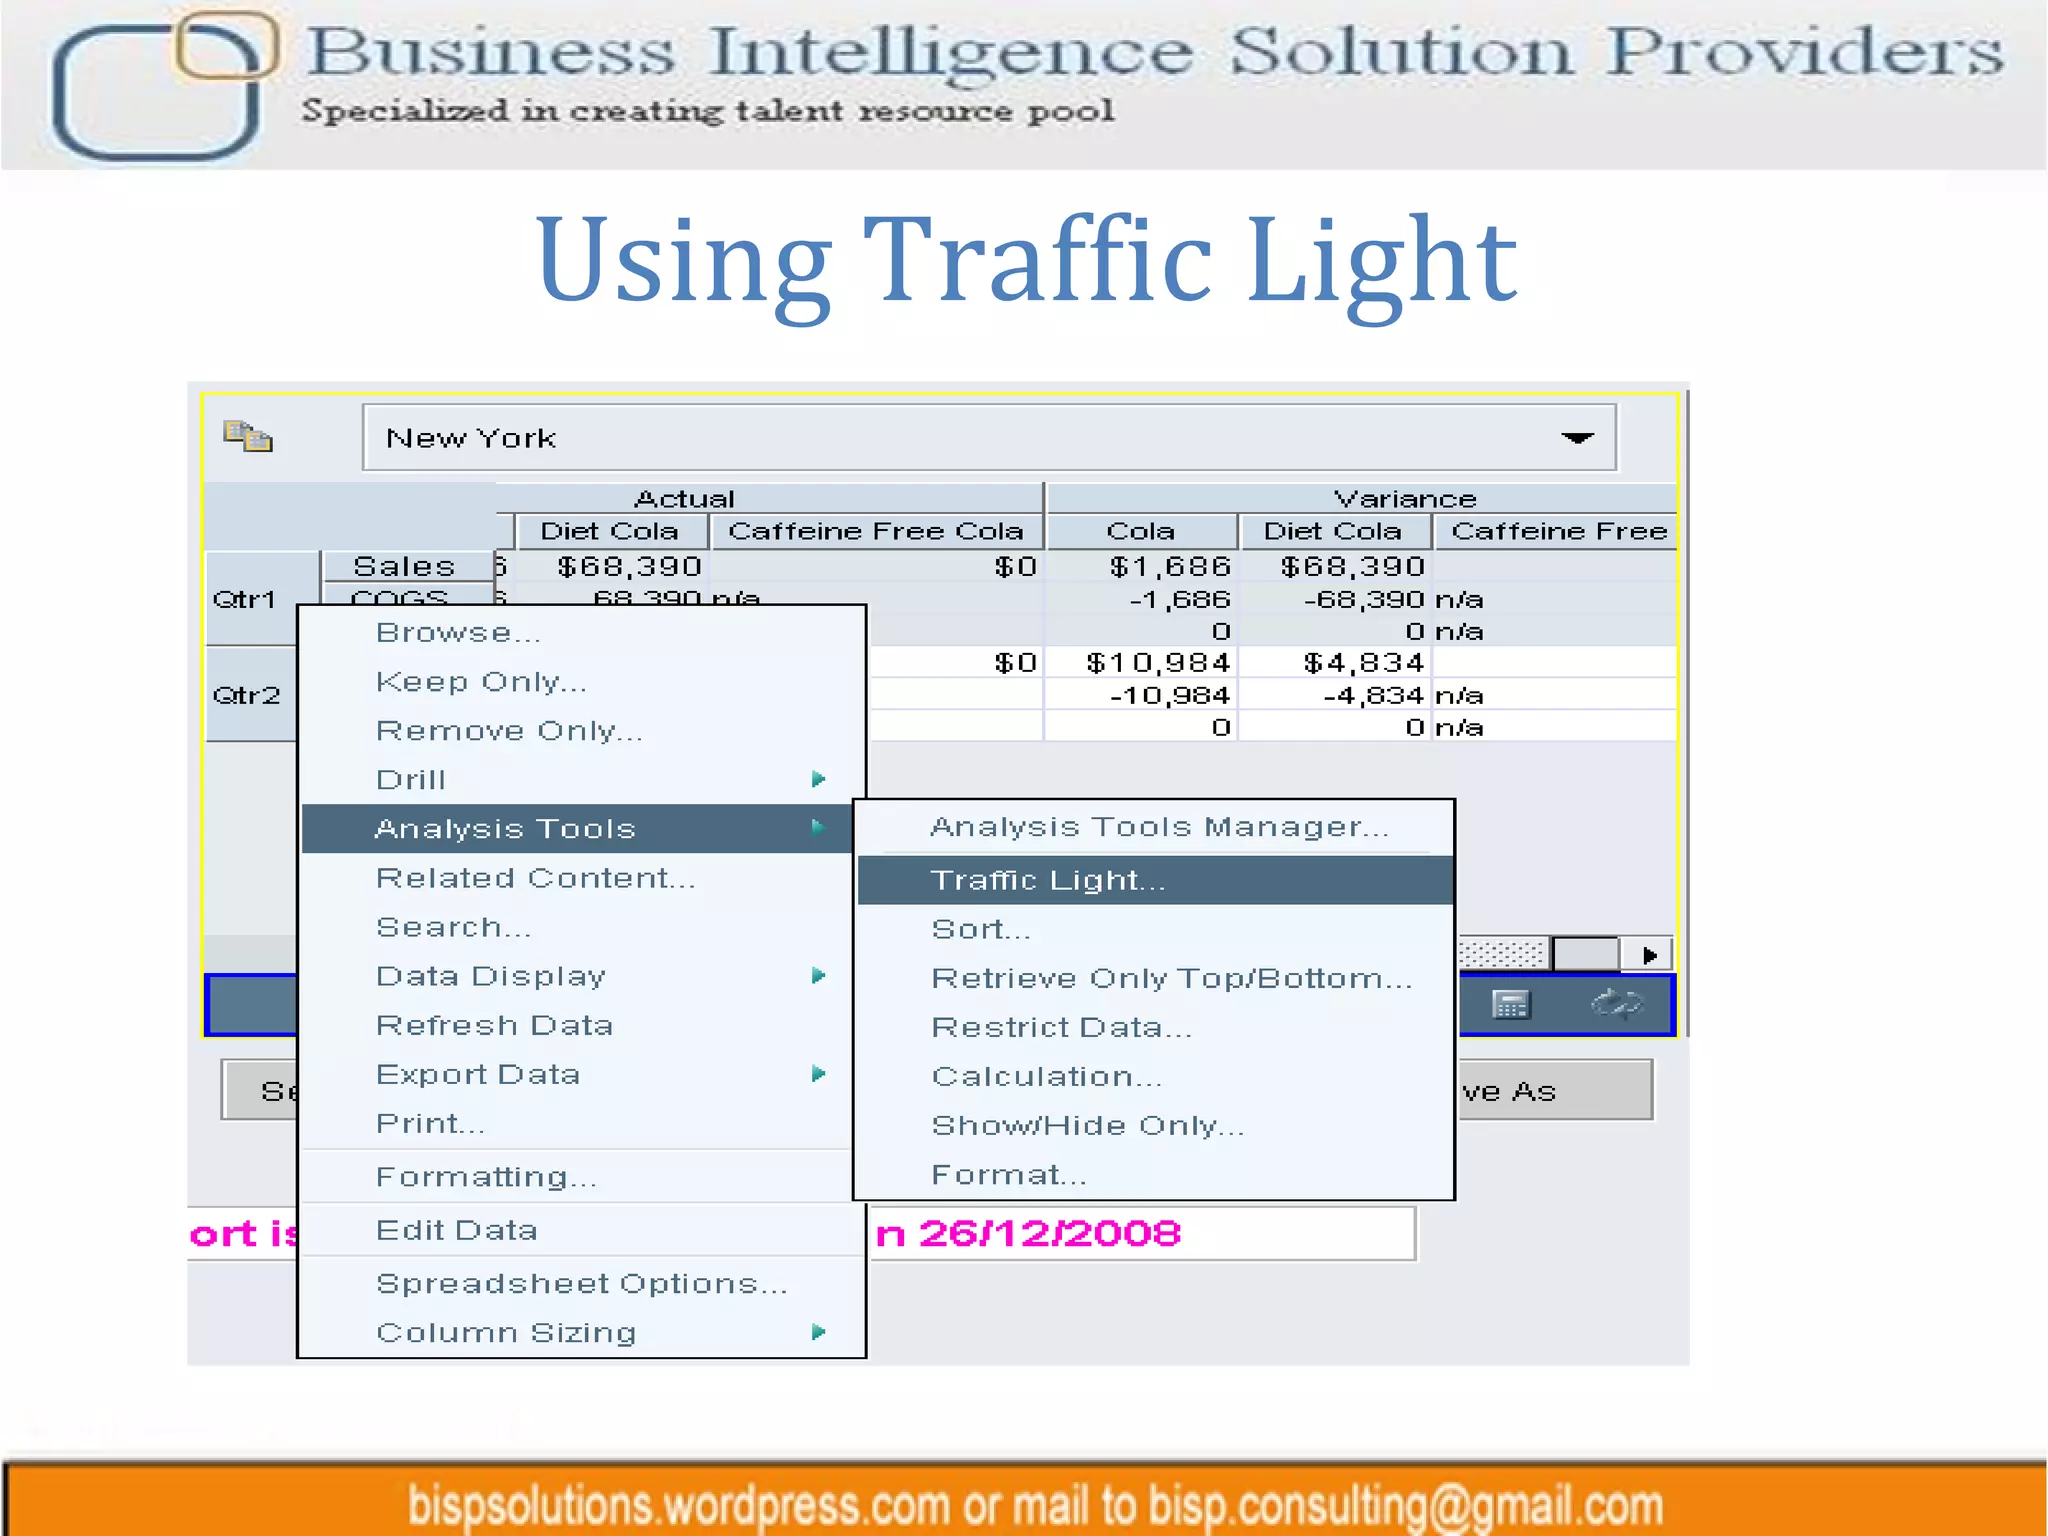
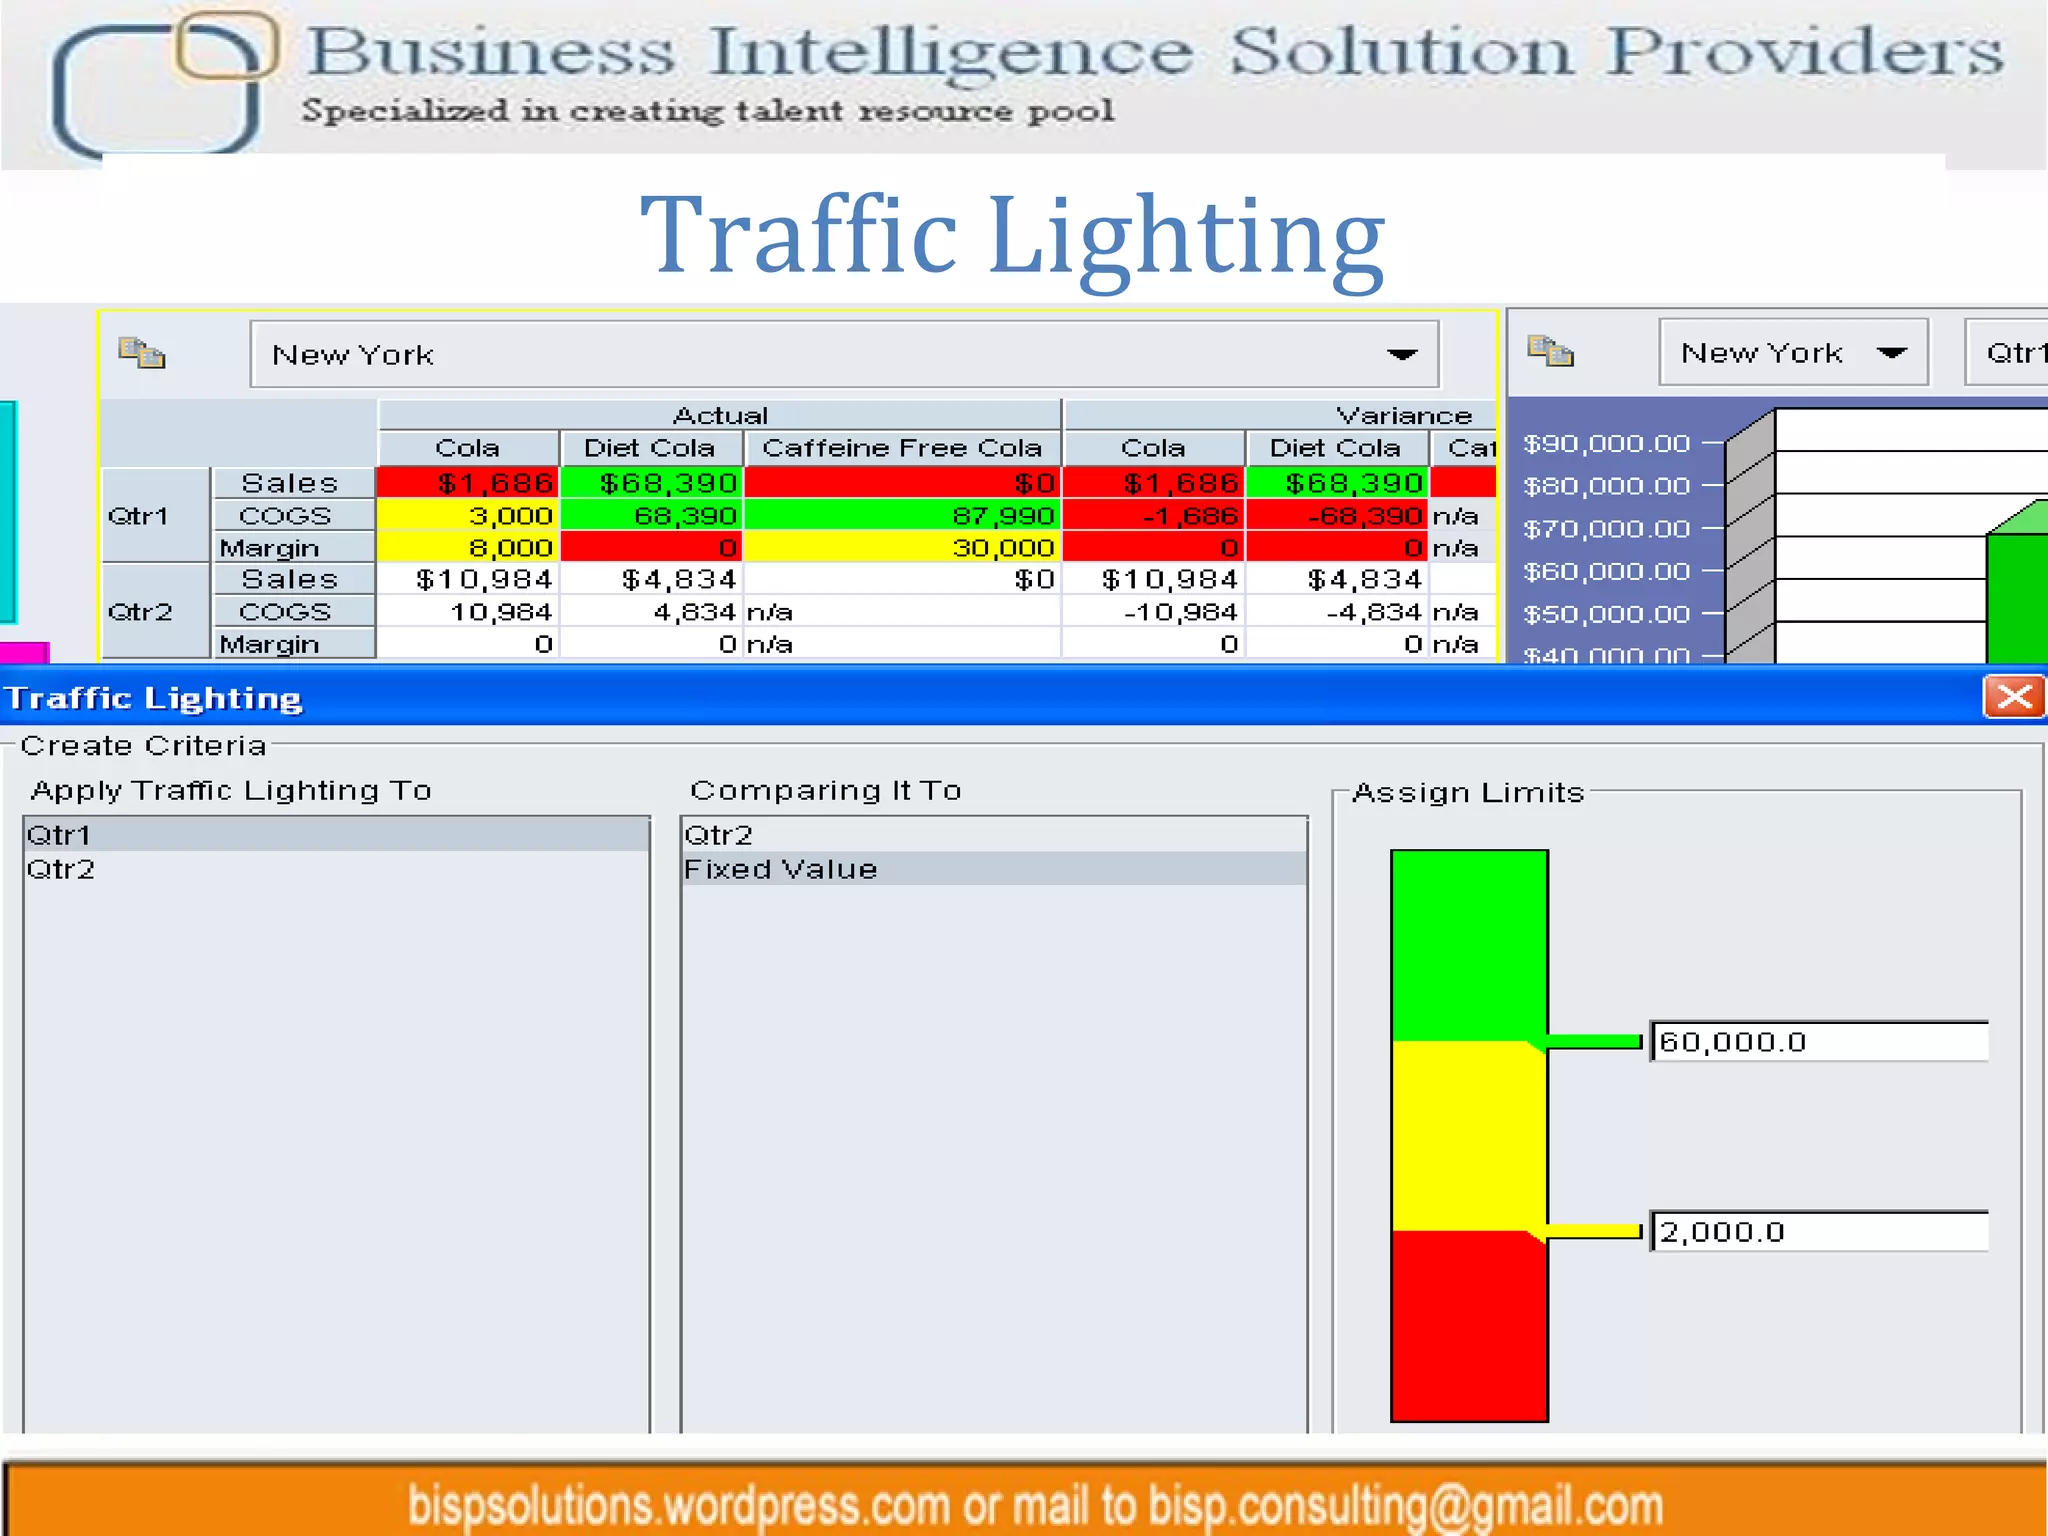
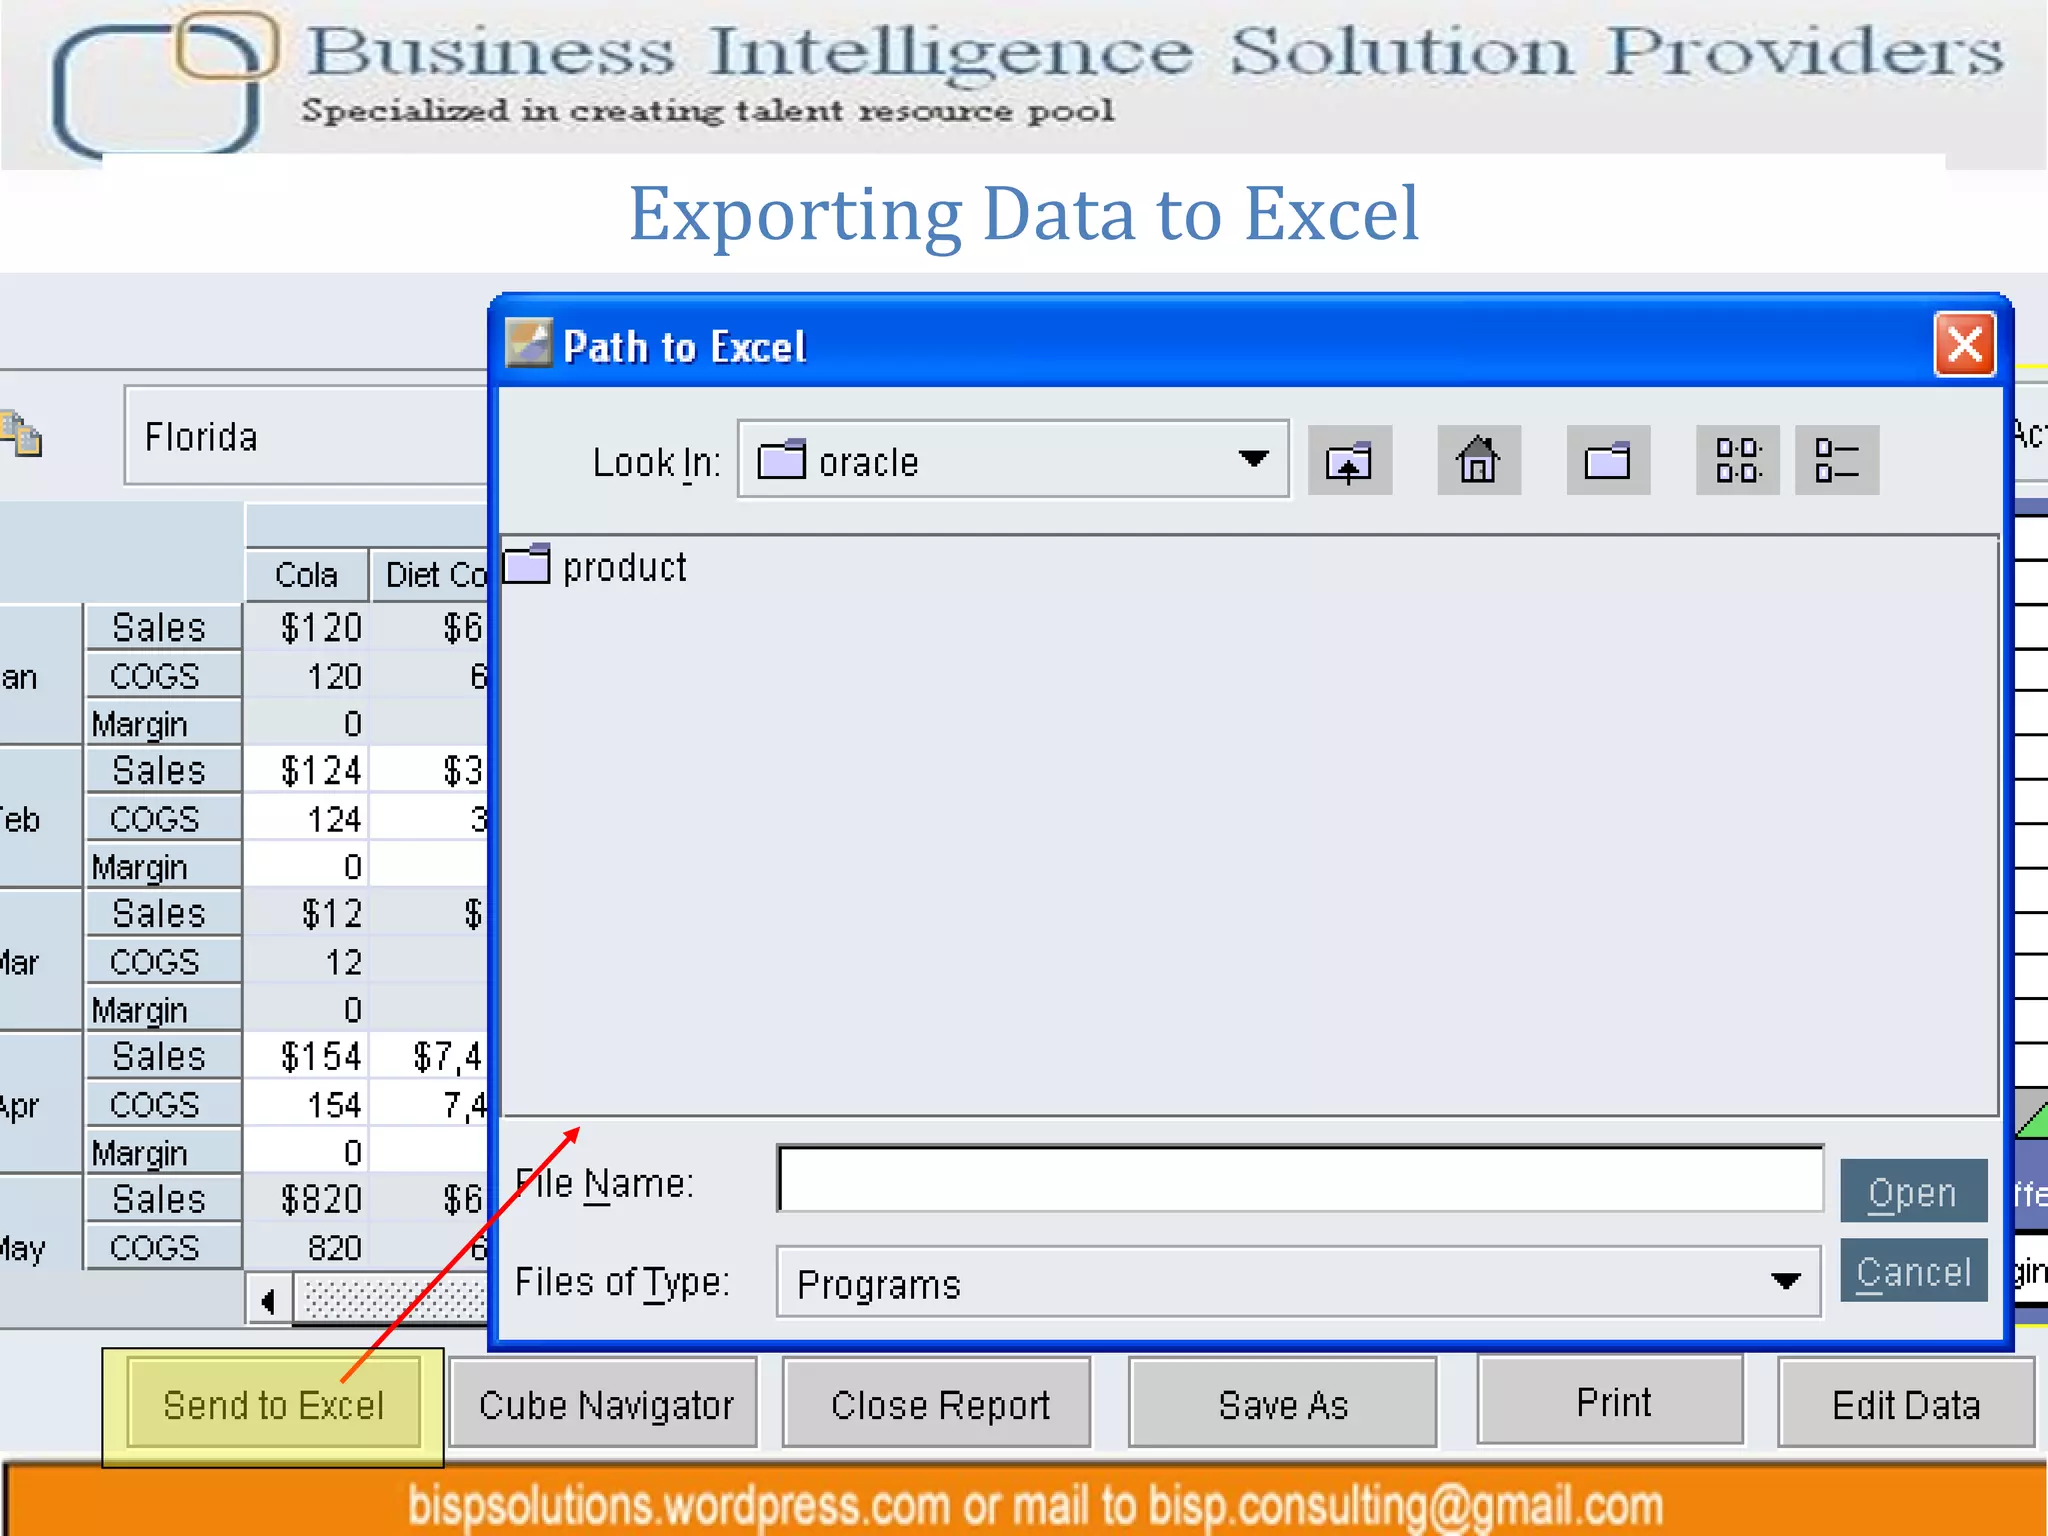
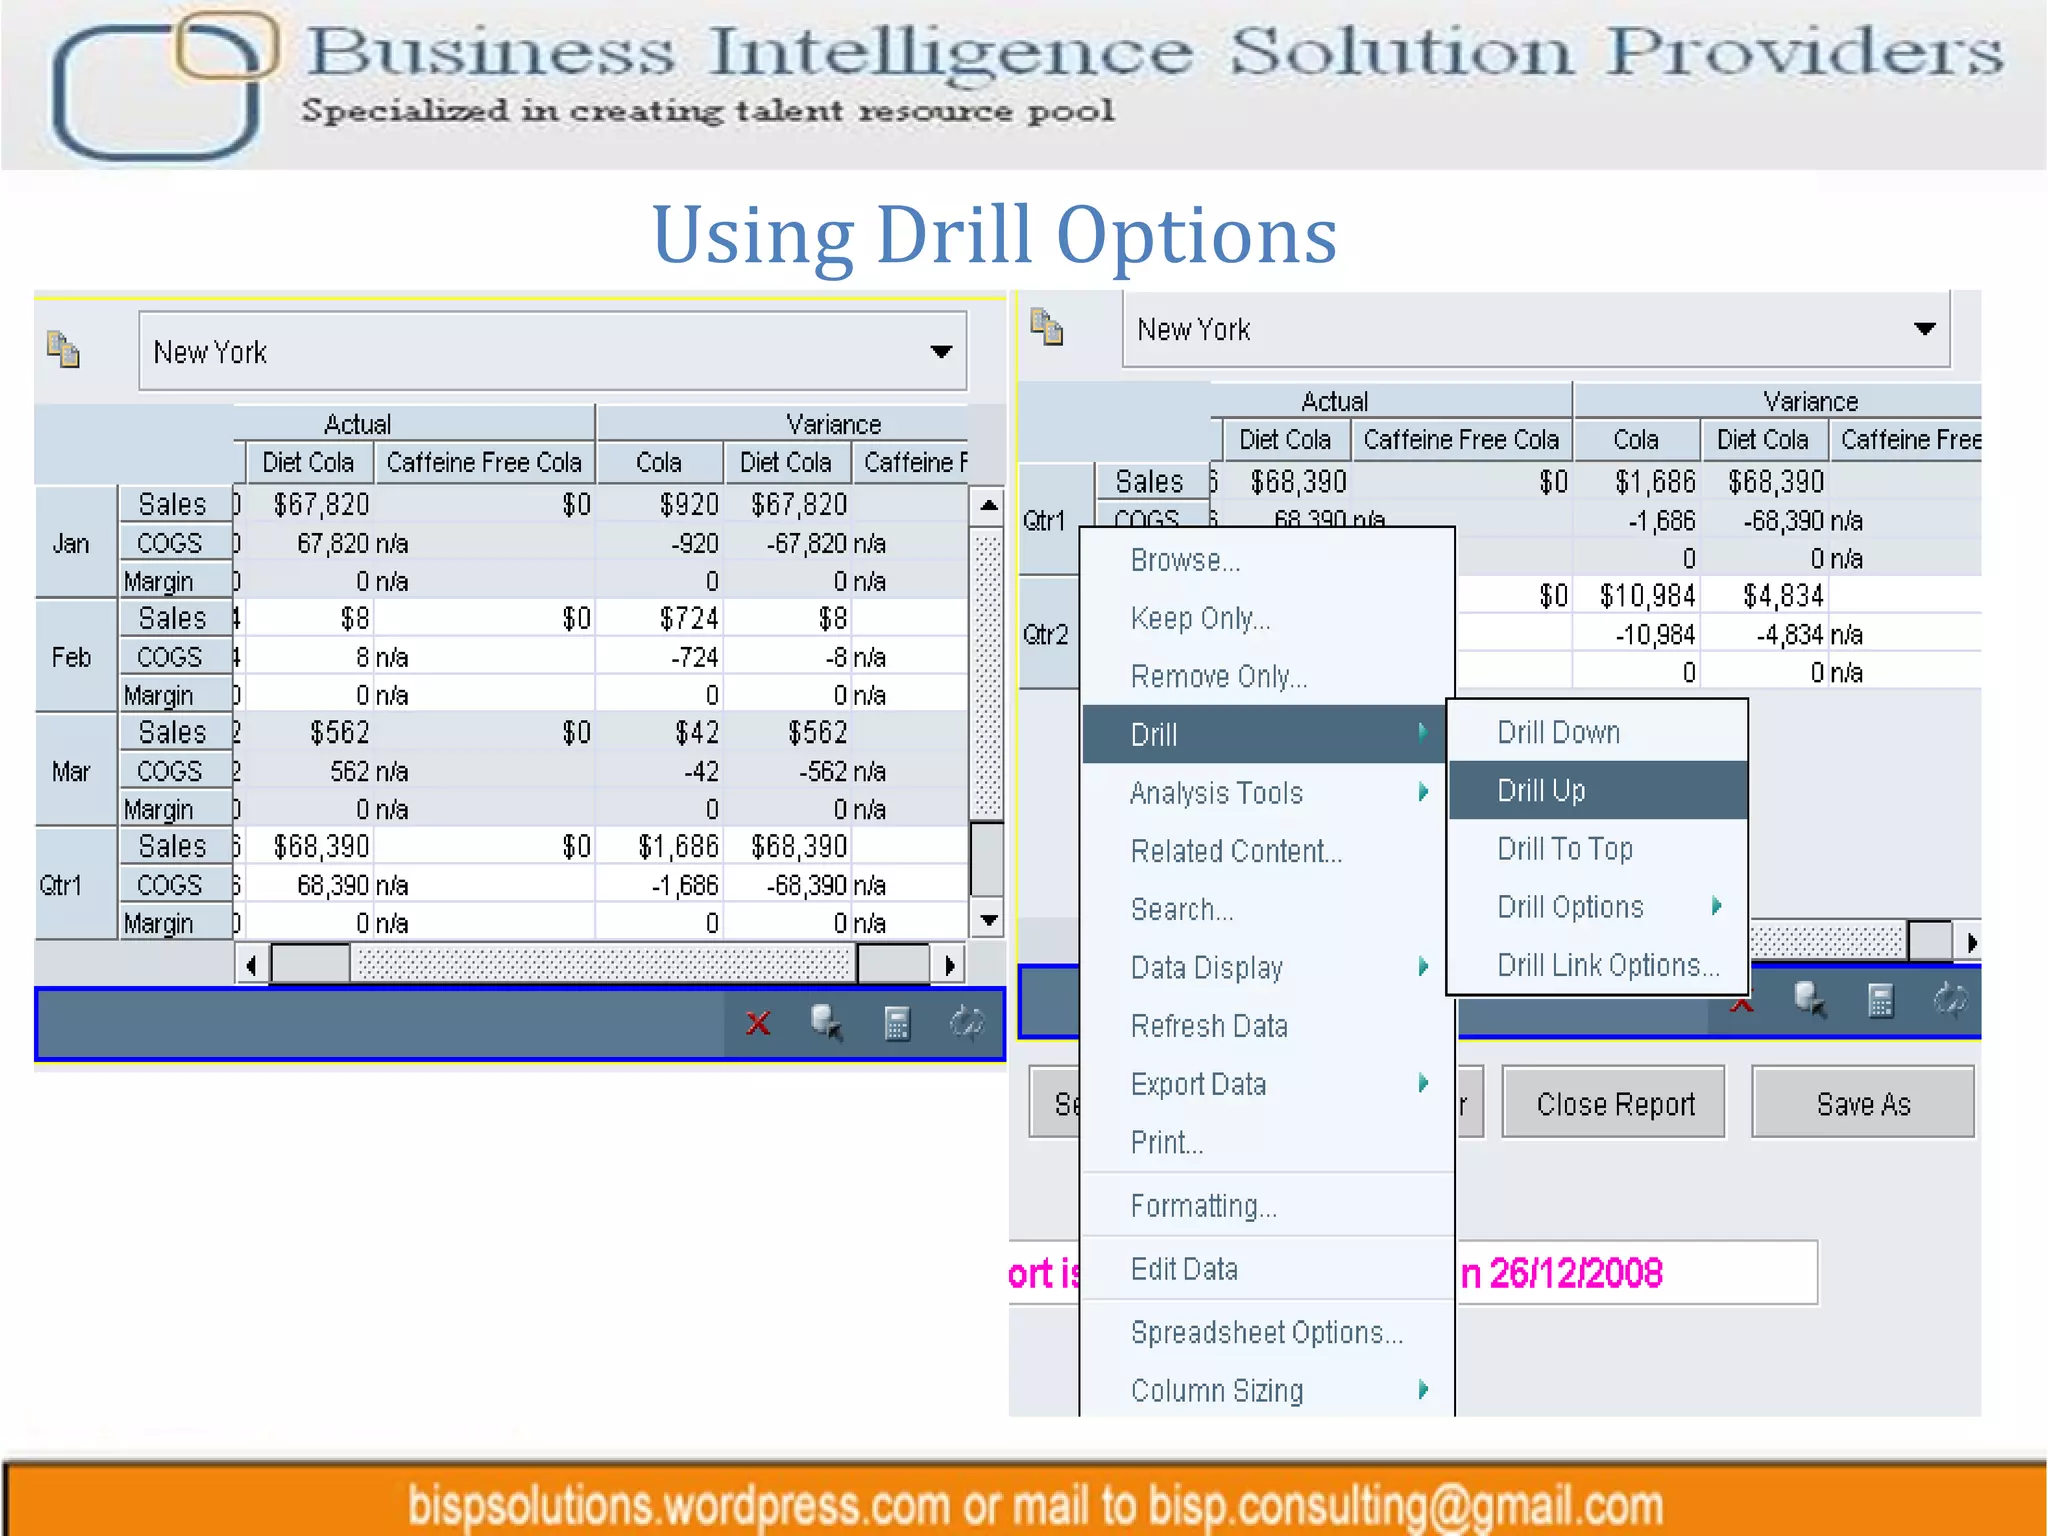
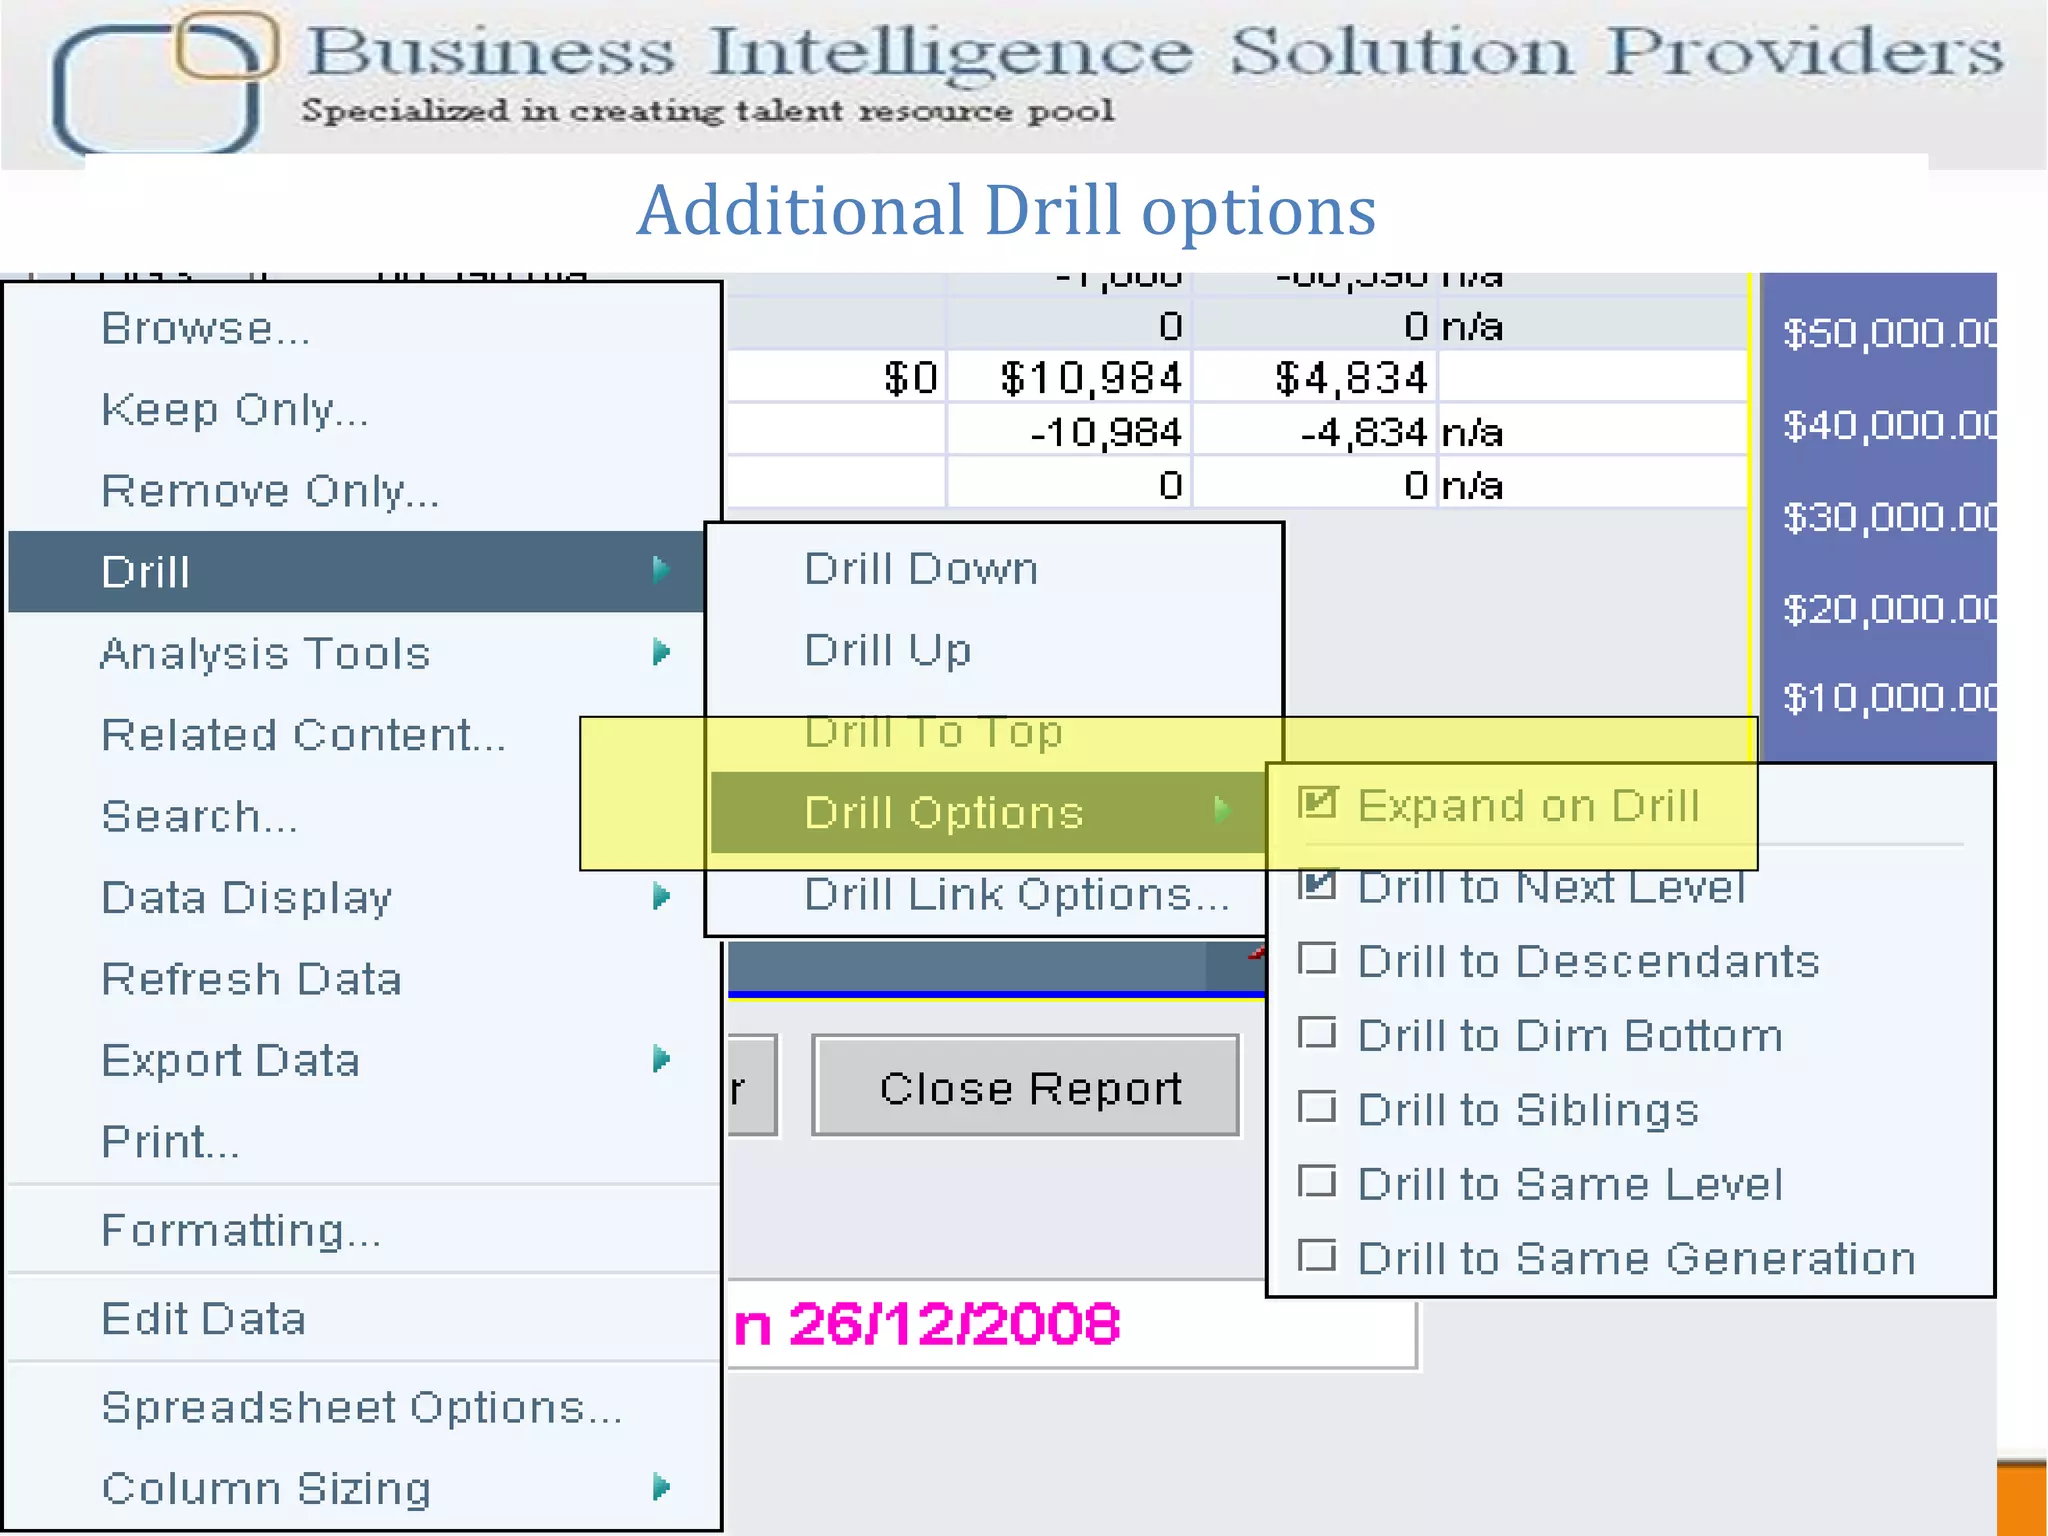
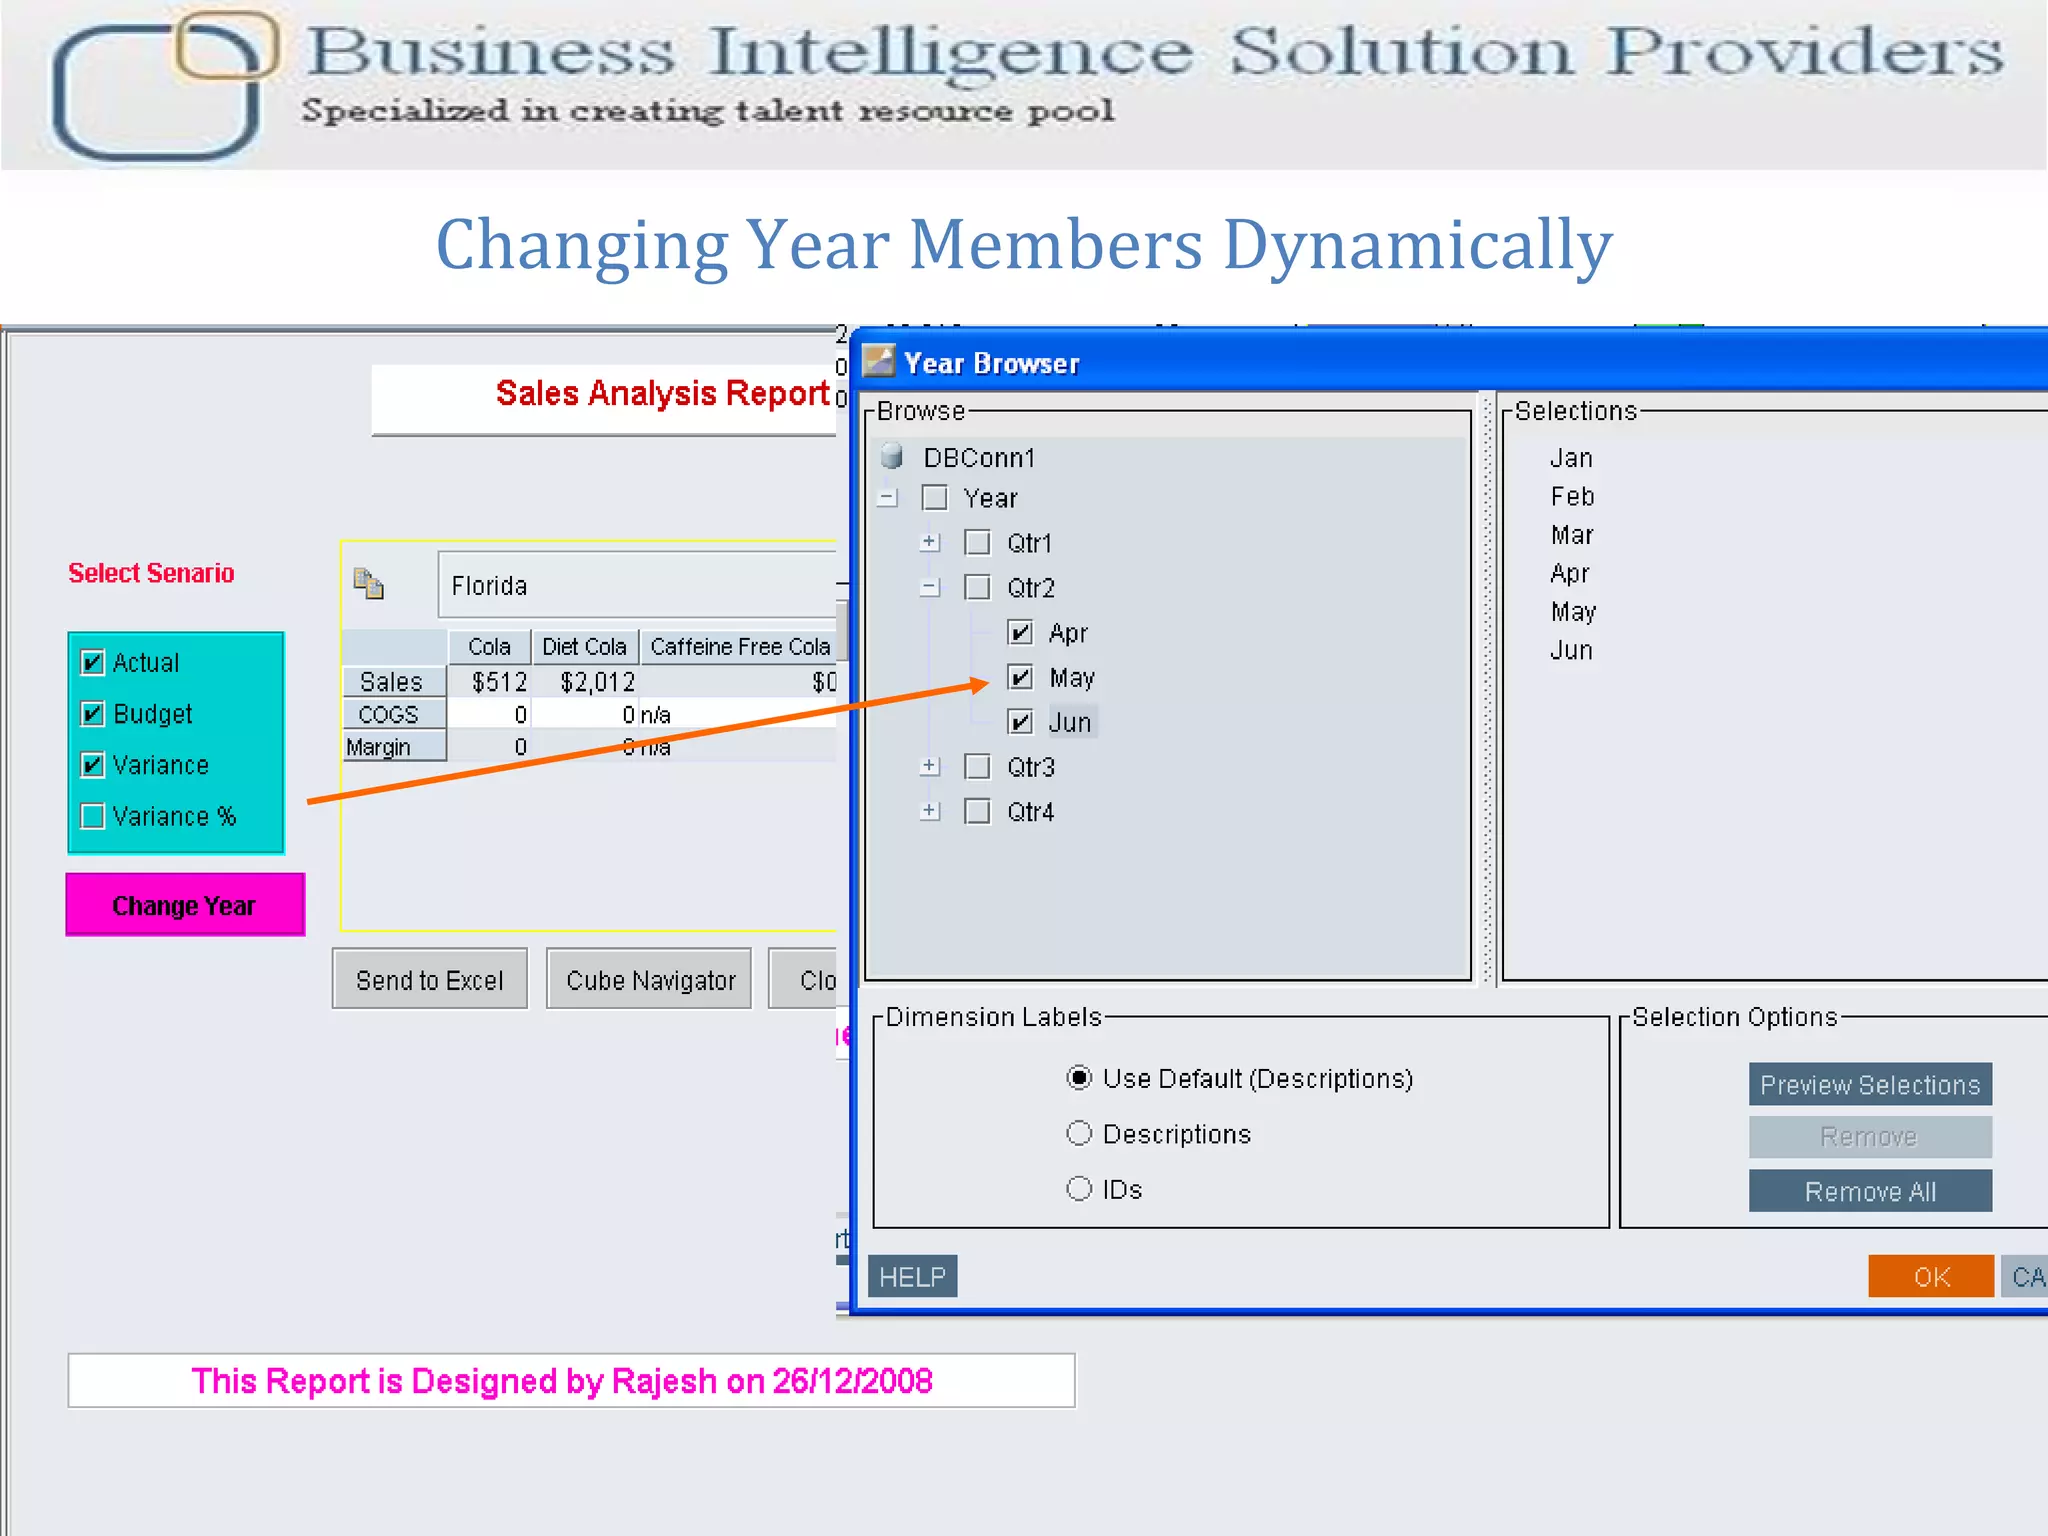
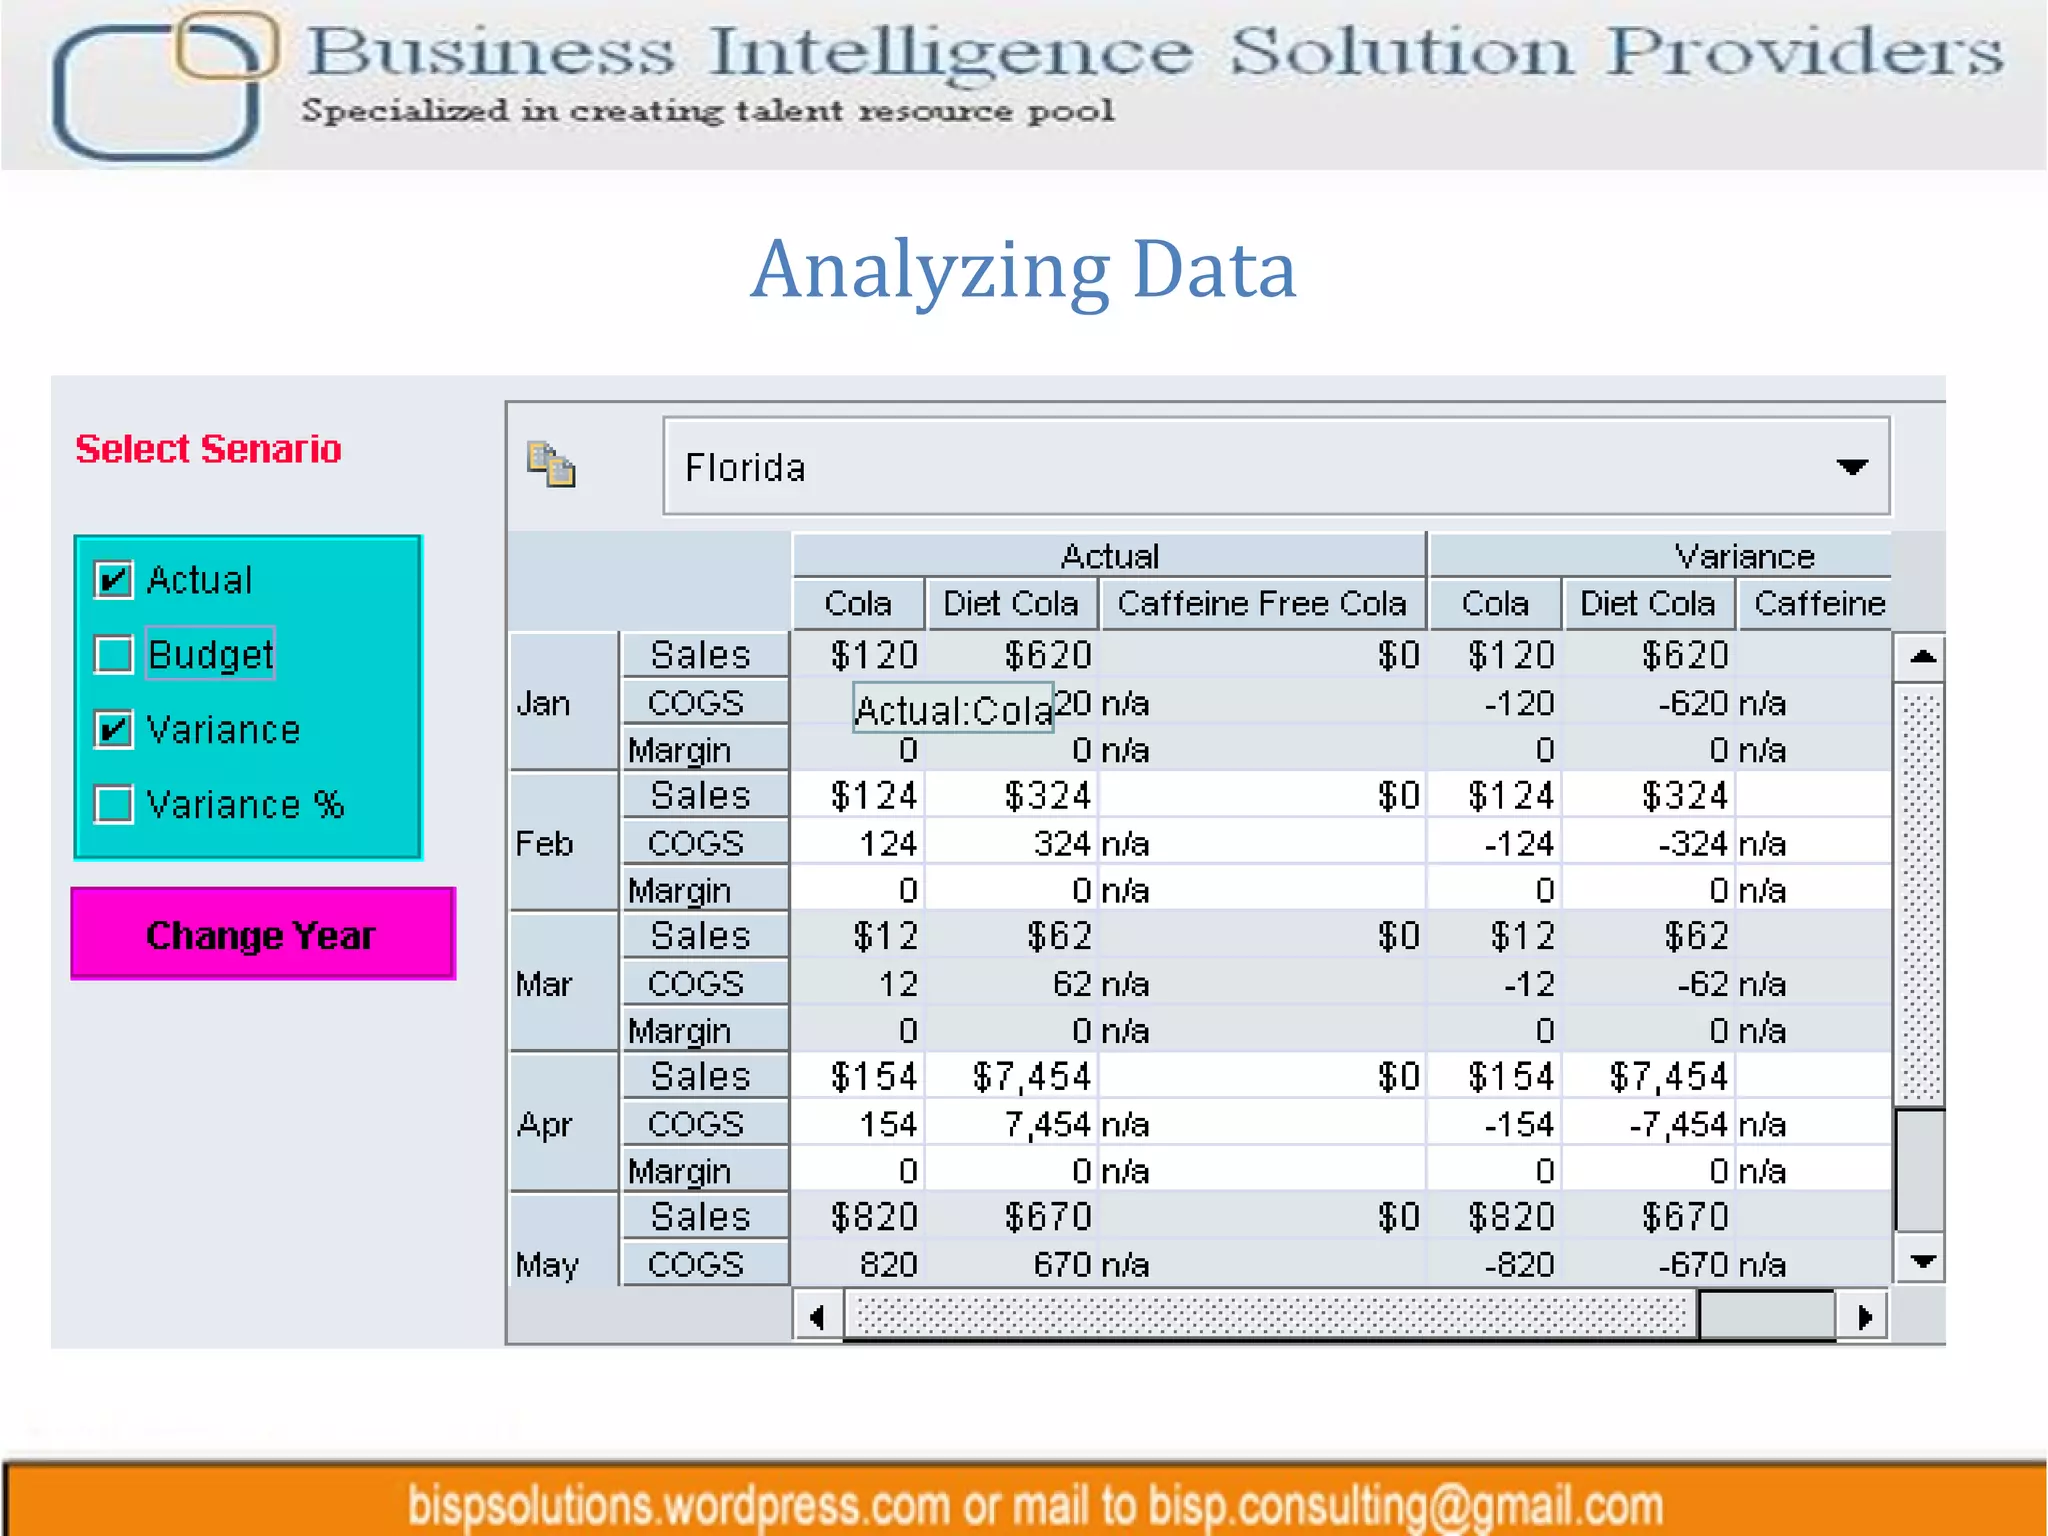
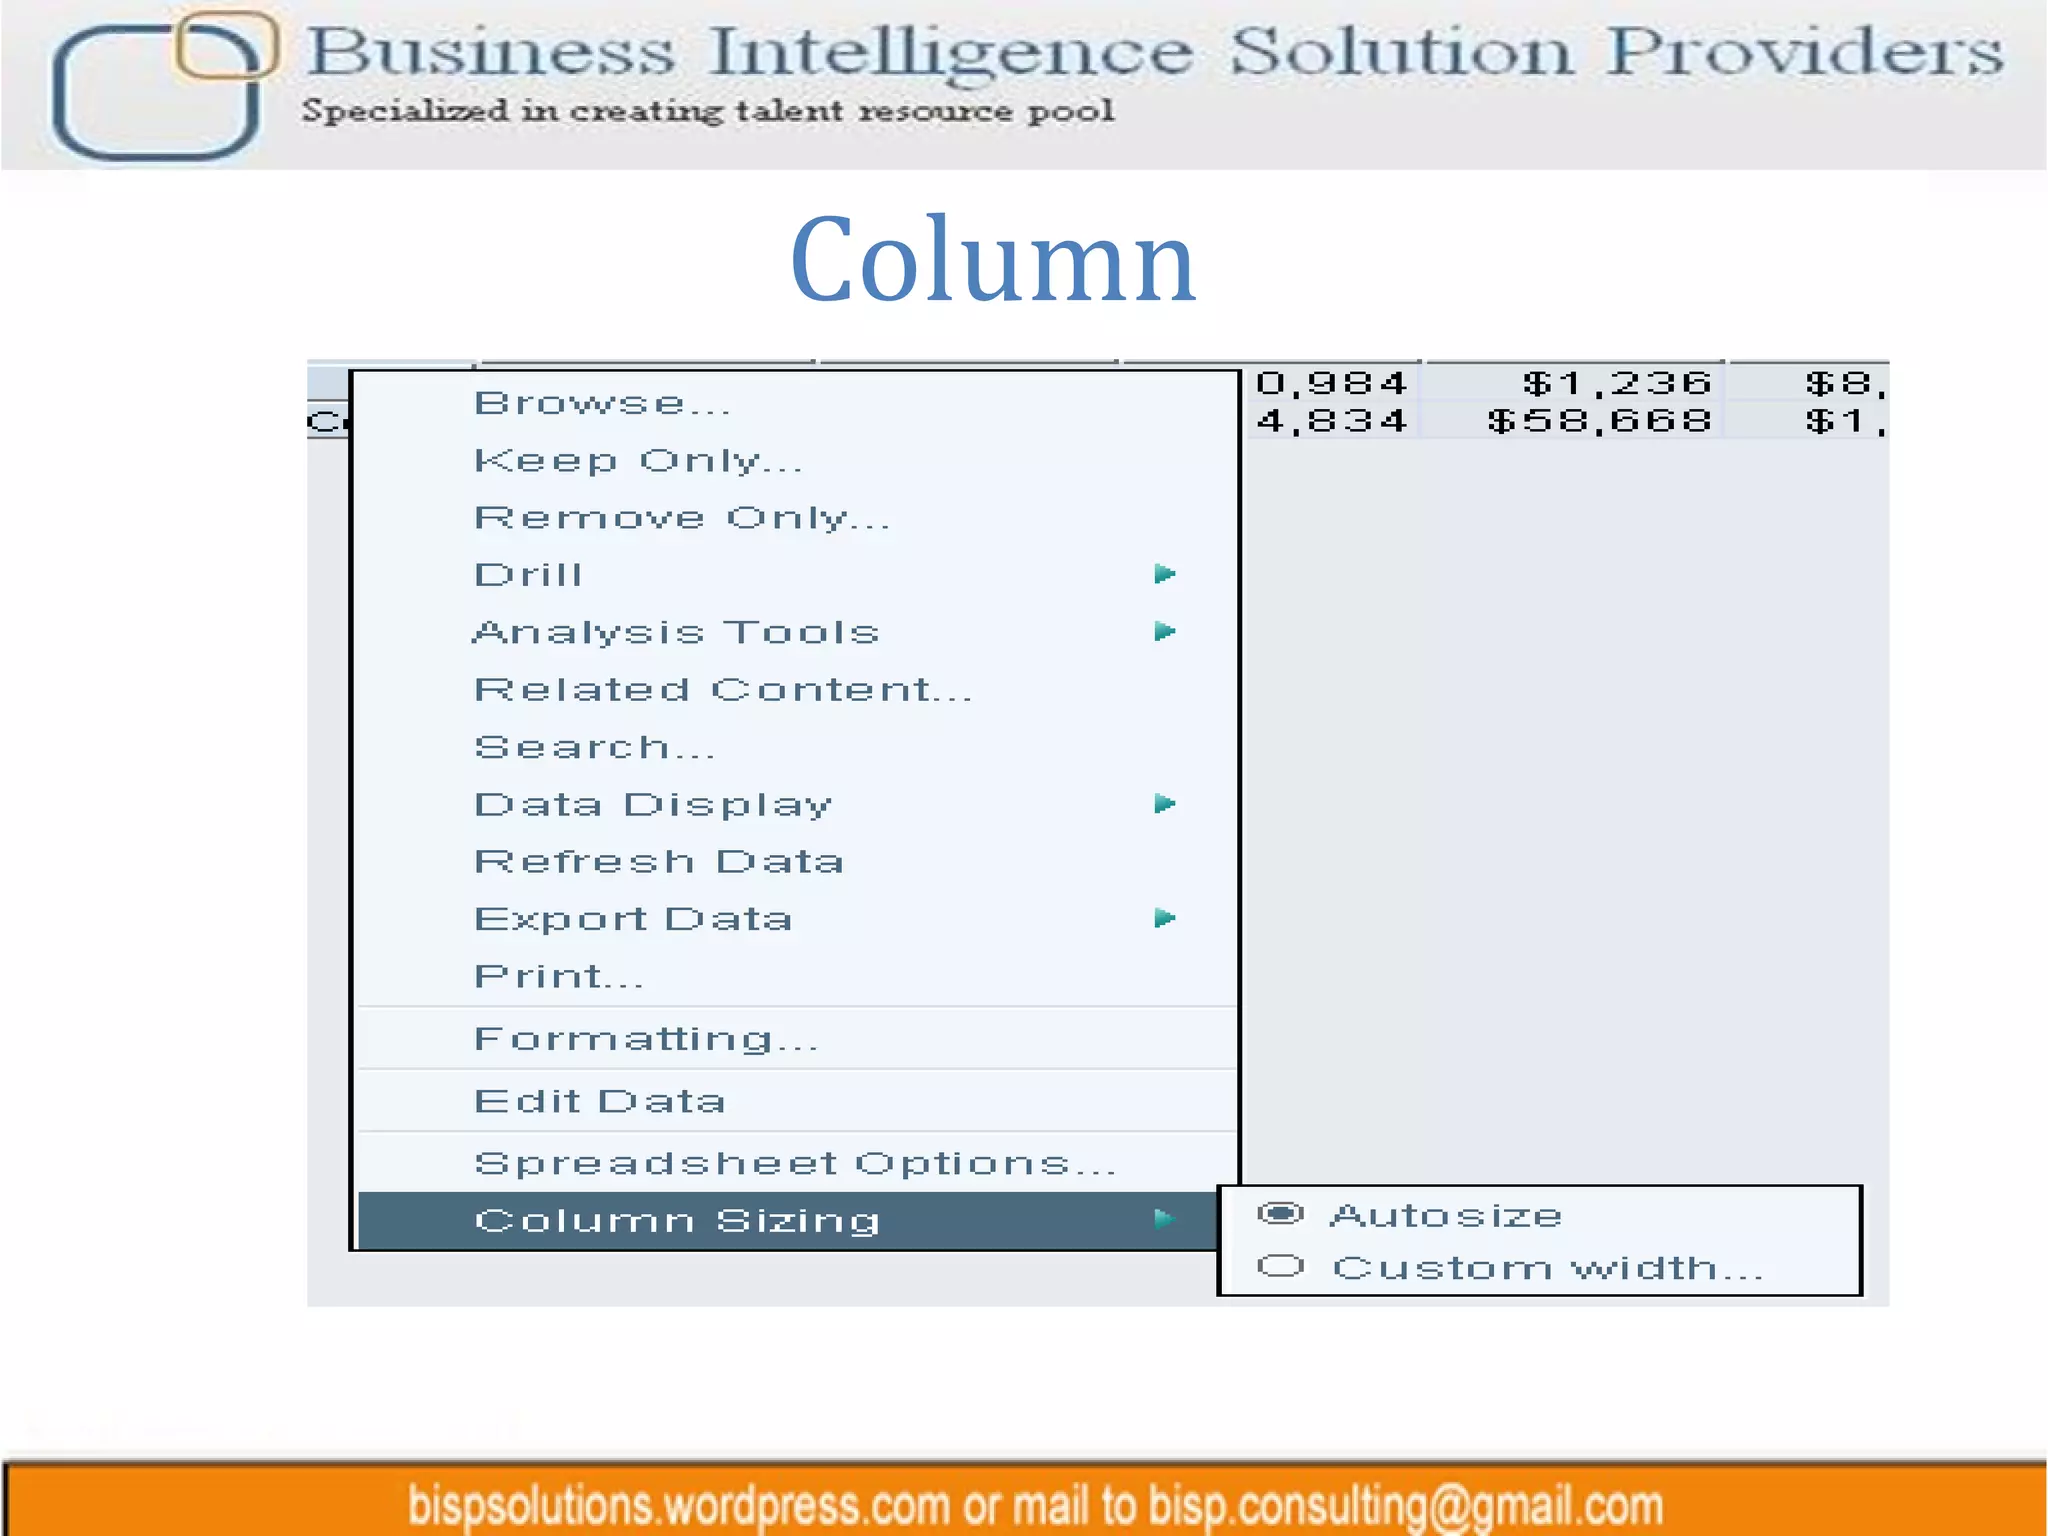
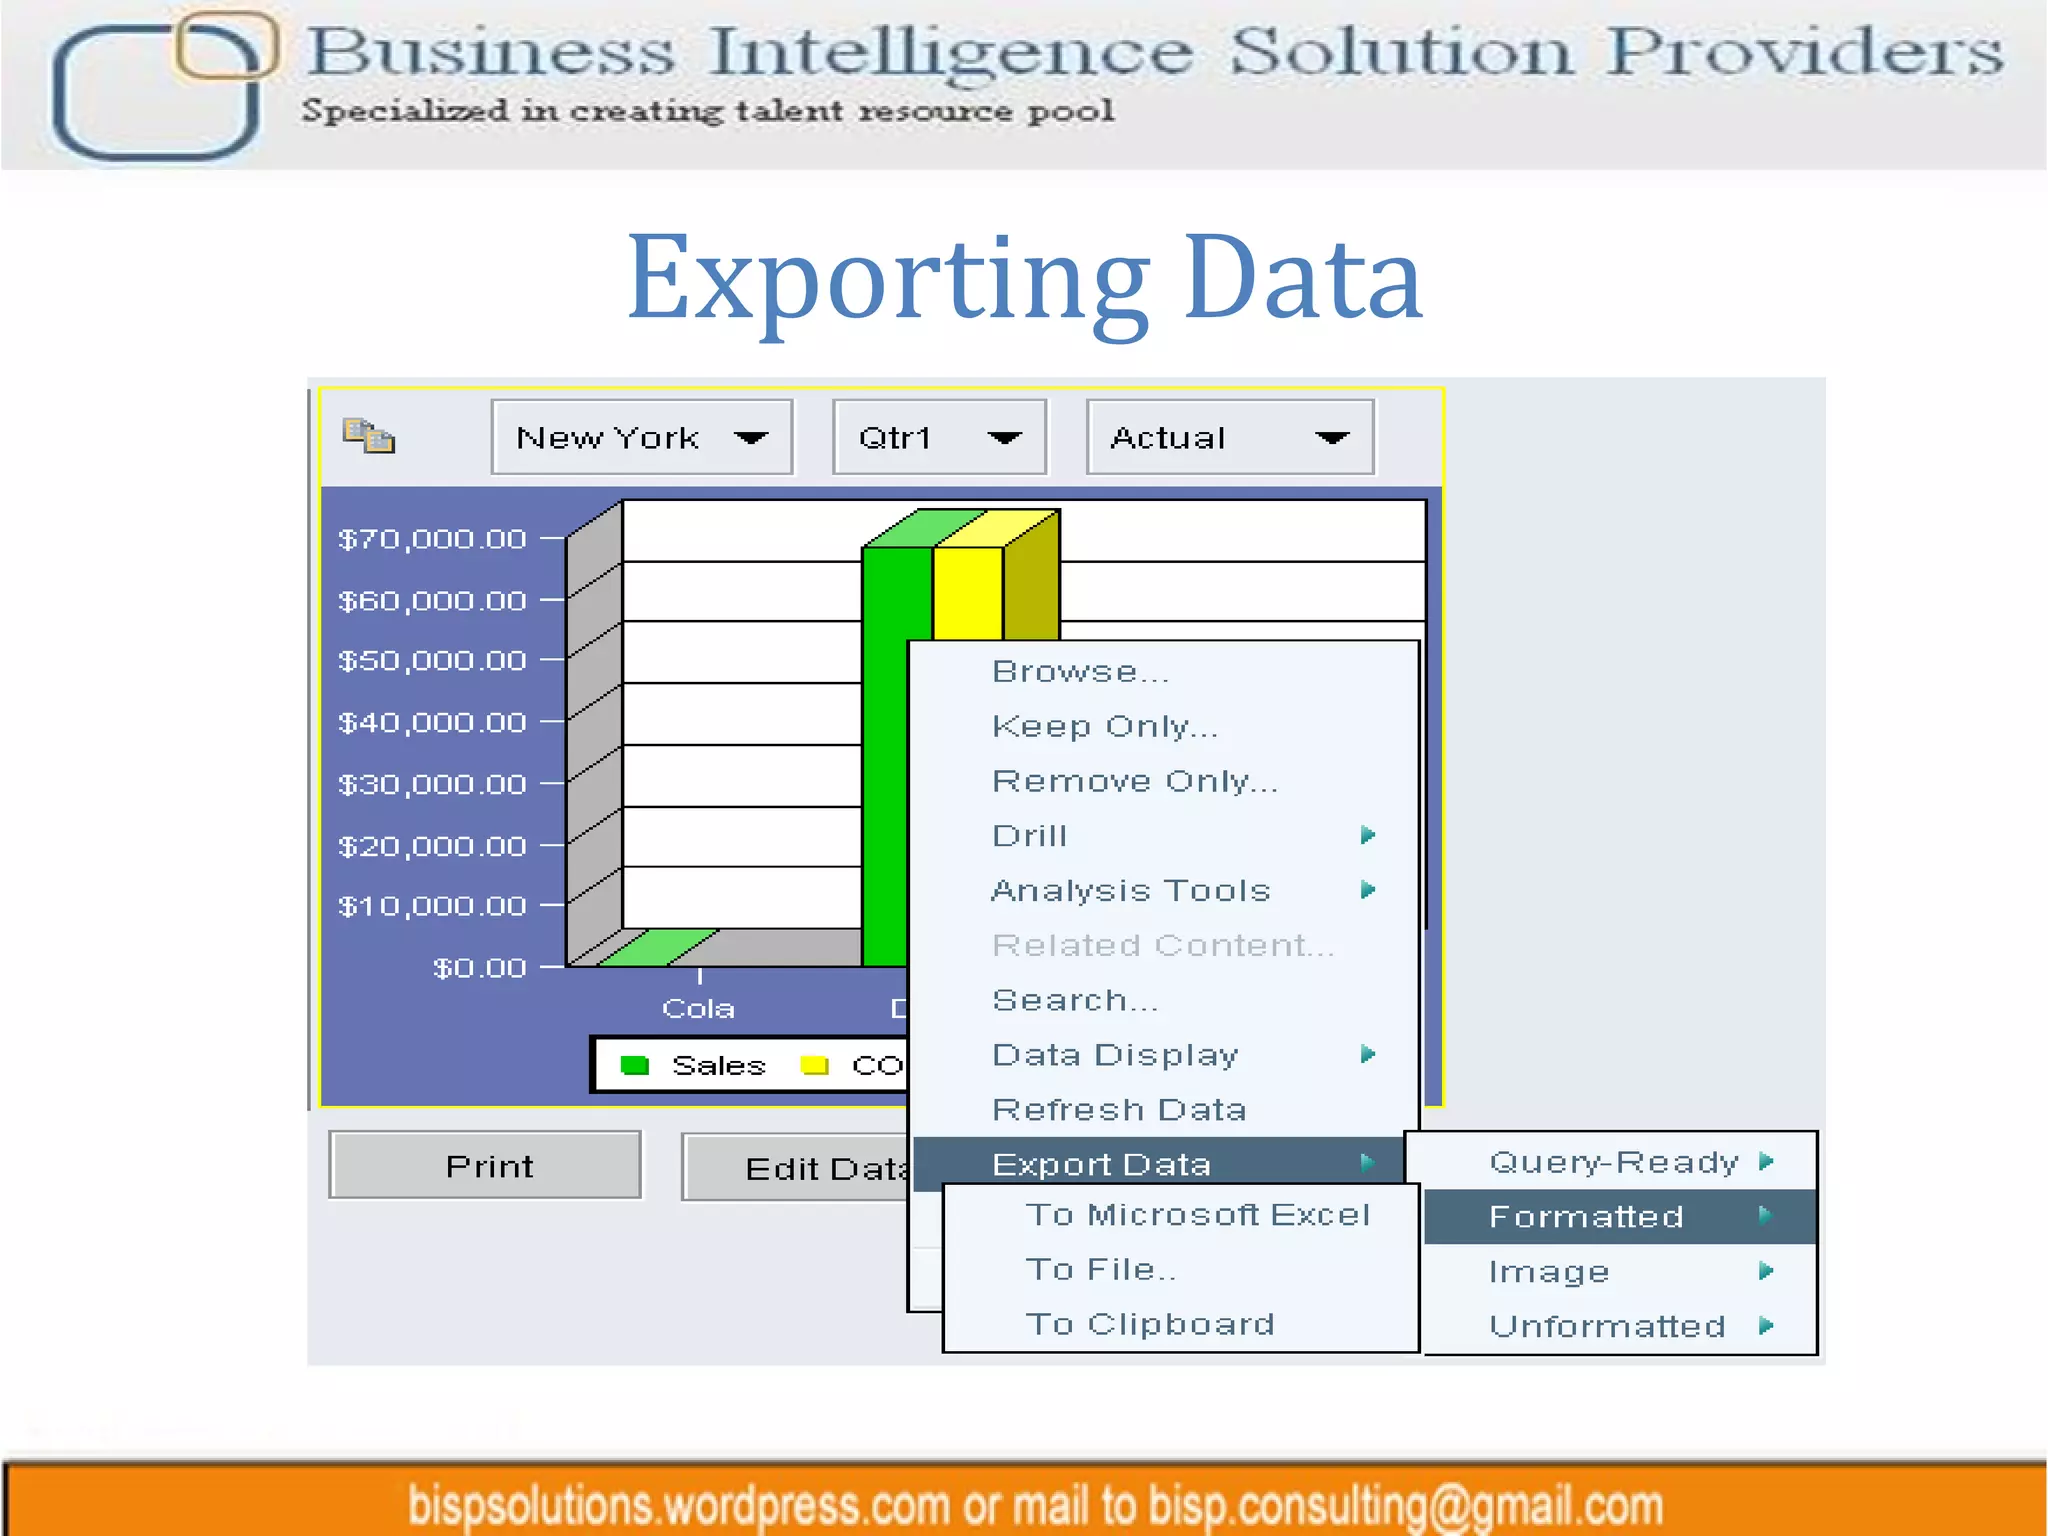
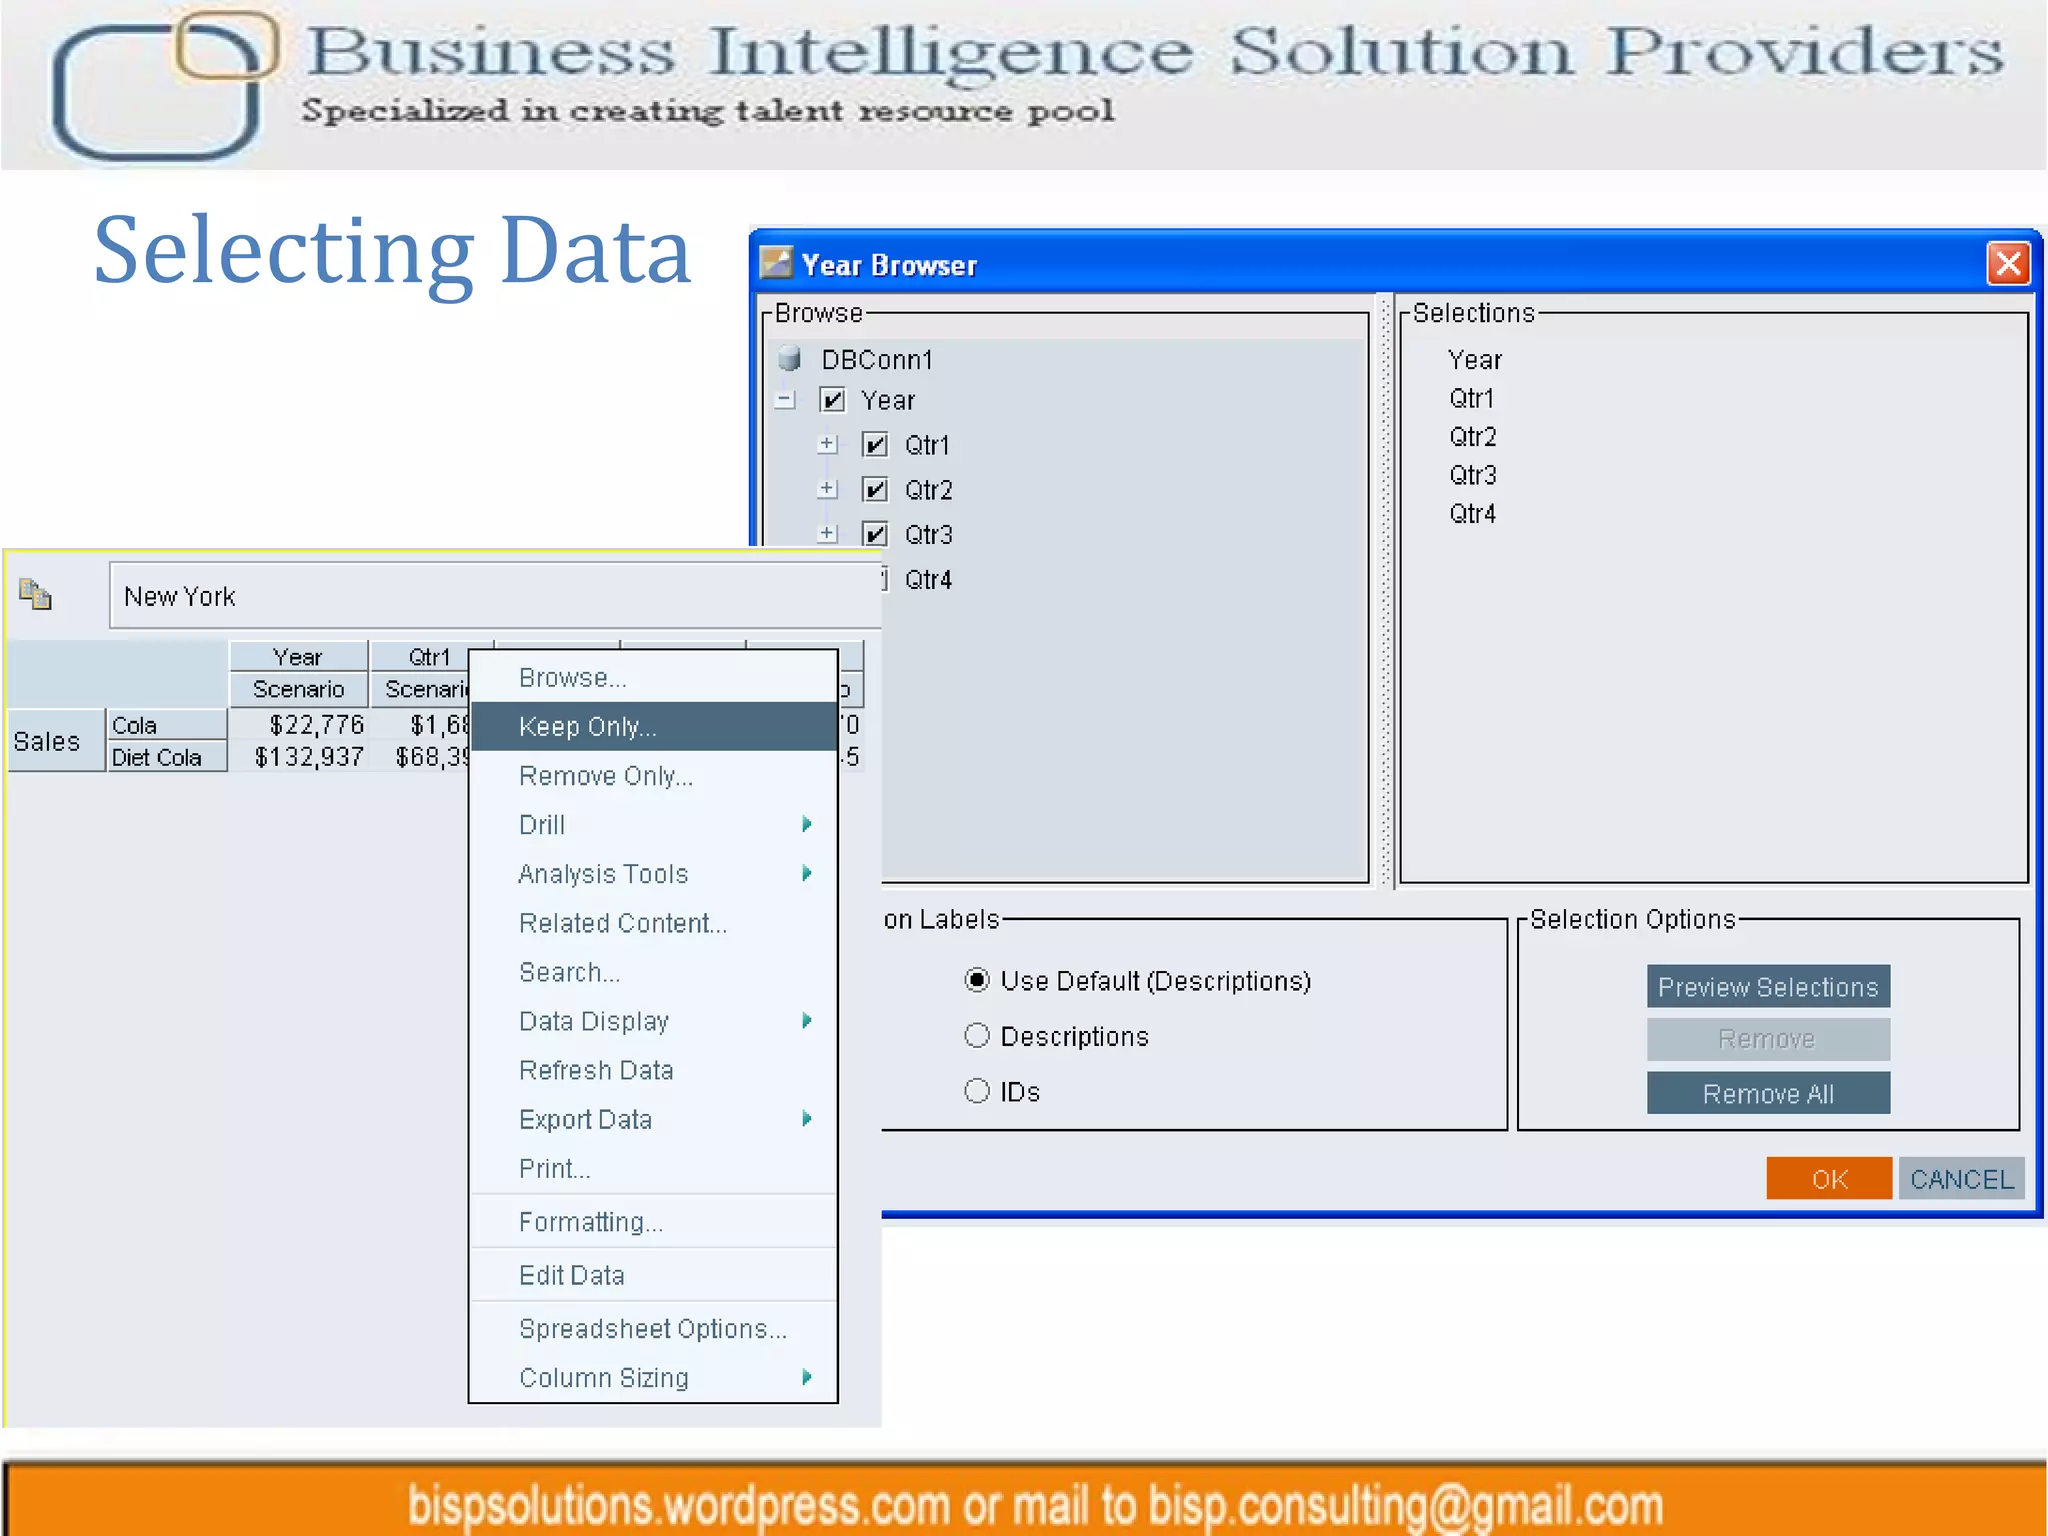
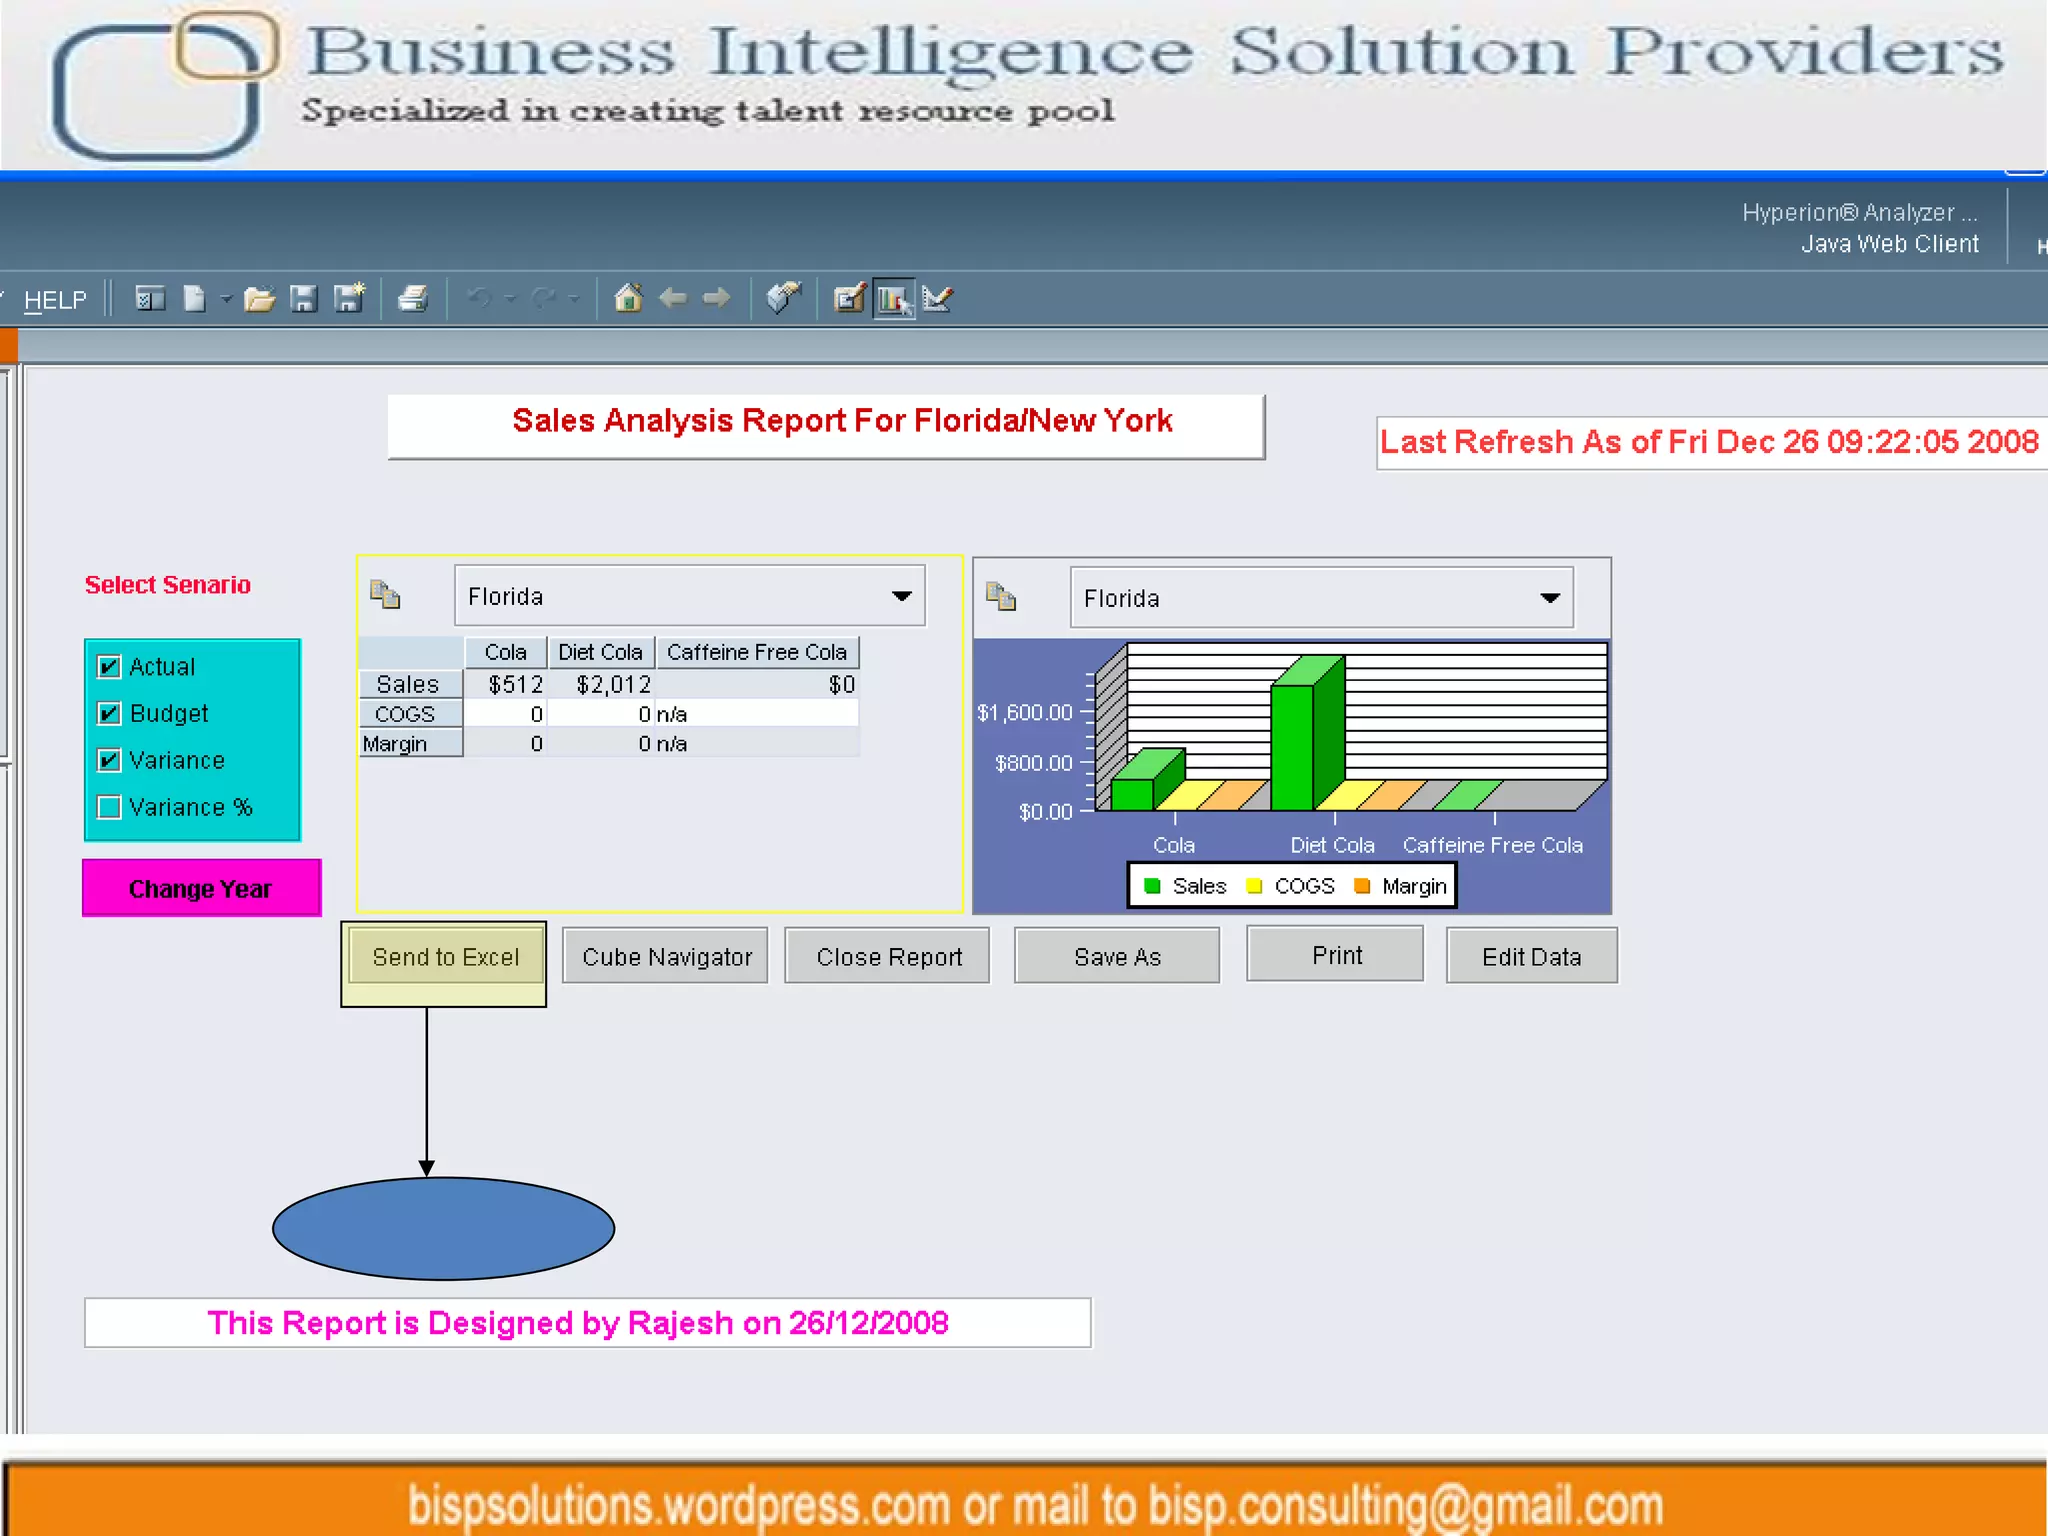


The document discusses various steps for creating database connections, reports, and analyzing data in Hyperion Web Analysis including specifying server and database information, selecting dimensions and members, adding filters, notes, and charts. It also covers functions like sorting, filtering, exporting to Excel, drilling down on data, dynamically changing members, and using traffic lighting to analyze data visually.