Download to read offline

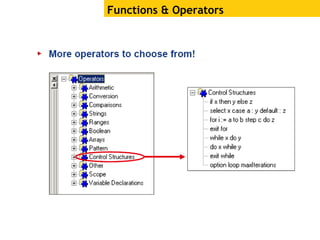
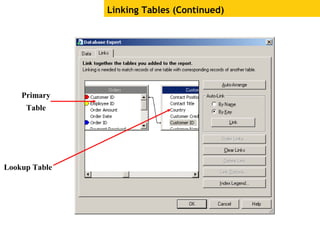

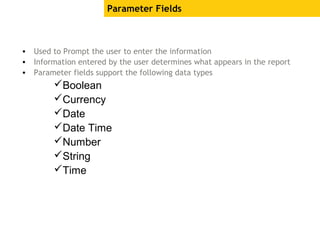
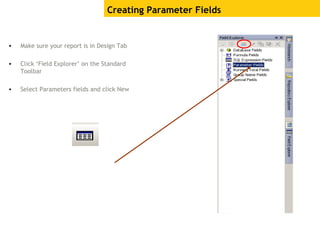
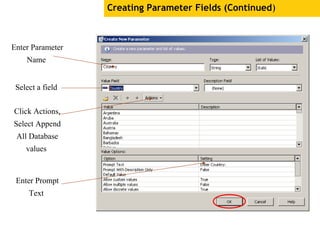
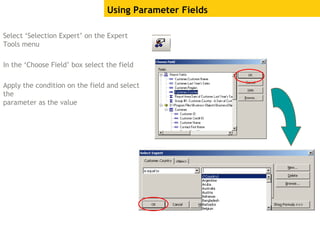


The document provides an overview of using Crystal Reports, detailing its competencies, phases of report creation, and various features. It covers processes like data sourcing, designing, developing, and testing reports, as well as techniques for customizing and exporting the final reports. Additionally, it discusses the use of subreports, parameter fields, and the integration of business objects universes to enhance report functionality.


