Downloaded 44 times


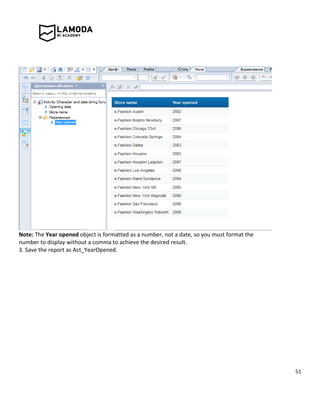
![32
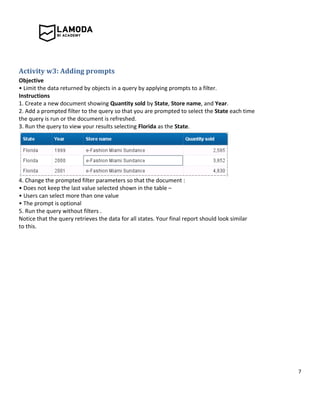
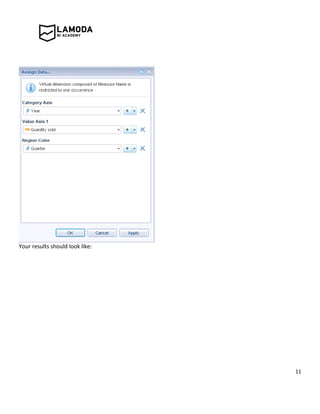
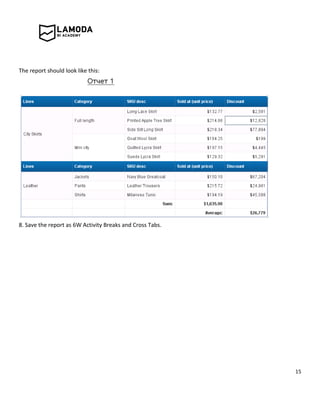
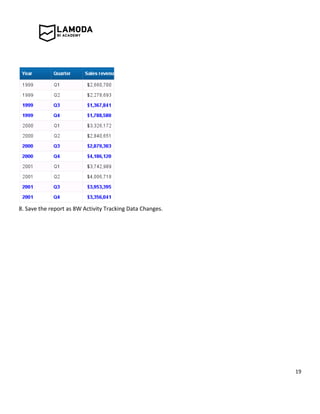
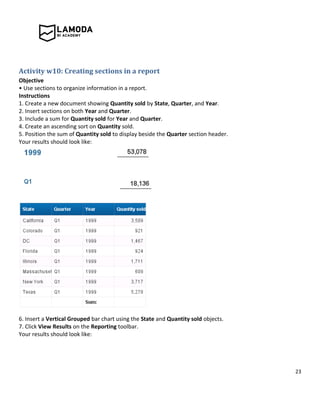
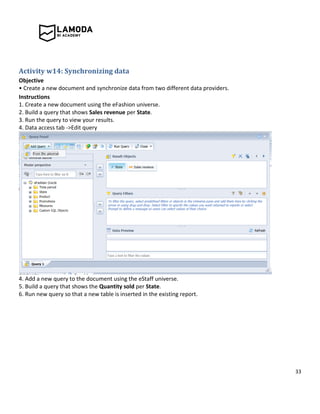
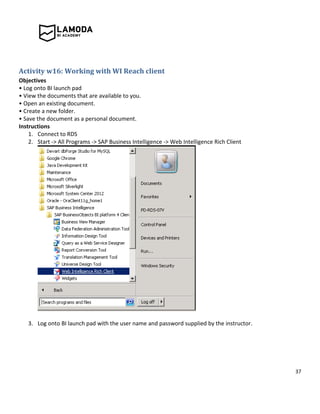
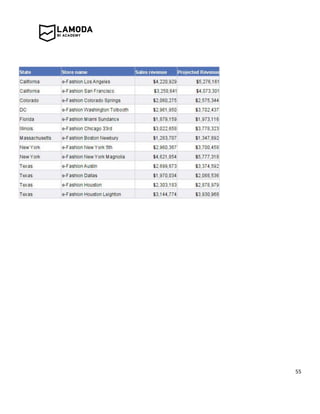
Activity w13: Creating formulas and variables
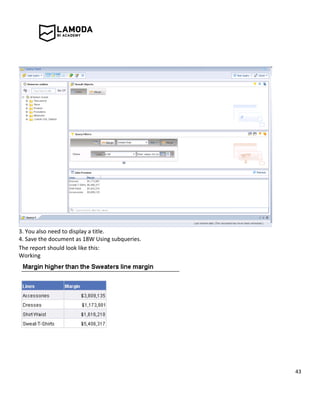
Objective
• Create a new document that includes a table, prompt, ratio formula, variable, and title cell
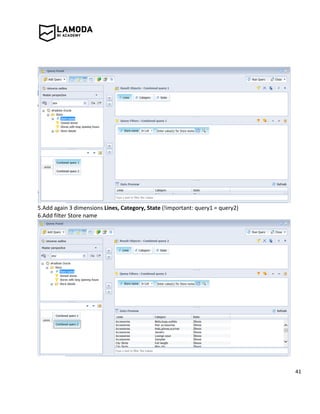
to display the results from the prompt.
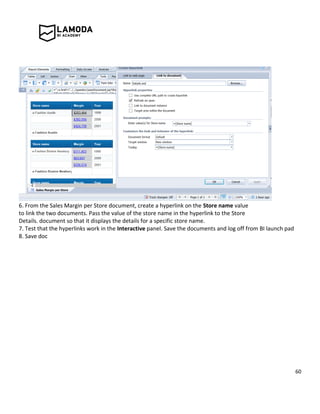
Instructions
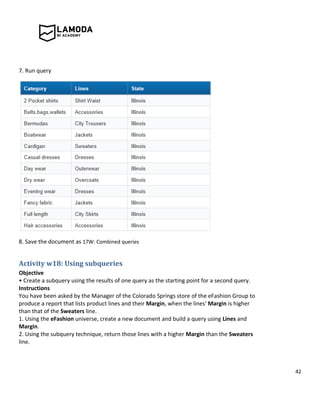
1. Create a new document showing Margin and Quantity sold by Product Lines.
2. Add a column to the table (Table layout -> Insert -> insert column on...)
3. In the new column, create a formula to display the ratio for Margin and Quantity Sold.
(Ratio = Margin/Quantity Sold)
4. Save the formula as a variable.
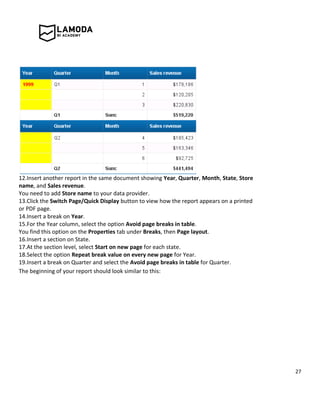
5. Format the column cell header to display Ratio (=NameOF([Ratio]).
6. Create a prompted query filter on State.
7. Insert a formula in the report title cell to show the State chosen from the prompt. Refresh
the document for DC. (="Data for"+":"+" "+[State])
8. Save the document as Activity Formulas.
9. Create a cell showing the name of your document in the report header.
10.Save the document again.](https://image.slidesharecdn.com/businessobjectsactivitieswebintelligence-150606144904-lva1-app6892/85/Business-objects-activities-web-intelligence-32-320.jpg)
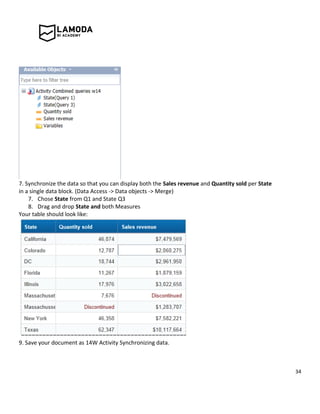
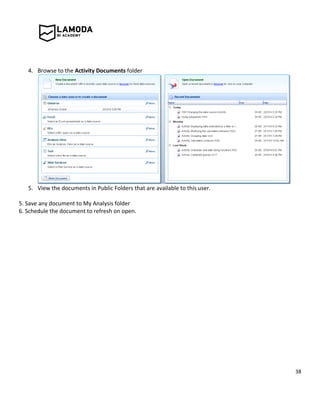

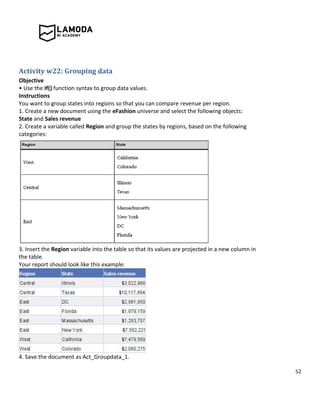
![48
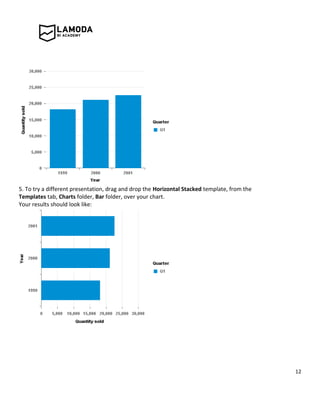
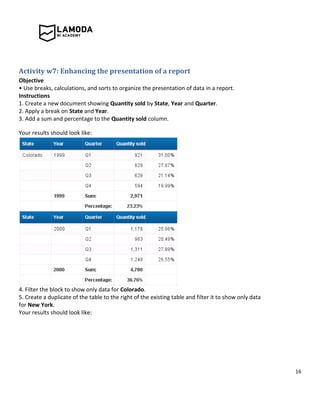
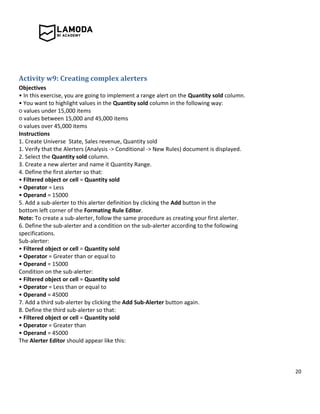
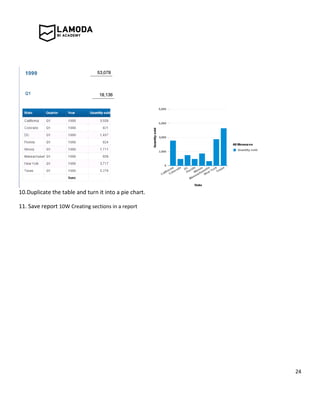
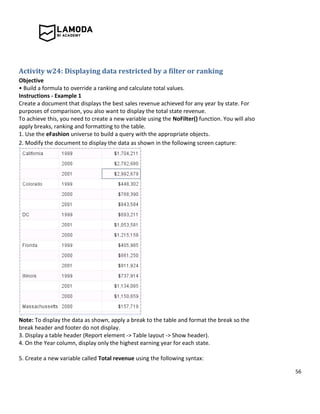
Activity w20: Calculation contexts
Objective
• Use extended syntax to redefine the calculation context of measures in a Web Intelligence
document.
Instructions
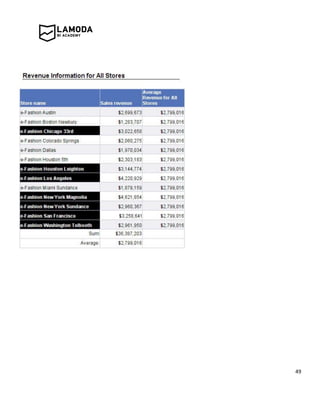
1. Create a document that shows in a single block:
• Sales revenue for each eFashion store.
• Total sales revenue for all stores.
• Average revenue for all stores. (=Average([Sales revenue]) ForAll([Store name])
• Highlight those stores whose revenue was above the average revenue for all stores.
2. Change the name of the report to Revenue Information for All Stores.
3. Save the document as Act_Calculationcontext.
Your document should look like this example:](https://image.slidesharecdn.com/businessobjectsactivitieswebintelligence-150606144904-lva1-app6892/85/Business-objects-activities-web-intelligence-48-320.jpg)
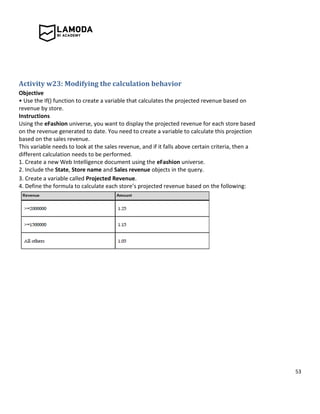
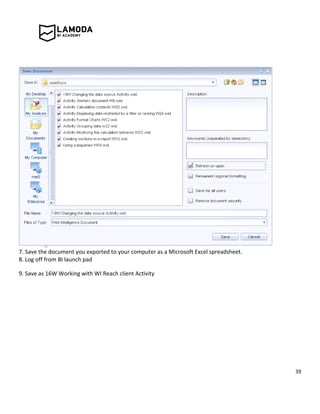
![57
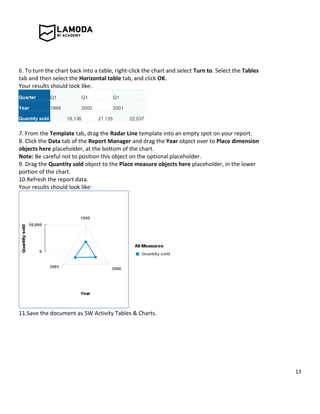
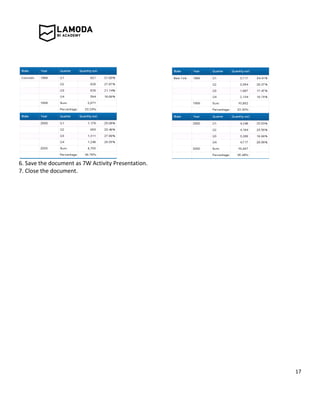
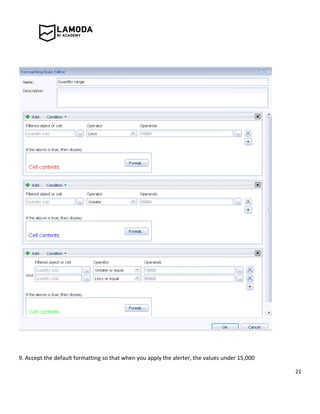
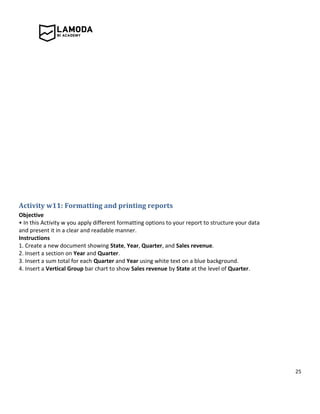
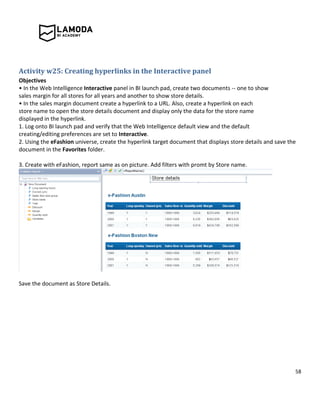
=NoFilter([Sales revenue] In([State]))
Note: By putting In([State]) at the end of the formula, you change the way Web
Intelligence calculates data by default. This is known as changing the calculation context.
6. Add the new variable to the table and display the sum in the footer of both the Sales revenue
and the new Total revenue columns.
7. Verify the calculation displayed below the Total revenue column. Has the sum calculated
the data correctly?
8. Using the Formula toolbar, modify the formula used in the Total Revenue footer cell to
calculate the sum total accurately.
The final report appears like this:
9. Save the document as Act_NoFilter.](https://image.slidesharecdn.com/businessobjectsactivitieswebintelligence-150606144904-lva1-app6892/85/Business-objects-activities-web-intelligence-57-320.jpg)

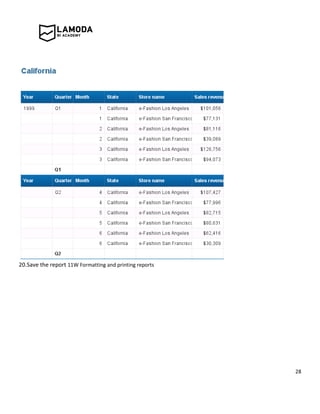
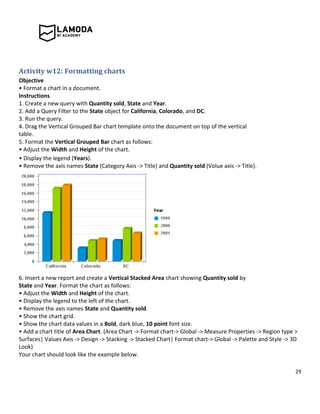
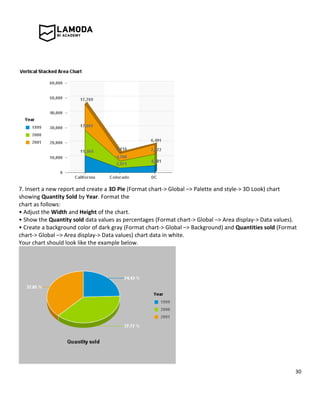
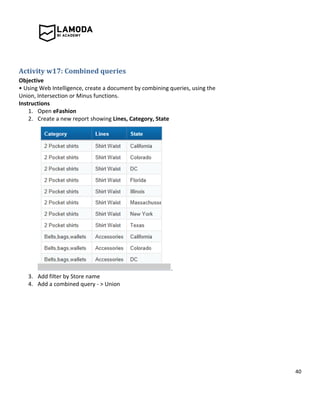
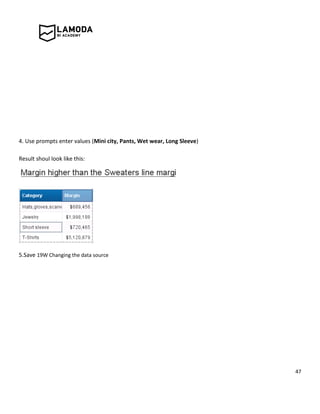
This document outlines 26 activities for learning Web Intelligence reporting. The activities cover skills like creating documents and queries, applying filters and prompts, formatting tables and charts, using calculations and breaks, and designing effective report layouts. The step-by-step instructions guide users through building sample reports to practice each technique.


