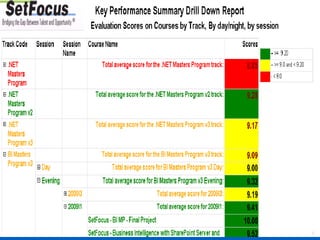
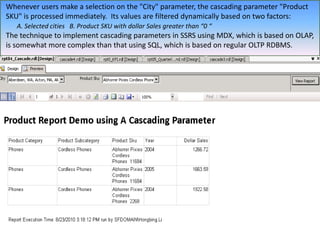
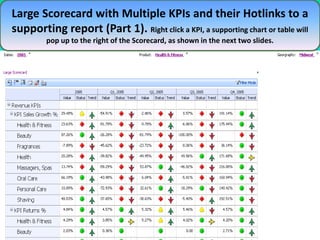
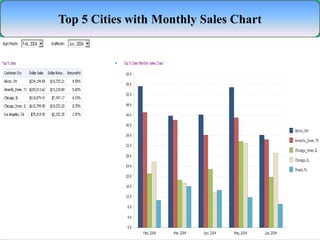
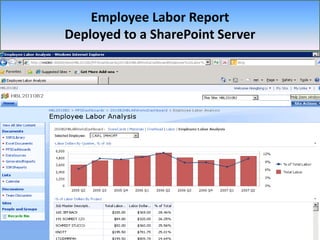
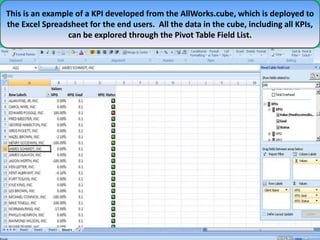
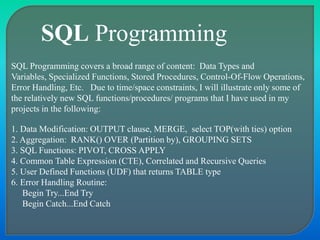
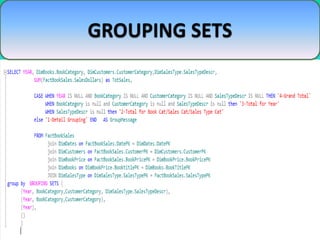
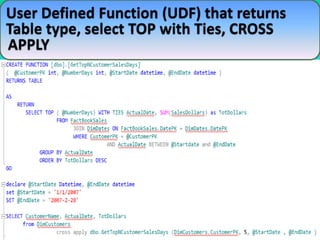
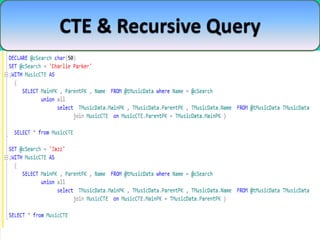
This document summarizes Hong-Bing Li's portfolio of business intelligence projects using Microsoft BI tools. It includes 3 SQL Server Reporting Services reports, 8 dashboards in SharePoint including scorecards and KPIs, 18 examples of SQL programming, and 25 SQL Server Integration Services packages for data integration. The document provides detailed descriptions and screenshots of sample reports, dashboards, SQL code, and SSIS packages developed by the author.
What's new in Excel 2013 - Steve Kraynak & Leif Brenne at Eusprig 2014eusprig
Learn about new developments and features in Microsoft Excel. In this session, we will discuss, answer questions and demonstrate several powerful new capabilities of Excel, including Spreadsheet Management, PowerBI (PowerPivot, PowerQuery, PowerView), real-time coauthoring, and others.
LeanIX offers an innovative software-as-a-service solution for Enterprise Architecture Management (EAM), based either in a public cloud or the client’s data center.
Companies like Adidas, Axel Springer, Helvetia, RWE, Trusted Shops and Zalando use LeanIX Enterprise Architecture Management tool.
Free Trial: http://bit.ly/LeanIXFreeTrial
Find out more on our latest features on the Enterprise Architecture platform LeanIX: E.g. Smarter Roadmap reports, better network performance and a feature allowing to directly jump from the filtered inventory to matching reports.
http://www.it-exams.fr/70-467.htm Le service après-vente est notre préoccupation principale. Nous cherchons à satisfaire tous les clients. En respectant le principe « le client d’abord » , nous faisons en sorte que tous les acheteurs réussissent à l’examen( Microsoft 70-467 (TS:Designing Business Intelligence Solutions with Microsoft SQL Server 2012) ). Garantir la confidentialité des données personnelles des clients fait fondamentalement partie de notre politique. Nous veillons à protéger strictement les informations personnelles des clients et à ne pas révéler, modifier ou divulguer les dossiers d’inscription et les informations non publiées sans autorisation des clients.
Basics of Microsoft Business Intelligence and Data Integration TechniquesValmik Potbhare
The presentation used to get the conceptual understanding of Business Intelligence and Data warehousing applications. This also gives a basic knowledge about Microsoft's offerings on Business Intelligence space. Lastly but not least, it also contains some useful and uncommon SQL server programming best practices.
This quick demo illustrates how I used a stored procedure with multiple selected parameter values within a SSRS Report. This technique can be used in the situation where developers want to utilize stored procedures, either by creating them from scratch or from existing legacy system, to develop new SSRS reports. It allows organizations to take advantage of the strength of stored procedures in maintenance and performance.
Adjusting primitives for graph : SHORT REPORT / NOTESSubhajit Sahu
Graph algorithms, like PageRank Compressed Sparse Row (CSR) is an adjacency-list based graph representation that is
Multiply with different modes (map)
1. Performance of sequential execution based vs OpenMP based vector multiply.
2. Comparing various launch configs for CUDA based vector multiply.
Sum with different storage types (reduce)
1. Performance of vector element sum using float vs bfloat16 as the storage type.
Sum with different modes (reduce)
1. Performance of sequential execution based vs OpenMP based vector element sum.
2. Performance of memcpy vs in-place based CUDA based vector element sum.
3. Comparing various launch configs for CUDA based vector element sum (memcpy).
4. Comparing various launch configs for CUDA based vector element sum (in-place).
Sum with in-place strategies of CUDA mode (reduce)
1. Comparing various launch configs for CUDA based vector element sum (in-place).
Techniques to optimize the pagerank algorithm usually fall in two categories. One is to try reducing the work per iteration, and the other is to try reducing the number of iterations. These goals are often at odds with one another. Skipping computation on vertices which have already converged has the potential to save iteration time. Skipping in-identical vertices, with the same in-links, helps reduce duplicate computations and thus could help reduce iteration time. Road networks often have chains which can be short-circuited before pagerank computation to improve performance. Final ranks of chain nodes can be easily calculated. This could reduce both the iteration time, and the number of iterations. If a graph has no dangling nodes, pagerank of each strongly connected component can be computed in topological order. This could help reduce the iteration time, no. of iterations, and also enable multi-iteration concurrency in pagerank computation. The combination of all of the above methods is the STICD algorithm. [sticd] For dynamic graphs, unchanged components whose ranks are unaffected can be skipped altogether.
Chatty Kathy - UNC Bootcamp Final Project Presentation - Final Version - 5.23...John Andrews
SlideShare Description for "Chatty Kathy - UNC Bootcamp Final Project Presentation"
Title: Chatty Kathy: Enhancing Physical Activity Among Older Adults
Description:
Discover how Chatty Kathy, an innovative project developed at the UNC Bootcamp, aims to tackle the challenge of low physical activity among older adults. Our AI-driven solution uses peer interaction to boost and sustain exercise levels, significantly improving health outcomes. This presentation covers our problem statement, the rationale behind Chatty Kathy, synthetic data and persona creation, model performance metrics, a visual demonstration of the project, and potential future developments. Join us for an insightful Q&A session to explore the potential of this groundbreaking project.
Project Team: Jay Requarth, Jana Avery, John Andrews, Dr. Dick Davis II, Nee Buntoum, Nam Yeongjin & Mat Nicholas
2. Slide Contents
3 Reports (SSRS)
8 Dashboard: Scorecard & KPI (SharePoint)
18 SQL Programming
25 Data Integration Services (SSIS)
This portfolio contains examples of my business intelligence
projects using Microsoft BI Product Stack.
7. 7
Whenever users make a selection on the "City" parameter, the cascading parameter "Product
SKU" is processed immediately. Its values are filtered dynamically based on two factors:
A. Selected cities B. Product SKU with dollar Sales greater than “0 “
The technique to implement cascading parameters in SSRS using MDX, which is based on OLAP,
is somewhat more complex than that using SQL, which is based on regular OLTP RDBMS.
9. 9
Large Scorecard with Multiple KPIs and their Hotlinks to a
supporting report (Part 1). Right click a KPI, a supporting chart or table will
pop up to the right of the Scorecard, as shown in the next two slides.
10. 10
Large Scorecard with Multiple KPIs and their Hotlinks to a supporting
report (Part 2 with partial Supporting Chart)
11. Large Scorecard with Multiple KPIs and their Hotlinks to a supporting
report (Part 3 with the complete Supporting Chart)
12. This dual Y-axis chart is a great tool for data analysis: 1. Two different types of measures
can be analyzed simultaneously against dimensional data on the X-Axis, such as Dollar
Sales (left Y-axis) and Product Percent of Parent Sales (right Y-Axis) shown below; 2. These
two measures can be broken out further to provide more detail in tables or charts (see
below) where the right Y-Axis measuring Product Percent is further explained by the Product
Siblings breakout; 3. Data can be explored at different levels of the Hierarchy family (see
the top Product Hierarchy dropdown list) which functions as a filter, allowing one to obtain
summary and detail statistics at different levels accordingly and export them to Excel or
PowerPoint; and 4. Data points in the chart can be drilled down to various dimensions
allowing for the creation of additional charts (see chart in next slide) which permit one to
investigate the contribution of various factors.
13. Continued: this chart is generated by drilling down from the
previous slide. For example, the 21.32% of health and fitness
sales of parents in Aug. 2005 is broken out by region.
17. 17
This is an example of a KPI developed from the AllWorks.cube, which is deployed to
the Excel Spreadsheet for the end users. All the data in the cube, including all KPIs,
can be explored through the Pivot Table Field List.
18. SQL Programming
SQL Programming covers a broad range of content: Data Types and
Variables, Specialized Functions, Stored Procedures, Control-Of-Flow Operations,
Error Handling, Etc. Due to time/space constraints, I will illustrate only some of
the relatively new SQL functions/procedures/ programs that I have used in my
projects in the following:
1. Data Modification: OUTPUT clause, MERGE, select TOP(with ties) option
2. Aggregation: RANK() OVER (Partition by), GROUPING SETS
3. SQL Functions: PIVOT, CROSS APPLY
4. Common Table Expression (CTE), Correlated and Recursive Queries
5. User Defined Functions (UDF) that returns TABLE type
6. Error Handling Routine:
Begin Try...End Try
Begin Catch...End Catch
26. A new database “All Works” is setup as the staging area for the ETL process. A
thorough understanding of the relationships between the tables in the data
diagram is important in determining the sequence of tables to be loaded and in
enforcing referential integrity.
26
27. A Script Task is utilized to maintain multiple sets of variables with scripts in C#, for
instance, one for keeping track of row counts of data processed dynamically at the
folder level, one for row counts at the file level.
28. One SSIS package is created to do ETL for one target table. The following illustrates
the data processing within the Job Timesheets package: the data process pipeline
starts by extracting data from a CSV file. The data is then conversed, processed and
transformed (filter, remove duplicates, lookups, validate) as it passes through the
pipeline, and is finally loaded into the target job timesheets table either as inserts
or updates. It logs any rows that error out for review and correction. Similarly,
seven more packages are generated for seven target tables.
28
29. 29
A Sequence Container is deployed to run the eight ETL packages in sequence based on the
relationships between the tables in the “All Works” Database to ensure referential integrity. If the
eight packages are processed successfully, data maintenance tasks are performed. A success or
failure notice email will be sent out depending on whether the data maintenance tasks are all
successfully completed or not.
A Master Package is created to contain the Sequence Container, the maintenance tasks and the
email notices; then a SQL Server Agent Job is setup to run the Master Package on a predefined
schedule to automate the entire data processing procedure.