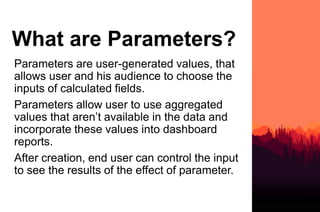
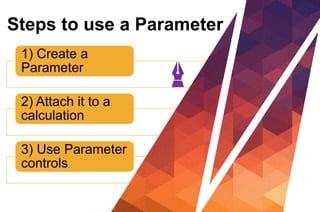
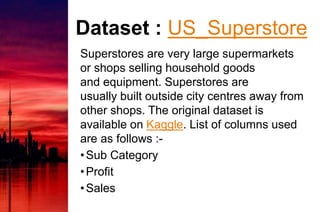
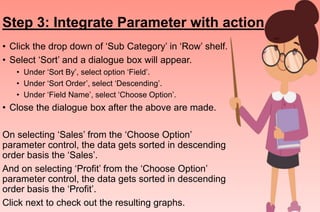
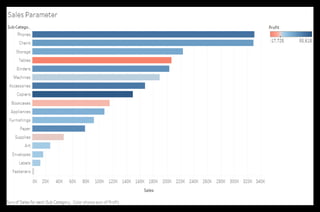
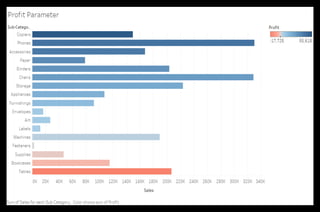
This document provides a guide on using Tableau data visualization software, specifically focusing on the creation and implementation of parameters for dynamic data analysis. It outlines steps to create a parameter, define its action, and integrate it with calculations, allowing for flexible data visualization such as sorting by sales or profit. Additionally, it explains the usefulness of parameters for filtering data across multiple data sources and illustrates their application with examples.


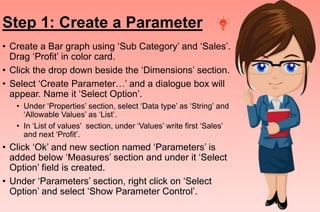
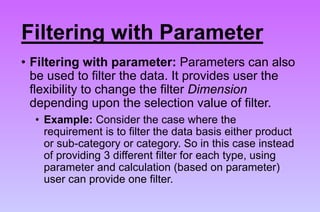
![Step 2: Define action to Parameter
• Click the drop down beside the ‘Dimensions’ section.
• Select ‘Create Calculated Field…’ and a dialogue
box will appear. Name it ‘Choose Option’ and write
the formula as follows:
Case [Select Option]
When ‘Sales’
Then [Sales]
When ‘Profit’
Then [Profit]
End
• Click ‘Ok’ and a ‘Choose Option’ field is created
under ‘Measures’ section.](https://image.slidesharecdn.com/parametersintableau-200823170909/85/Parameters-in-Tableau-9-320.jpg)


![[DSC Europe 25] Ivan Lukovic & Marija Djukic - From Data to Value: Why Maturi...](https://cdn.slidesharecdn.com/ss_thumbnails/ahrfps8xr6knowwhacxh-1-ivan-marija-dsc-2025-ld-v1-presentation-260115093812-be21adfc-thumbnail.jpg?width=640&height=640&fit=bounds)


![[DSC Europe 25] Bojan Djuricic - Predictive Design Process.pdf](https://cdn.slidesharecdn.com/ss_thumbnails/5awdrbedqdek3gqu2ezy-4-the-predictive-design-bojan-djuricic-260120105856-6c399e9b-thumbnail.jpg?width=640&height=640&fit=bounds)

