1) This document summarizes an experiment to determine the center of pressure on a partially submerged plane surface. Tables of recorded data show close agreement between experimental and theoretical values.
2) A second part of the experiment aimed to determine the position of the center of pressure of a fully submerged plane surface, but results showed a 75% discrepancy between experimental and theoretical values.
3) Factors like parallax errors, random errors, water impurities, and bubbles could explain the discrepancies. Careful measurement and repeated trials could improve accuracy. The findings are relevant to submarine hull design to withstand high hydrostatic pressures at depth.
this is the experiment of fluid mechanics .FLOW OVER A SHARP CRESTED WEIR.experiment of weir.from this experiment we can learn discharge over the sharp crested weir and etc.
SAIF ALDIN ALI MADIN
سيف الدين علي ماضي
S96aif@gmail.com
1. Studying the performance of this type of centrifugal pump
2. Calculating the theoretical efficiency of centrifugal pump and
compare with experimental efficiency of centrifugal pump
The aim of the fluid flow rate experiment is to measure the fluid flow rate using a device called the hydraulic bench unit, which is also used to prove the Bernoulli’s Theorem Demonstration by measuring the overall pressure of the fluid flow.
Determination of consolidation properties (like CV, CC, CS, t90, mv, av) of the given soil specimen (Dhanauri Clay) by conducting one-dimensional consolidation test using fixed ring type setup.
Learning Outcomes:-
1. From consolidation test, the following information can be determined:
a) Amount of settlement experienced by a soil-structure after load application
b) Rate of consolidation of soil under a normal load
c) Degree of consolidation at any time
d) Pressure void ratio relationship
e) Coefficient of consolidation at various successively increasing pressure
f) Permeability of soil at various stages of loading
g) Compression index of soil
2. The general procedure for laboratory evaluation of consolidation characteristics of soils involves a one-dimensional consolidation.
This is necessary because of:
• Difficulty of instrumentation for recording volume change and natural strains.
• Complexities in mathematical analysis of three-dimensional consolidation.
3. The underlying assumptions in the derivation of the mathematical equations are as follows:
• The clay layer is homogeneous.
• The clay layer is saturated, the compression of the soil layer is due to the change in volume only, which in turn, is due to the squeezing out of water from the void spaces.
• Darcy’s law is valid.
• Deformation of soil occurs only in the direction of the load application.
4. Effects of ring friction
• During loading reduce stress acted on the specimen, specimen compresses less.
• During rebound reduce the swelling tendency specimen swell less.
• Flatten the swelling curve at low stress level.
5. Resultant Cv decreases with increasing stress, implying its NC clay.
6. Sample was preserved in polybag to check loss of moisture content.
The penetration test is used as a measure of consistency. Higher values of penetration indicate softer consistency.
The test is widely used all over the world for classifying bituminous materials into different grades.
It might seem to be over-reaching to try a discussion of one thing that sounds as domineering as hydraulics pressure in a very lay essay, however if you’ll bear with ME, you’ll quickly see however this can be each relevant and conceptually accessible to only concerning everybody.
Bernoulli equation Determination through LAB work.pdfBapi Mondal
Applying Bernoulli equation to determine the orifice throat diameter of the
given orifice meter and plotting the following curves.
a) Pressure difference vs Reynolds number.
b) Log pressure difference vs Log velocity
c) Log average velocity vs manometer reading and find the slope of the line.
Presentation on Calculation of Polytropic and Isentropic Efficiency of natura...Waqas Manzoor
This presentation demonstrates comparison of calculation of Polytropic and Isentropic Efficiency of Natural Gas Compressor using Aspen HYSYS & using Manual Calculations. Complete derivation of equations of Polytropic and Isentropic efficiency, have also been demonstrated. The slight difference observed in the manually calculated values and Aspen HYSYS simulation, may be attributed to the calculation method of the software which is based on numerical integration.
PyTeCK: A Python-based automatic testing package for chemical kinetic modelsOregon State University
Combustion simulations require detailed chemical kinetic models to predict fuel oxidation, heat release, and pollutant emissions. These models are typically validated using qualitative rather than quantitative comparisons with limited sets of experimental data. This work introduces PyTeCK, an open-source Python-based package for automatic testing of chemical kinetic models. Given a model of interest, PyTeCK automatically parses experimental datasets encoded in a YAML format, validates the self-consistency of each dataset, and performs simulations for each experimental datapoint. It then reports a quantitative metric of the model's performance, based on the discrepancy between experimental and simulated values and weighted by experimental variance. The initial version of PyTeCK supports shock tube and rapid compression machine experiments that measure autoignition delay. PyTeCK relies on several packages in the SciPy stack and greater scientific Python ecosystem. In addition to providing an easy-to-use, automated tool for evaluating chemical kinetic model performance, a secondary objective of PyTeCK is to encourage greater openness and reproducibility in combustion research.
Cosmetic shop management system project report.pdfKamal Acharya
Buying new cosmetic products is difficult. It can even be scary for those who have sensitive skin and are prone to skin trouble. The information needed to alleviate this problem is on the back of each product, but it's thought to interpret those ingredient lists unless you have a background in chemistry.
Instead of buying and hoping for the best, we can use data science to help us predict which products may be good fits for us. It includes various function programs to do the above mentioned tasks.
Data file handling has been effectively used in the program.
The automated cosmetic shop management system should deal with the automation of general workflow and administration process of the shop. The main processes of the system focus on customer's request where the system is able to search the most appropriate products and deliver it to the customers. It should help the employees to quickly identify the list of cosmetic product that have reached the minimum quantity and also keep a track of expired date for each cosmetic product. It should help the employees to find the rack number in which the product is placed.It is also Faster and more efficient way.
CFD Simulation of By-pass Flow in a HRSG module by R&R Consult.pptxR&R Consult
CFD analysis is incredibly effective at solving mysteries and improving the performance of complex systems!
Here's a great example: At a large natural gas-fired power plant, where they use waste heat to generate steam and energy, they were puzzled that their boiler wasn't producing as much steam as expected.
R&R and Tetra Engineering Group Inc. were asked to solve the issue with reduced steam production.
An inspection had shown that a significant amount of hot flue gas was bypassing the boiler tubes, where the heat was supposed to be transferred.
R&R Consult conducted a CFD analysis, which revealed that 6.3% of the flue gas was bypassing the boiler tubes without transferring heat. The analysis also showed that the flue gas was instead being directed along the sides of the boiler and between the modules that were supposed to capture the heat. This was the cause of the reduced performance.
Based on our results, Tetra Engineering installed covering plates to reduce the bypass flow. This improved the boiler's performance and increased electricity production.
It is always satisfying when we can help solve complex challenges like this. Do your systems also need a check-up or optimization? Give us a call!
Work done in cooperation with James Malloy and David Moelling from Tetra Engineering.
More examples of our work https://www.r-r-consult.dk/en/cases-en/
Welcome to WIPAC Monthly the magazine brought to you by the LinkedIn Group Water Industry Process Automation & Control.
In this month's edition, along with this month's industry news to celebrate the 13 years since the group was created we have articles including
A case study of the used of Advanced Process Control at the Wastewater Treatment works at Lleida in Spain
A look back on an article on smart wastewater networks in order to see how the industry has measured up in the interim around the adoption of Digital Transformation in the Water Industry.
Hierarchical Digital Twin of a Naval Power SystemKerry Sado
A hierarchical digital twin of a Naval DC power system has been developed and experimentally verified. Similar to other state-of-the-art digital twins, this technology creates a digital replica of the physical system executed in real-time or faster, which can modify hardware controls. However, its advantage stems from distributing computational efforts by utilizing a hierarchical structure composed of lower-level digital twin blocks and a higher-level system digital twin. Each digital twin block is associated with a physical subsystem of the hardware and communicates with a singular system digital twin, which creates a system-level response. By extracting information from each level of the hierarchy, power system controls of the hardware were reconfigured autonomously. This hierarchical digital twin development offers several advantages over other digital twins, particularly in the field of naval power systems. The hierarchical structure allows for greater computational efficiency and scalability while the ability to autonomously reconfigure hardware controls offers increased flexibility and responsiveness. The hierarchical decomposition and models utilized were well aligned with the physical twin, as indicated by the maximum deviations between the developed digital twin hierarchy and the hardware.
Student information management system project report ii.pdfKamal Acharya
Our project explains about the student management. This project mainly explains the various actions related to student details. This project shows some ease in adding, editing and deleting the student details. It also provides a less time consuming process for viewing, adding, editing and deleting the marks of the students.
Saudi Arabia stands as a titan in the global energy landscape, renowned for its abundant oil and gas resources. It's the largest exporter of petroleum and holds some of the world's most significant reserves. Let's delve into the top 10 oil and gas projects shaping Saudi Arabia's energy future in 2024.
About
Indigenized remote control interface card suitable for MAFI system CCR equipment. Compatible for IDM8000 CCR. Backplane mounted serial and TCP/Ethernet communication module for CCR remote access. IDM 8000 CCR remote control on serial and TCP protocol.
• Remote control: Parallel or serial interface.
• Compatible with MAFI CCR system.
• Compatible with IDM8000 CCR.
• Compatible with Backplane mount serial communication.
• Compatible with commercial and Defence aviation CCR system.
• Remote control system for accessing CCR and allied system over serial or TCP.
• Indigenized local Support/presence in India.
• Easy in configuration using DIP switches.
Technical Specifications
Indigenized remote control interface card suitable for MAFI system CCR equipment. Compatible for IDM8000 CCR. Backplane mounted serial and TCP/Ethernet communication module for CCR remote access. IDM 8000 CCR remote control on serial and TCP protocol.
Key Features
Indigenized remote control interface card suitable for MAFI system CCR equipment. Compatible for IDM8000 CCR. Backplane mounted serial and TCP/Ethernet communication module for CCR remote access. IDM 8000 CCR remote control on serial and TCP protocol.
• Remote control: Parallel or serial interface
• Compatible with MAFI CCR system
• Copatiable with IDM8000 CCR
• Compatible with Backplane mount serial communication.
• Compatible with commercial and Defence aviation CCR system.
• Remote control system for accessing CCR and allied system over serial or TCP.
• Indigenized local Support/presence in India.
Application
• Remote control: Parallel or serial interface.
• Compatible with MAFI CCR system.
• Compatible with IDM8000 CCR.
• Compatible with Backplane mount serial communication.
• Compatible with commercial and Defence aviation CCR system.
• Remote control system for accessing CCR and allied system over serial or TCP.
• Indigenized local Support/presence in India.
• Easy in configuration using DIP switches.
1. MECHANICALENGINEERINGDEPARTMENT
FLUID MECHANICS LAB
TITLE
HydrostaticPressure
INTRODUCTION
OBJECTIVE
Thisexperimentiscarriedoutto determinethe centre of pressure onapartially
submergedplane surface. (PartA)
The purpose of thisexperimentis todetermine the positionof the centre of pressure of
a plane surface immersedinwaterandtocompare the experimental positionwiththe
theoretical position.(PartB)
APPARATUS
1. HydraulicsBenchF1-10
2. HydrostaticPressure ApparatusF1-12
PROCEDURE
1. The quadrant wasplacedon the twodowel pinsandusingthe clampingscrew,itwas
fastentothe balance arm.
2. Value of a, L, depthdand widthb,of the quadrant endface were measured and
recorded.
3. Withthe Perspex tankonthe bench,the balance armwas positiononthe knife edges
(pivot).The balance panwashangedfromthe endof the balance arm.
4. A hose wasconnected fromthe draincock to the sump.
5. The tank was leveledusingthe adjustablefeetandspiritlevel.The counterbalance
weightwasmoveduntil the balance armwashorizontal.
6. The drain cock wasclosedand waterwasadmitteduntil the levelreachesthe bottom
edge of the quadrant.
7. For part A, weightof 50g was placedonthe balance pan,slowlyaddingwaterintothe
tank until the balance armwas horizontal.The waterlevel onthe quadrantandthe
weightonthe balance panwere recorded. (Fine adjustmentof the waterlevel was
achievedbyoverfillingandslowlydraining,usingthe stopcock)
8. Step7 wasrepeated 6 timesforweight100g, 120g, 140g, 160g, 170g and 180g.
9. For draining,eachincrementof weightinstep8 wasremovedone byone,andwater
levels were recorded after the weight was removed, until weight 50g on the balance pan.
10. The recordeddata was tabulatedinatable.
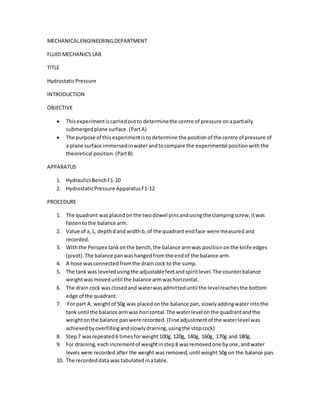
2. 11. Withthe table,Graphof m/y2
againsty wasplotted,then,the gradientandthe y-
interceptof the graphwere determined.
12. For part B, step7 wasrepeatedbyusingweightof 300g, 350g, 400g, 450g and 500g.
13. The recordeddata for part B was tabulatedintoatable.
RESULT
Part A
Heightof the quadrant fromthe top endface,a = 0.100m
Lengthfromthe pivottothe endof balance arm, L = 0.285m
Depthof the endface of quadrant,d = 0.100m
Widthof the endface of quadrant,b = 0.075
FILLING TANK DRAININGTANK AVERAGEVALUE CALCULATIONS
Weight
of load,
m (kgms-
2
)
Heightof
water,y
(m)
Weight
of load,
m (kgms-
2
)
Heightof
water,y
(m)
Weight
of load,
mA
(kg/ms-2
)
Heightof
water,yA
(m)
Wetted
surface
area,y2
(×10-3
m²)
Hydrostatic
Pressure,
m/y2
(Pa)
0.4905 0.044 0.4905 0.045 0.4905 0.0445 1.9803 247.69
0.9810 0.064 0.9810 0.065 0.9810 0.0645 4.1603 235.80
1.1772 0.071 1.1772 0.072 1.1772 0.0715 5.1123 230.27
1.3734 0.077 1.3734 0.078 1.3734 0.0775 6.0063 228.66
1.5696 0.082 1.5696 0.083 1.5696 0.0825 6.8063 230.61
1.6677 0.086 1.6677 0.086 1.6677 0.0860 7.3960 225.49
1.7658 0.089 1.7658 0.089 1.7658 0.0890 7.9210 222.93
3. da
L
gb
y
L
gb
y
m
262
From the equation,
For a partiallyimmersedobject,
Compare thisequationwithgeneralequation,y=mX + C
Gradientof graph, m = -ρgb/6L
-ρgb/6L = -461.63kgm-2
s-2
Y-interceptof graph,C = ρgb(a+d)/2L
ρgb(a+d)/2L = 265.48Pa
Calculation of theoretical value
-ρgb/6L =-[(1000)(9.81)(0.075)]/6(0.285)
y = -461.63x + 265.48
220
225
230
235
240
245
250
0 0.01 0.02 0.03 0.04 0.05 0.06 0.07 0.08 0.09 0.1
HydrostaticPressure,m/y2(Pa)
Height of water, y (m)
Grapg of m/y² against y
4. =-430.26 kgm-2
s-2
ρgb(a+d)/2L= [(1000)(9.81)(0.075)(0.100+0.100)]/2(0.285)
= 258.16Pa
Percentage of discrepanciesof the gradient,
%discrepanciesof gradient=|[(-461.63)-(-430.26)] / (-430.26)| × 100%
= 7.29%
Percentage of discrepanciesof the y-intercept,
%discrepanciesof y-intercept=|[(265.48)-(258.16)] / (258.16)]|× 100%
= 2.84%
Part B
Equationof term
q = a+d-r
A = b × r
XpA = 2mL / ρrA
XpT = 2r/3 +q
For example,
q1 = 0.100+0.100-0.118 = 0.082m
A1 = 0.075 × 0.118 = 8.85×10⁻³
m2
XpA1 = 2(0.30)(0.285) / (1000)(0.118)( 8.85×10⁻³
) = 0.1637m
XpT1 = 2(0.118) / 3 + (0.082) = 0.1607m
No. Mass, m (kg) Height
of
water,
r (m)
Length
from
water
level to
balance
arm, q
Areaof
immersed
plane,A
(×10-3
m2
)
XpA (mm) XpT (mm)
5. (m)
1 0.300 0.118 0.082 8.850 0.1637 0.1607
2 0.350 0.130 0.070 9.750 0.1574 0.1567
3 0.400 0.143 0.057 10.725 0.1487 0.1523
4 0.450 0.155 0.045 11.625 0.1424 0.1483
5 0.500 0.168 0.032 12.600 0.1346 0.1440
From the graph of Xp Actual againstXp Theoretical,
Gradientof the graph, m = 1.752
Percentage of discrepancybetweenXp Actual andXp Theoretical,
% discrepanciesof ratio of Xp Actual / Xp Theoretical =|[(1.752)-(1.000)] / (1.000)| × 100%
= 75.2%
DISCUSSION
y = 1.752x - 0.1176
0
0.02
0.04
0.06
0.08
0.1
0.12
0.14
0.16
0.18
0.142 0.144 0.146 0.148 0.15 0.152 0.154 0.156 0.158 0.16 0.162
XpActual
Xp Theoretical
Graph of Xp Actual against Xp Theoretical
6. From the obtainedresult, the theoretical value of -ρb/6Lis-430.26 kgm-2
s-2
andρb(a+d)/2Lis
258.16Pa, whereasthe experimentalvalue of -ρb/6Lis-461.63kgm-2
s-2
andρb(a+d)/2Lis
265.48Pa. Bycomparingeach other,the percentage of discrepancyof -ρb/6Lis7.29%, while the
percentage of discrepancyof ρb(a+d)/2Lis2.84%. Since bothpercentagesof discrepanciesare
lowerthan10%, therefore the experimentpartA can be consideredassuccessful.
However,forpartB, the experimental ratioof the actual depthof centerof pressure to
the theoretical of thatis1.752. Since the theoretical ratiois1.000, thus the percentage of
discrepancyof the ratiois 75.2%. Due to the large percentage of discrepancy,the experiment
part B is consideredasunsuccessful.
The discrepanciesbetweenthe theoretical andexperimental resultinthisexperiment
are due to some errorsor factors that have beendone duringthe experiment.First, parallax
error mayoccur duringmeasurementof dimensionof quadrantandbalance arm, whichare a, L,
b and d. Thiserror occurs due to the eye level of the observerisnotperpendiculartothe scale
of the apparatus duringthe measurement,thusthe measuredvaluesare deviate withthe actual
value.Second, randomerrormayoccur in the experiment.Thiserroris causedbyunknownand
unpredictablechangesinthe experiment. Forexample,whenaddingthe waterintothe tank,
turbulentflowwill occurinthe tank,whichis unpredictable andcannotbe calculated.Asa
result,thisexperimentdoesnotobeythe assumptionof hydrostaticequilibriumand affecting
the resultindirectly.One of the factorsinthisexperimentisimpuritiesinthe water.The
assumptionsof thisexperimentisthe densityof the wateris1000kg/m3
,but the impuritiesin
the waterprovide extravolume andcause deviationof value of densitywiththe actual value,
thusthe resultbecomesinaccurate.Lastly,somewaterdropletsorairbubbleswill formonthe
quadrantwhenaddingthe waterintothe tank. Thisphenomenonwillcause the extraorless
force duringthe experiment.
To obtainmore accurate result,some precautionshave tobe done duringthe
experiment.Firstof all,topreventparallax error,the observershouldmake sure hiseye level is
alwaysperpendiculartothe apparatusscale duringmeasurement.Tominimize the effectof
randomerror, thisexperimentshouldbe repeatedseveral timestoobtainedaverage value
whichismore accurate. Also,inclinedplane shouldbe usedasa mediumduringaddingthe
water.Thisis because the inclinedplane canminimize the effectof turbulentflowandprevent
the phenomenonof formingwaterdropletandairbubble. Thisexperimentshouldalsobe
carriedout ina closedareawhichdoeshave minimumventilationtoobtainmore accurate
result.
Hydrostaticpressure isthe mostprioritized problemduringdesignationof the
submarine hulls.Fromthe equationof P = ρgh/A,where histhe depthof the submarine.So,the
pressure exertedonthe submarine,P,isdirectlyproportionaltothe depthof the submarine,h.
Generally,the submarine can dive thousandmetersbelow the sealevel,the worldrecordof the
submarine divingdepthis Trieste,whichdive 10911 meters.Thus,the exertedhydrostatic
pressure isverylarge. Asa result,submarine mustbe builttobe strongenoughtowithstand
7. such tremendouspressure.Towithstandlarge pressure,the hullof the submarine shouldbe
made ina shape whichcan withstandhighhydrostaticpressure.Nowadays,the submarinesare
built in cigar shape, which is also called “teardrop hull” and was pattern after the body of whales.
Thisshape can reduce the hydrodynamicdrag and noise of the submarine whendiving,while
decreasingthe seakeepingcapabilitiesand increasingthe dragforce whenat the watersurface.
For small submarines,aswell asthe oldestones,have asingle hull.Large submarinesnormally
have an extrahull.This external hull,whichactuallyformsthe shape of submarine,iscalledthe
outer hull or light hull, but it does not have to hold any pressure difference. Inside the outer hull,
there isa strong hull,orpressure hull,whichwithstandsseapressure andhasnormal
atmosphericpressure inside. The material of the hull will alsodetermine the capabilityof the
hull towithstandhydrostaticpressure. Ateraof WorldWar One,submarine wasbuiltbyusing
carbon steel,whichcannotdive below 100 meters.ForWorldWar Two,highstrengthalloyed
steel wasused,anditenable submarinestodive upto 200 meters.While,thisalloyedsteelis
still the mainmaterial forsubmarinesnowadays,withadepthlimitof from250 to 400 meters.
For militarysubmarines,theyare builtwithtitaniumalloy,whichallowsincrease indepth.
Titaniumisalmostas strongas steel,havinga lighterweight,andalsonotferromagnetic,which
enable tostealth.The testdepthof titaniumsubmarineisone thousandmeters.
CONCLUSION
The objectivesof thisexperimentare achieved.The centre of pressure isprovedthatitisalways
belowthe centroidforfullysubmergedbody.While,the presence of discrepanciesbetweenthe
actual andtheoretical resultsmaydue tosome errorsand factorsduringthe experiment,such
as, parallax error,randomerror,impuritiesof water,andothers.Toact as a reactiontothe
hydrostaticpressure,designof the submarine hullsshouldbe consideredintermof shape and
material of the hull.Titaniumalloyisastrongmaterial tobuildthe hull.The hull shouldbe built
incigar shape.
REFERENCES
1. Bruce R. Munson,DonaldF.Young, TedH. Okiishi,Wade W.Huebsch.(2010).
Fundamentalsof FluidMechanics(6thed.).US:JohnWiley&Sons,Inc.
2. (October2015). Submarine.Retrieved26December2015, from
http://www.newworldencyclopedia.org/entry/Submarine
3.