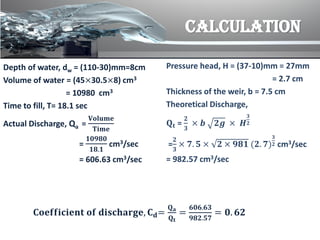
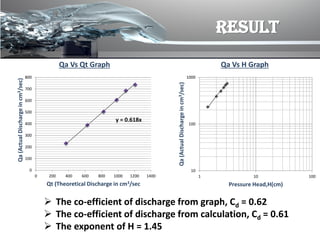
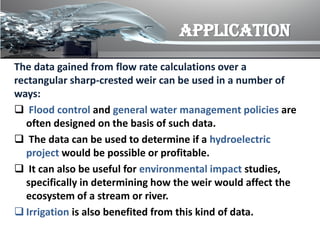
FLOW OVER A SHARP
CRESTED WEIR
Chittagong University of
Engineering and Technology
Dept. of Civil Engineering
GROUP-B1(4)
ID:1601084
1601085
1601086
1601087
1601088
TABLE OF CONTENTS
1.Introduction
2.Theory
3.Procedure
4.Calculation
5.Result
6.Discussion
7.Application
Introduction
A weir with a sharp upstream
corner or edge such that the
water springs clear of the crest
is a sharp-crested weir. It is
commonly used in large scale
situations. For small scale
applications, weirs are often
referred to as notches and
invariably are sharp edged.
THEORY
 In a sharp-crested weir, the thickness of the weir
is kept less than half of the height of water on
the weir, i.e; b<H/2
where,
b=Thickness of the weir.
H=Height of water above the crest of the weir.
The discharge equation for a sharp-crested weir,
remains the same as that of rectangular weir &
rectangular notch, i.e;
Q =
𝟐
𝟑
𝐂 𝐝 × 𝐛 𝟐𝐠 × 𝐇
𝟑
𝟐
where,
𝑪 𝒅=Co-efficient of discharge.
PROCEDURE
At first, the
pump was
started & to get
the uniform flow
4-5 minutes
were needed.
Then the bench was
adjusted regulating
the valve to give the
first required head
level of approximately
10mm.
The pressure
head was
observed
after that.
Depth of water
level was fixed.
Time was
counted through
a stop watch till
water reaches the
required level.
Collected data
was used to
plot graphs.
CALCULATION
Depth of water, dw = (110-30)mm=8cm
Volume of water = (45×30.5×8) cm3
= 10980 cm3
Time to fill, T= 18.1 sec
Actual Discharge, Qa =
𝐕𝐨𝐥𝐮𝐦𝐞
𝐓𝐢𝐦𝐞
=
𝟏𝟎𝟗𝟖𝟎
𝟏𝟖.𝟏
cm3/sec
= 606.63 cm3/sec
Pressure head, H = (37-10)mm = 27mm
= 2.7 cm
Thickness of the weir, b = 7.5 cm
Theoretical Discharge,
𝐐𝐭 =
𝟐
𝟑
× 𝒃 𝟐𝒈 × 𝑯
𝟑
𝟐
=
𝟐
𝟑
× 𝟕. 𝟓 × 𝟐 × 𝟗𝟖𝟏 (𝟐. 𝟕)
𝟑
𝟐 cm3/sec
= 982.57 cm3/sec
𝐂𝐨𝐞𝐟𝐟𝐢𝐜𝐢𝐞𝐧𝐭 𝐨𝐟 𝐝𝐢𝐬𝐜𝐡𝐚𝐫𝐠𝐞, 𝐂 𝐝=
𝐐 𝐚
𝐐 𝐭
=
𝟔𝟎𝟔.𝟔𝟑
𝟗𝟖𝟐.𝟓𝟕
= 𝟎. 𝟔𝟐
RESULT
 The co-efficient of discharge from graph, Cd = 0.62
 The co-efficient of discharge from calculation, Cd = 0.61
 The exponent of H = 1.45
y = 0.618x
0
100
200
300
400
500
600
700
800
0 200 400 600 800 1000 1200 1400
Qa(ActualDischargeincm3/sec)
Qt (Theoretical Discharge in cm3/sec
Qa Vs Qt Graph
10
100
1000
1 10 100
Qa(ActualDischargeincm3/sec) Pressure Head,H(cm)
Qa Vs H Graph
DISCUSSION
 The experiment has been done very carefully. We have found the
Cd 0.62 and the exponent of H 1.45 where the standard value of
these are 0.65 and 1.50 respectively. Though maximum
precautions were maintained, some errors have been occurred.
The meniscus reading was not found accurately as it was not hold
in a stable position. There was some shakings and vibrations which
might have affected the value. The apparatus is old, so there may
have some mechanical errors and the fluid flow was not fully
uniform. Also there was some inaccuracy in recording time in the
stopwatch (human error) and plotting the points in the log paper
was also not hundred percent accurate. All these factors together
contributed to the error for which the ideal value could not be
found rather a value quite near to the ideal value was calculated.
APPLICATION
The data gained from flow rate calculations over a
rectangular sharp-crested weir can be used in a number of
ways:
 Flood control and general water management policies are
often designed on the basis of such data.
 The data can be used to determine if a hydroelectric
project would be possible or profitable.
 It can also be useful for environmental impact studies,
specifically in determining how the weir would affect the
ecosystem of a stream or river.
 Irrigation is also benefited from this kind of data.
THANK
YOU

FLOW OVER A SHARP CRESTED WEIR

  • 1.
    FLOW OVER ASHARP CRESTED WEIR
  • 2.
    Chittagong University of Engineeringand Technology Dept. of Civil Engineering GROUP-B1(4) ID:1601084 1601085 1601086 1601087 1601088
  • 3.
  • 4.
    Introduction A weir witha sharp upstream corner or edge such that the water springs clear of the crest is a sharp-crested weir. It is commonly used in large scale situations. For small scale applications, weirs are often referred to as notches and invariably are sharp edged.
  • 5.
    THEORY  In asharp-crested weir, the thickness of the weir is kept less than half of the height of water on the weir, i.e; b<H/2 where, b=Thickness of the weir. H=Height of water above the crest of the weir. The discharge equation for a sharp-crested weir, remains the same as that of rectangular weir & rectangular notch, i.e; Q = 𝟐 𝟑 𝐂 𝐝 × 𝐛 𝟐𝐠 × 𝐇 𝟑 𝟐 where, 𝑪 𝒅=Co-efficient of discharge.
  • 6.
    PROCEDURE At first, the pumpwas started & to get the uniform flow 4-5 minutes were needed. Then the bench was adjusted regulating the valve to give the first required head level of approximately 10mm. The pressure head was observed after that. Depth of water level was fixed. Time was counted through a stop watch till water reaches the required level. Collected data was used to plot graphs.
  • 7.
    CALCULATION Depth of water,dw = (110-30)mm=8cm Volume of water = (45×30.5×8) cm3 = 10980 cm3 Time to fill, T= 18.1 sec Actual Discharge, Qa = 𝐕𝐨𝐥𝐮𝐦𝐞 𝐓𝐢𝐦𝐞 = 𝟏𝟎𝟗𝟖𝟎 𝟏𝟖.𝟏 cm3/sec = 606.63 cm3/sec Pressure head, H = (37-10)mm = 27mm = 2.7 cm Thickness of the weir, b = 7.5 cm Theoretical Discharge, 𝐐𝐭 = 𝟐 𝟑 × 𝒃 𝟐𝒈 × 𝑯 𝟑 𝟐 = 𝟐 𝟑 × 𝟕. 𝟓 × 𝟐 × 𝟗𝟖𝟏 (𝟐. 𝟕) 𝟑 𝟐 cm3/sec = 982.57 cm3/sec 𝐂𝐨𝐞𝐟𝐟𝐢𝐜𝐢𝐞𝐧𝐭 𝐨𝐟 𝐝𝐢𝐬𝐜𝐡𝐚𝐫𝐠𝐞, 𝐂 𝐝= 𝐐 𝐚 𝐐 𝐭 = 𝟔𝟎𝟔.𝟔𝟑 𝟗𝟖𝟐.𝟓𝟕 = 𝟎. 𝟔𝟐
  • 8.
    RESULT  The co-efficientof discharge from graph, Cd = 0.62  The co-efficient of discharge from calculation, Cd = 0.61  The exponent of H = 1.45 y = 0.618x 0 100 200 300 400 500 600 700 800 0 200 400 600 800 1000 1200 1400 Qa(ActualDischargeincm3/sec) Qt (Theoretical Discharge in cm3/sec Qa Vs Qt Graph 10 100 1000 1 10 100 Qa(ActualDischargeincm3/sec) Pressure Head,H(cm) Qa Vs H Graph
  • 9.
    DISCUSSION  The experimenthas been done very carefully. We have found the Cd 0.62 and the exponent of H 1.45 where the standard value of these are 0.65 and 1.50 respectively. Though maximum precautions were maintained, some errors have been occurred. The meniscus reading was not found accurately as it was not hold in a stable position. There was some shakings and vibrations which might have affected the value. The apparatus is old, so there may have some mechanical errors and the fluid flow was not fully uniform. Also there was some inaccuracy in recording time in the stopwatch (human error) and plotting the points in the log paper was also not hundred percent accurate. All these factors together contributed to the error for which the ideal value could not be found rather a value quite near to the ideal value was calculated.
  • 10.
    APPLICATION The data gainedfrom flow rate calculations over a rectangular sharp-crested weir can be used in a number of ways:  Flood control and general water management policies are often designed on the basis of such data.  The data can be used to determine if a hydroelectric project would be possible or profitable.  It can also be useful for environmental impact studies, specifically in determining how the weir would affect the ecosystem of a stream or river.  Irrigation is also benefited from this kind of data.
  • 11.