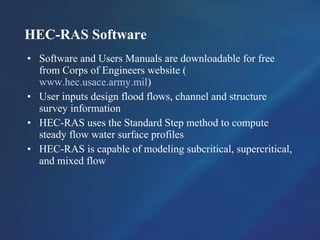
This document provides an overview of hydrology and hydraulic considerations for bridge design. It discusses calculating design discharges using USGS reports, collecting channel and bridge characteristics through field surveys, performing hydraulic analysis using HEC-RAS software, meeting requirements of the National Flood Insurance Program, analyzing scour, and ODOT submittal requirements. The key steps involve estimating flood flows, modeling water surface profiles, evaluating flood risks and impacts, and designing protections against scour.
Types- selection of the suitable site for the diversion headwork components
of diversion headwork- Causes of failure of structure on pervious foundation- Khosla’s theory- Design of concrete sloping
glacis weir.
Types- selection of the suitable site for the diversion headwork components
of diversion headwork- Causes of failure of structure on pervious foundation- Khosla’s theory- Design of concrete sloping
glacis weir.
Concrete Gravity Dam Components
A gallery is a small passage in a dam for providing an access to the interior of the dam.
The gallery is usually rectangular in shape with its top and bottom either flat or semi circular.
For a gallery with its top and bottom flat, it is necessary that all the corners should be rounded. The width of gallery generally varies from 1.5 to 1.8 m. The height of the gallery in between 2.2 to 2.4 m, so that a person can easily walk inside it.
To provide drainage of the dam section.
2. To provide space for equipment required for drilling holes and grouting the hole to form a grout curtain in the foundation.
3. To provide space for header and return pipes for post cooling of concrete.
4. A gallery provide an access to the interior of the dam for inspection ard maintenance.
5. A Gallery also provides space for installing various instruments in the dam to study its structural behaviour.
6. A gallery can provide space for the mechanical and electrical equipment required for the operation of gates for spillways and outlets.
A shaft is a vertical opening provided in a dam. Shafts are required for locating headers of the post cooling system and for locating measuring devices.
Shafts are also required for the movement of elevators and the hoisting equipment. Sometimes shafts are constructed inclined to connect two galleries or the same gallery at two different elevations by a staircase or a lift arrangement.
A plumb line shaft is constructed at the maximum section of the dam to make observations of the deflection of the dam under loads.
A plumb bob is suspended by a wire fixed at the top of the shaft. As the dam deflects relative to the base, the plumb bob also moves by the same amount.
A stilling well shaft is a special shaft used to record fluctuations of the water level in the reservoir. The shaft is connected to the reservoir at a point below the minimum reservoir level.
There is a floating mechanism in the stilling well shaft which records fluctuations in the water level.
The spillway in a gravity dam is called overflow section. Spillway is provided to dispose of surplus water from the reservoir to the downstream.
Spillways are provided for all dams as a safety measure against overtopping and the consequent damages, and failure. spillway may be located either in the middle of the dam or at the end of the dam near abutment.
It must have adequate discharge capacity.
It must be hydraulically and structurally safe.
The surface of the spillway must be erosion resistant.
It should be provided with some device for the dissipation of excess energy
The portion of the gravity dam other than the spillway is a non-overflow section, a road is located on the non-overflow section of the dam.
At the one end of a gravity dam a power house is located. Water from the reservoir passes tnrough penstock and rotates the turbine provided at power elevations to produce electricity.
Water flowing over a spillway has a ver
Introduction, Term related to reservoir planning (Yield, Reservoir planning and operation curves, Reservoir storage, Reservoir clearance), Investigation for reservoir planning, Significance of mass curve and demand curves, Applications of mass-curve and demand curves, Fixation of reservoir capacity from annual inflow and outflow, Fixation of reservoir capacity.
Topics:
1. Types of Diversion Head Works
2. Weirs and Barrages
3. Layout Diversion Head Works
4. Causes of Failures of Weirs and Barrages on Permeable Foundations
5. Silt Ejectors and Silt Excluders
Reservoir Planning: Introduction; Investigations for reservoir planning; Selection of site for a reservoir; Zones of storage in a reservoir; Storage capacity and yield; Mass inflow curve and demand curve; Calculation of reservoir capacity for a specified yield from the mass inflow curve; Determination of safe yield from a reservoir of a given capacity; Sediment flow in streams; Life of reservoir; Reservoir sediment control; flood routing. Various types of Spillways and design.
This is a presentation on various hydraulic structures and their uses and cross sections which will help a person to get acquainted with the most important hydraulic structures that are in use in this current world.
HEC-RAS is a computer program that models the hydraulics of water flow through natural rivers and other channels. The program is one-dimensional, meaning that there is no direct modeling of the hydraulic effect of cross section shape changes, bends, and other two- and three-dimensional aspects of flow. The program was developed by the US Department of Defense, Army Corps of Engineers in order to manage the rivers, harbors, and other public works under their jurisdiction; it has found wide acceptance by many others since its public release in 1995.
IPWEA Groundwater Separation Distances - Jun 17 - UrbAquaRichard Connell
Draft IPWEA Specification - Separation Distances for Groundwater Controlled Urban Development. Presented by Helen Brookes from UrbAqua at Engineers Australia WA - June 2017
ICLR Friday Forum: Modelling of Future Flood Risk Across Canada (May 31, 2019)glennmcgillivray
On May 31, 2019, ICLR conducted a Friday Forum webinar lead by Dr. Slobodan Simonovic of Western University titled 'Modelling of Future Flood Risk Across Canada Under Climate Change.'
Climate change has induced changes in key climate variables and the hydrological cycle across Canada. With continuous emission of greenhouse gases, this trend is expected to continue over the 21st century and beyond. In this study, a macro-scaled hydrodynamic model is used to simulate 25 km resolution daily streamflow across Canada for historical (1961-2005) and future (2061-2100) timelines.
Future projections from 21 GCMs following four Representative Concentration Pathways (RCPs) were used for the analysis. Changes in the frequency and magnitude of historical 100-year and 250-year return period flood events and month of occurrence of peak flow are analyzed. Results obtained from uncertainty analysis for both return period flood events found that flood frequency will increase in most of the northern Canada, southern Ontario, southern British Columbia, northern Alberta, Manitoba and Saskatchewan. However, northern British Columbia, northern Ontario, Manitoba and northeastern Quebec will be facing decrease in flood frequency. Results indicate that 40%-60% of Canada’s 100 most populated cities including many prominent cities such as Toronto and Montreal are high at risk of increased riverine flooding under climate change.
Slobodan P. Simonovic is Professor of Civil and Environmental Engineering at the University of Western Ontario and Director of Engineering Studies at ICLR. Prof. Simonovic is globally recognized for his unique interdisciplinary research in Systems Analysis and has over 500 professional publications and three major textbooks. Prof. Simonovic was inducted to the Canadian Academy of Engineering in June of 2013.
Features:
View watershed boundary and drainage network, and contour map layers
Find area of a selected watershed
View ground profile along and across the stream path
View existing water conservation structures along with photo
Manage watershed structures
Add Water Conservation Structure
Change Status of Structure (Proposed, Under Progress, Completed)
Technology
Google Maps API
Google Elevation API
Google Fusion Tables (for polyline and polygon data)
ASP.NET, SQL Server 2008 (for point data)
RV 2015: If You Build It, Will it Flood? Climate Change Vulnerabilities and S...Rail~Volution
Extreme weather events, flooding and rising sea levels devastate communities, destroy or severely damage costly infrastructure, and introduce a strong element of uncertainty in current and future planning. This new normal spotlights how and where we build new -- or strengthen existing -- infrastructure and communities and the governance systems that manage and regulate these decisions and investments. Hear experts tackle these issues, from Hurricane Sandy to sea level rise in the Bay Area. What are the weak links in terms of existing infrastructure, cross-jurisdictional government response systems and disaster preparedness? Learn about state guidelines and legislation. Discuss how transportation agencies deal with major transit infrastructure challenges. Discover the role of natural systems in protecting critical transit infrastructure
Moderator: Allison Brooks, Executive Director, Bay Area Regional Collaborative, Oakland, California
Eric Fang, AIA, AICP, LEED AP, Associate Principal, EE&K, a Perkins Eastman Company, New York, New York
Projjal Dutta, AIA, LEED AP, Director, Sustainability Initiatives, Metropolitan Transportation Authority, New York, New York
James Allison, Manager of Planning, Capitol Corridor Joint Powers Authority, Oakland, California
JR DeLaRosa, Special Assistant for Climate Change, California Natural Resources Agency, Sacramento, California
Numerical modeling in support of the characterization and remediation of impacted sediments can be a challenging task, particularly in environments where multiple physical processes influence sediment fate and transport. The interaction of various controls is particularly complex in estuarine settings, where riverine input, water levels, waves, and other coastal processes combine to create a seasonally dynamic environment. Modeling of such environments requires a comprehensive and integrated approach such that the effects of each process can be assessed individually, as these processes can be allowed to interact to reproduce the natural environment as faithfully as possible
Approach and Activities
This contribution describes the development and calibration of an integrated Delft3D numerical model that includes flow, sediment transport, wave processes, and vegetation. The model boundary conditions are based on data collected during a comprehensive field program. Field data were also used to calibrate various model input parameters (such as bed and vegetation roughness). The model was used to understand erosion and deposition during both low and high flow regimes, and thus to aid in understanding important controls on sedimentary dynamics during these predominant regimes.
Results and Lessons Learned
The integrated numerical model predictions capture important sedimentation, erosion, velocity, and water level patterns. Model predictions indicate that during periods of low riverine input, velocity patterns and sediment transport associated with periodic water level changes dominate. During riverine flood conditions flow and sedimentation patterns are controlled by the river itself. Integrated modeling of this setting, including calibration to field data provides a valuable tool for assessment of future conditions, and thus for remediating impacted sediments.
Flood plains to floor drains design standard adaptation for urban flood risk ...Robert Muir
Presented to Flood Master Class by Insurance Business Magazine this presentation examines quantitative risk assessment of riparian, overland and wastewater (sanitary) sewer system flooding. Analysis of City of Toronto and City of Markham historical flooding is shown to be highly correlated to design standard limitations related to the era of construction. Risks are shown to extend over a range of scales from floodplain (river) to flood drain (homes) based on detailed GIS spatial analysis. Flood risk mitigation measures are presented to achieve design standard adaptation in local areas with specific limitations.
Student information management system project report ii.pdfKamal Acharya
Our project explains about the student management. This project mainly explains the various actions related to student details. This project shows some ease in adding, editing and deleting the student details. It also provides a less time consuming process for viewing, adding, editing and deleting the marks of the students.
CFD Simulation of By-pass Flow in a HRSG module by R&R Consult.pptxR&R Consult
CFD analysis is incredibly effective at solving mysteries and improving the performance of complex systems!
Here's a great example: At a large natural gas-fired power plant, where they use waste heat to generate steam and energy, they were puzzled that their boiler wasn't producing as much steam as expected.
R&R and Tetra Engineering Group Inc. were asked to solve the issue with reduced steam production.
An inspection had shown that a significant amount of hot flue gas was bypassing the boiler tubes, where the heat was supposed to be transferred.
R&R Consult conducted a CFD analysis, which revealed that 6.3% of the flue gas was bypassing the boiler tubes without transferring heat. The analysis also showed that the flue gas was instead being directed along the sides of the boiler and between the modules that were supposed to capture the heat. This was the cause of the reduced performance.
Based on our results, Tetra Engineering installed covering plates to reduce the bypass flow. This improved the boiler's performance and increased electricity production.
It is always satisfying when we can help solve complex challenges like this. Do your systems also need a check-up or optimization? Give us a call!
Work done in cooperation with James Malloy and David Moelling from Tetra Engineering.
More examples of our work https://www.r-r-consult.dk/en/cases-en/
Automobile Management System Project Report.pdfKamal Acharya
The proposed project is developed to manage the automobile in the automobile dealer company. The main module in this project is login, automobile management, customer management, sales, complaints and reports. The first module is the login. The automobile showroom owner should login to the project for usage. The username and password are verified and if it is correct, next form opens. If the username and password are not correct, it shows the error message.
When a customer search for a automobile, if the automobile is available, they will be taken to a page that shows the details of the automobile including automobile name, automobile ID, quantity, price etc. “Automobile Management System” is useful for maintaining automobiles, customers effectively and hence helps for establishing good relation between customer and automobile organization. It contains various customized modules for effectively maintaining automobiles and stock information accurately and safely.
When the automobile is sold to the customer, stock will be reduced automatically. When a new purchase is made, stock will be increased automatically. While selecting automobiles for sale, the proposed software will automatically check for total number of available stock of that particular item, if the total stock of that particular item is less than 5, software will notify the user to purchase the particular item.
Also when the user tries to sale items which are not in stock, the system will prompt the user that the stock is not enough. Customers of this system can search for a automobile; can purchase a automobile easily by selecting fast. On the other hand the stock of automobiles can be maintained perfectly by the automobile shop manager overcoming the drawbacks of existing system.
Sachpazis:Terzaghi Bearing Capacity Estimation in simple terms with Calculati...Dr.Costas Sachpazis
Terzaghi's soil bearing capacity theory, developed by Karl Terzaghi, is a fundamental principle in geotechnical engineering used to determine the bearing capacity of shallow foundations. This theory provides a method to calculate the ultimate bearing capacity of soil, which is the maximum load per unit area that the soil can support without undergoing shear failure. The Calculation HTML Code included.
Water scarcity is the lack of fresh water resources to meet the standard water demand. There are two type of water scarcity. One is physical. The other is economic water scarcity.
Democratizing Fuzzing at Scale by Abhishek Aryaabh.arya
Presented at NUS: Fuzzing and Software Security Summer School 2024
This keynote talks about the democratization of fuzzing at scale, highlighting the collaboration between open source communities, academia, and industry to advance the field of fuzzing. It delves into the history of fuzzing, the development of scalable fuzzing platforms, and the empowerment of community-driven research. The talk will further discuss recent advancements leveraging AI/ML and offer insights into the future evolution of the fuzzing landscape.
TECHNICAL TRAINING MANUAL GENERAL FAMILIARIZATION COURSEDuvanRamosGarzon1
AIRCRAFT GENERAL
The Single Aisle is the most advanced family aircraft in service today, with fly-by-wire flight controls.
The A318, A319, A320 and A321 are twin-engine subsonic medium range aircraft.
The family offers a choice of engines
Explore the innovative world of trenchless pipe repair with our comprehensive guide, "The Benefits and Techniques of Trenchless Pipe Repair." This document delves into the modern methods of repairing underground pipes without the need for extensive excavation, highlighting the numerous advantages and the latest techniques used in the industry.
Learn about the cost savings, reduced environmental impact, and minimal disruption associated with trenchless technology. Discover detailed explanations of popular techniques such as pipe bursting, cured-in-place pipe (CIPP) lining, and directional drilling. Understand how these methods can be applied to various types of infrastructure, from residential plumbing to large-scale municipal systems.
Ideal for homeowners, contractors, engineers, and anyone interested in modern plumbing solutions, this guide provides valuable insights into why trenchless pipe repair is becoming the preferred choice for pipe rehabilitation. Stay informed about the latest advancements and best practices in the field.
Welcome to WIPAC Monthly the magazine brought to you by the LinkedIn Group Water Industry Process Automation & Control.
In this month's edition, along with this month's industry news to celebrate the 13 years since the group was created we have articles including
A case study of the used of Advanced Process Control at the Wastewater Treatment works at Lleida in Spain
A look back on an article on smart wastewater networks in order to see how the industry has measured up in the interim around the adoption of Digital Transformation in the Water Industry.
Cosmetic shop management system project report.pdfKamal Acharya
Buying new cosmetic products is difficult. It can even be scary for those who have sensitive skin and are prone to skin trouble. The information needed to alleviate this problem is on the back of each product, but it's thought to interpret those ingredient lists unless you have a background in chemistry.
Instead of buying and hoping for the best, we can use data science to help us predict which products may be good fits for us. It includes various function programs to do the above mentioned tasks.
Data file handling has been effectively used in the program.
The automated cosmetic shop management system should deal with the automation of general workflow and administration process of the shop. The main processes of the system focus on customer's request where the system is able to search the most appropriate products and deliver it to the customers. It should help the employees to quickly identify the list of cosmetic product that have reached the minimum quantity and also keep a track of expired date for each cosmetic product. It should help the employees to find the rack number in which the product is placed.It is also Faster and more efficient way.
Vaccine management system project report documentation..pdfKamal Acharya
The Division of Vaccine and Immunization is facing increasing difficulty monitoring vaccines and other commodities distribution once they have been distributed from the national stores. With the introduction of new vaccines, more challenges have been anticipated with this additions posing serious threat to the already over strained vaccine supply chain system in Kenya.
2. Bridge Hydraulics Overview
Topics for this presentation:
Item 1 – Design discharges (Hydrology)
Item 2 – Channel & Bridge Characteristics
Item 3 – Hydraulic Analysis using HEC-RAS
Item 4 – National Flood Insurance Program
Item 5 – Scour Analysis & Channel Protection
Item 6 – ODOT Submittal Requirements
3. Item 1: Hydrology
Two primary methods used by ODOT to calculate
flood discharges:
• USGS report 89-4126 (rural)
• USGS report 93-135 (small urban)
4. USGS Report 89-4126:
Techniques for Estimating Flood-
Peak Discharges of Rural,
Unregulated Streams in Ohio
• Provides multiple-regression equations to calculate
discharges for gaged and ungaged streams
• Provides a method to adjust discharges for gaged
streams
• Contains data from streamflow gaging stations
7. Supplement to the Gazetteer
• Useful for calculating
larger drainage areas
• Available from ODNR,
listed as an “out of
print” publication on
website
12. Discharge Calculation for Ungaged Stream:
The Region C multiple-regression equation for 100-year
flood peak discharges is chosen:
Q100 = (RC)(CONTDA)0.756
(SLOPE)0.285
(STORAGE+1)-0.363
Basic characteristics for the ungaged site are determined:
CONTDA = 0.290 square miles
SLOPE = 93.0 feet per mile
STORAGE = 0.0 percent
These values are substituted into the Region C equation:
Q100 = 236(0.290)0.756
(93.0)0.285
(0.0+1)-0.363
Q100 = 337 cubic feet per second
13. Confirm Suitability of Rural Equations
• Check basin characteristics with ranges for region
• Characteristics outside range occur infrequently
14. Use of Gaging Station Data
• For ungaged sites on gaged streams
• Confirm that drainage basin is rural and stream is
unregulated
• Site can be upstream or downstream of gauging station
• Results of regression equations are adjusted to agree with
data from nearby gaging stations
15. Peakflow Software
• Applies regression equations
• Performs gauging station adjustments
• Download from ODOT website
16. USGS Report 93-135:
Estimation of Peak-Frequency
Relations, Flood Hydrographs, and
Volume-Duration-Frequency
Relations of Ungaged Small Urban
Streams in Ohio
• Procedure similar to that used for rural streams
• Equations are not suitable for all urban streams
• Q = f (Area, Slope, BDF)
17. Basin Development Factor (BDF):
• A measure of urban development within a drainage basin
0 = No development
12 = Maximum development
• Divide basin into three subdivisions
• Estimate development in each subdivision
19. Confirm Suitability of Urban Equations
120BDF
41.231.5Precipitation
4.090.026Drainage Area
MaximumMinimum
Basin
Characteristics
20. Other Sources for Discharge Estimates
• HUD Flood Insurance Studies
• U.S. Corps of Engineers Flood Studies
• U.S. Soil Conservation Studies
• Agencies responsible for flood control facilities
(regulated streams)
21. ODOT Design Discharges
Design Flood Frequency:
Freeways/Controlled Access Facilities 50 years
Other Highways (≥2000 ADT) 25 years
Other Highways (<2000 ADT) 10 years
23. Field Survey for Waterway Crossings
• Used to obtain channel cross-section data and establish
roughness coefficients (“n” values)
• Photographs are required
• Determine and document nature of upstream property
• Assess flood potential and Headwater controls
• Look for evidence of scour
24. Channel Cross-Sections
• Number of sections depends on uniformity of channel
• Locate sections where bed profile, channel width or
depth, or roughness change abruptly
• Orientation perpendicular to direction of flow
27. FHWA-TS-84-204:
Guide for Selecting Manning's
Roughness Coefficients
for Natural Channels and Flood
Plains
(http://www.fhwa.dot.gov/bridge/wsp2339.pdf)
28. U.S.G.S Water Supply Paper 1849
(Available online, link found in
HEC-RAS help menu)
http://wwwrcamnl.wr.usgs.gov/sws/fieldmethods/Indirects/nvalues/index.htm
29. Item 3 – Hydraulic Analysis
HEC-RAS Software – US Army Corps of Engineers
(Hydraulic Engineering Center - River Analysis System).
30. • Software and Users Manuals are downloadable for free
from Corps of Engineers website (
www.hec.usace.army.mil)
• User inputs design flood flows, channel and structure
survey information
• HEC-RAS uses the Standard Step method to compute
steady flow water surface profiles
• HEC-RAS is capable of modeling subcritical, supercritical,
and mixed flow
HEC-RAS Software
31. Standard Step Method
• Also known as the “Step Backwater Method”
• Uses the Energy Equation and Manning’s Equation to
evaluate points along the water surface profile.
Basic Assumptions
1. Steady flow
2. Flow type constant between sections
3. Normal depths considered vertical depths
4. Level water surface across channel
5. Sediment and air entrainment are negligible
33. Defining flow data in HEC-RAS
Required input for steady flow analysis:
- Discharge at cross sections with a change in flow.
- Boundary condition
• Downstream Channel Slope (Used to calculate
Normal Depth)
• Known value (If available)
39. Allowable Backwater
• In general, the bridge should be designed to clear the
design frequency flood
• Meet NFIP (National Flood Insurance Program)
requirements
• Meet Conservancy District requirements
• Limited to 1-foot raise in 100-year backwater if outside
of NFIP jurisdiction (Ohio Revised Code, section
1521.13)
• Backwater should not be allowed to flood
“Unreasonably large areas of usable land”
• Backwater should not be increased in urban areas
40. Item 4 - National Flood Insurance Program
(NFIP)
• Most Ohio communities participate
• Each community adopts local ordinances
• Enforced by local floodplain coordinator
(see ODNR website for listing)
42. NFIP Compliance
• Obtain floodway map, flood insurance rate map, and
flood insurance study for site.
(All available on FEMA website)
• If the site falls within a special flood hazard area, any
construction must be approved by local floodplain
coordinator
• Obtain local floodplain ordinances for community
46. NFIP Compliance
Condition Requirement
Construction in
the floodway
Analysis showing that proposed condition will not
increase 100-year water surface elevations
Construction in
floodway fringe
Embankment is permitted in the floodway fringe
Construction in
Flood Hazard
Zone A
See local floodplain regulations for requirements
47. NFIP Compliance – HEC RAS Analysis
• Obtain original model used for FIS, if possible
• If original model cannot be obtained, use water
surface elevations and flow rates from FIS to initiate
analysis
• If flow rates and water surface elevations are
substantially different those based on the regression
equations, include both on the structure site plan
49. Item 5 – Scour Analysis and Channel Protection
Hydraulic Engineering Circular
No. 18 (HEC-18):
Evaluating Scour at Bridges
Published by FHWA
Best source of information on
scour analysis & countermeasures
50. Total Scour –three components:
1. Long term aggradation and degradation
2. Contraction scour
3. Local scour
51. Long-Term Aggradation and Degradation
• Not computed by HEC-RAS
• What is the long-term trend?
• Trends can change due to natural or man-made causes.
• Evaluate using HEC-18 before performing analysis
• ODOT District personnel and County Engineers are a good
source of information.
52. Contraction Scour
• Occurs when the flow area
of a stream is reduced by a
natural contraction or a
bridge restricting the flow
65. ODOT Scour Protection Requirements
• Deep foundations (piles or drilled shafts) or spread footings
in rock
• Spill-through earth slopes armored with rock channel
protection
– Minimum size and thickness of RCP given in
ODOT Bridge Design Manual
– Increase thickness of RCP outside portion of
curved channels or where ice flow is concern
67. Item 6 - ODOT Submittal Requirements:
Include a “Hydraulic Report” with the Structure
Type Study. This report should include:
1. Computation of flood flows
2. Hydraulic analysis of existing and proposed
structure (include both hard copy and HEC-RAS
files)
3. Information on NFIP floodmaps and flood
insurance studies referenced
4. Scour analysis of proposed structure
Editor's Notes
This presentation will cover Hydraulic Design of bridges.
Culverts will be covered in a later section.
The presentation will be divided into 6 general topics.
First topic is Hydrology, which is the determination of what volume of flow will pass through the bridge during storm events of various frequencies.
This will be a main focus of this presentation, because there is a lot of trivial information to know, and a common area for mistakes in submittals.
Two primary methods are used to calculate flood discharges: rural equations and urban equations.
Rural is used for the vast majority of bridge projects. Urban equations are used only for urban sites with drainage areas less than 4 square miles. (Covered in BDM)
This is a table showing the regression equations from report 89-4126.
The variables in the equations include drainage area, channel slope, and storage.
Interesting to note the standard error of the equations.
This graphic shows one method that can be used to calculate drainage areas for use in the regression equations.
Here, the drainage area is drawn on USGS quadrangle mapping, and the area is measured using a planimeter.
There are also a number of computer programs available to measure drainage areas
For larger areas, additional tools are available
The supplement to the gazetteer of Ohio streams can be used to help calculate drainage areas for bridge sites with large drainage areas.
Drainage areas on larger streams are tabulated at various points
Saves you from stringing multiple USGS quad maps.
Available from ODNR, can be ordered from website.