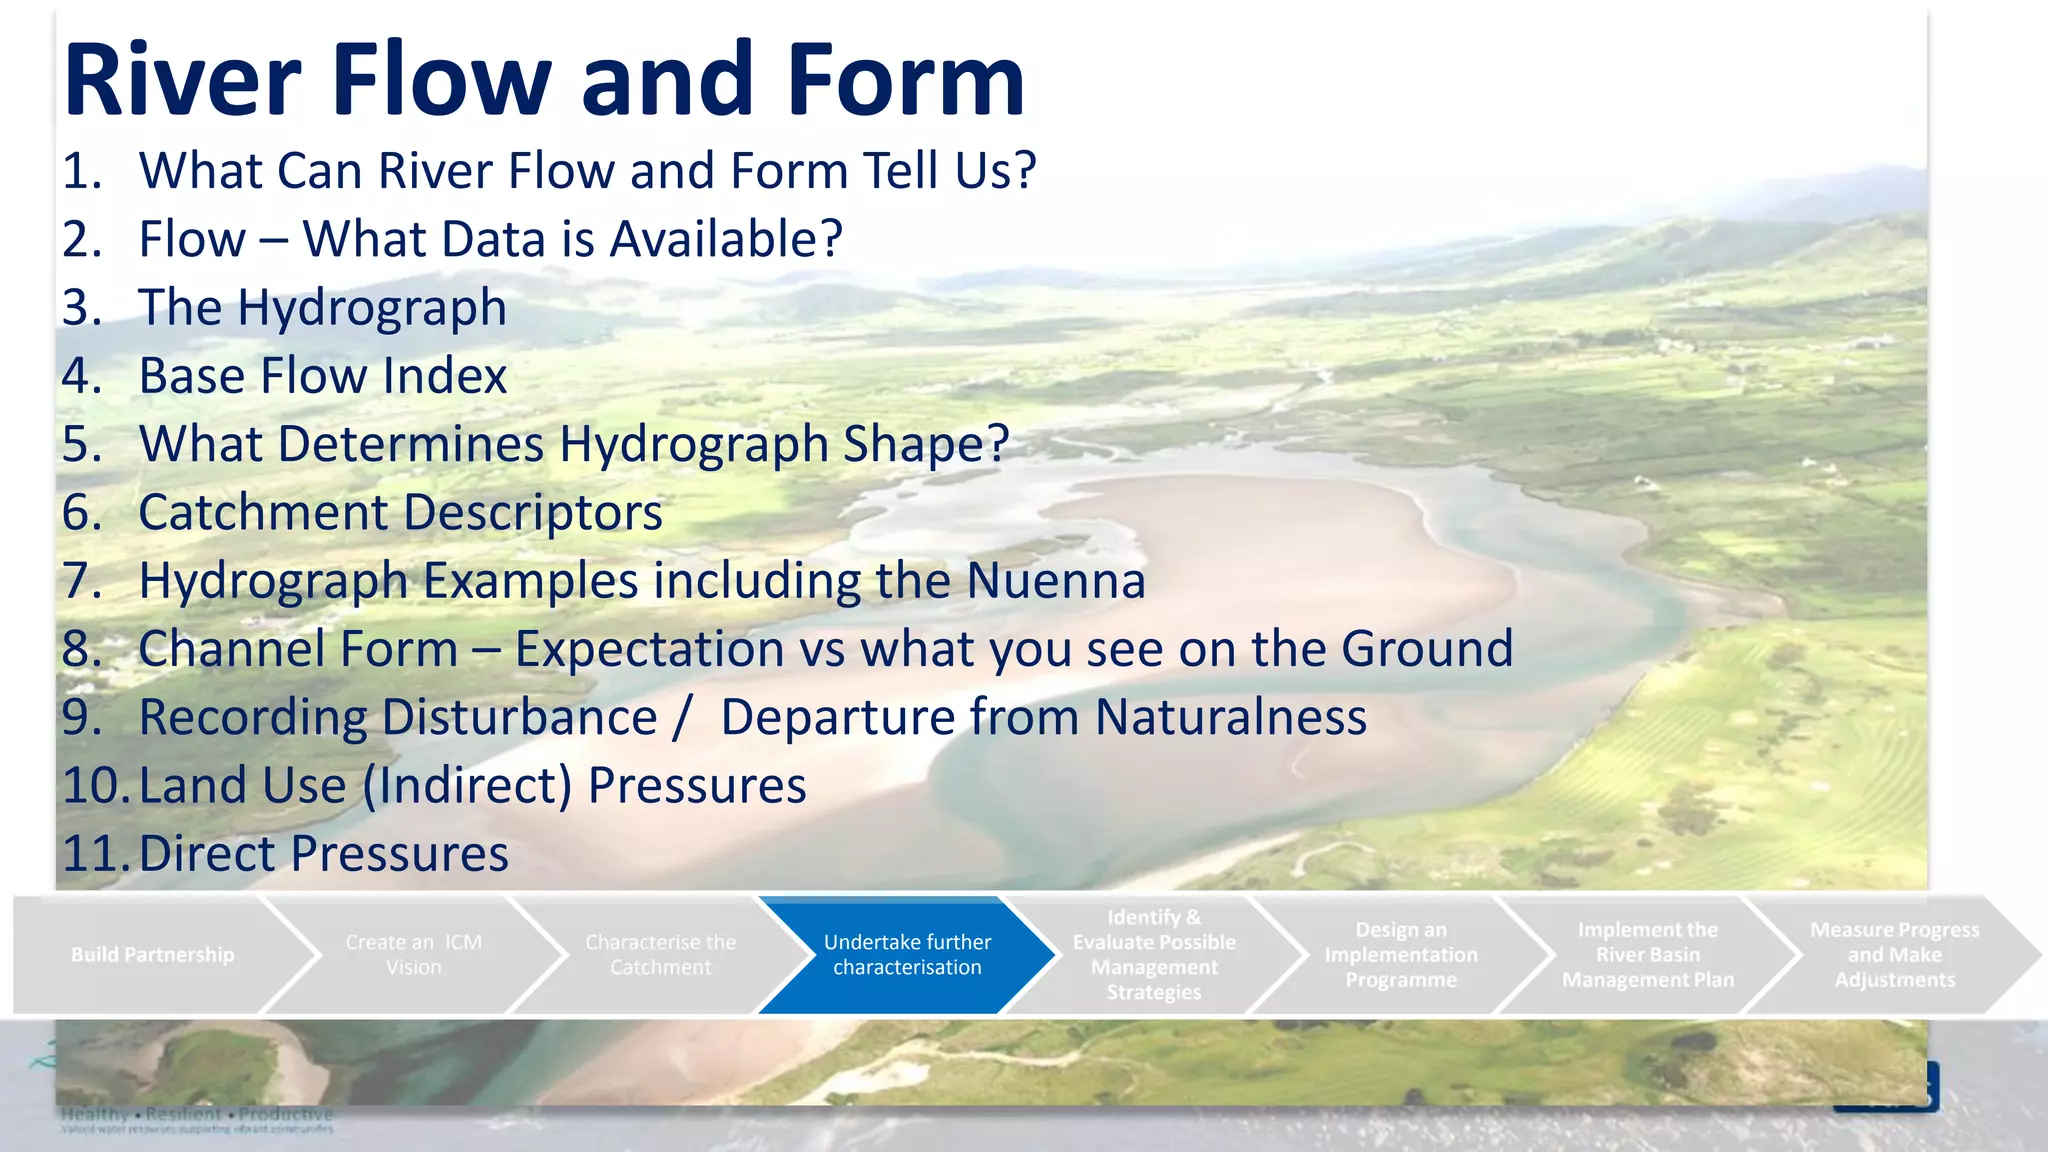
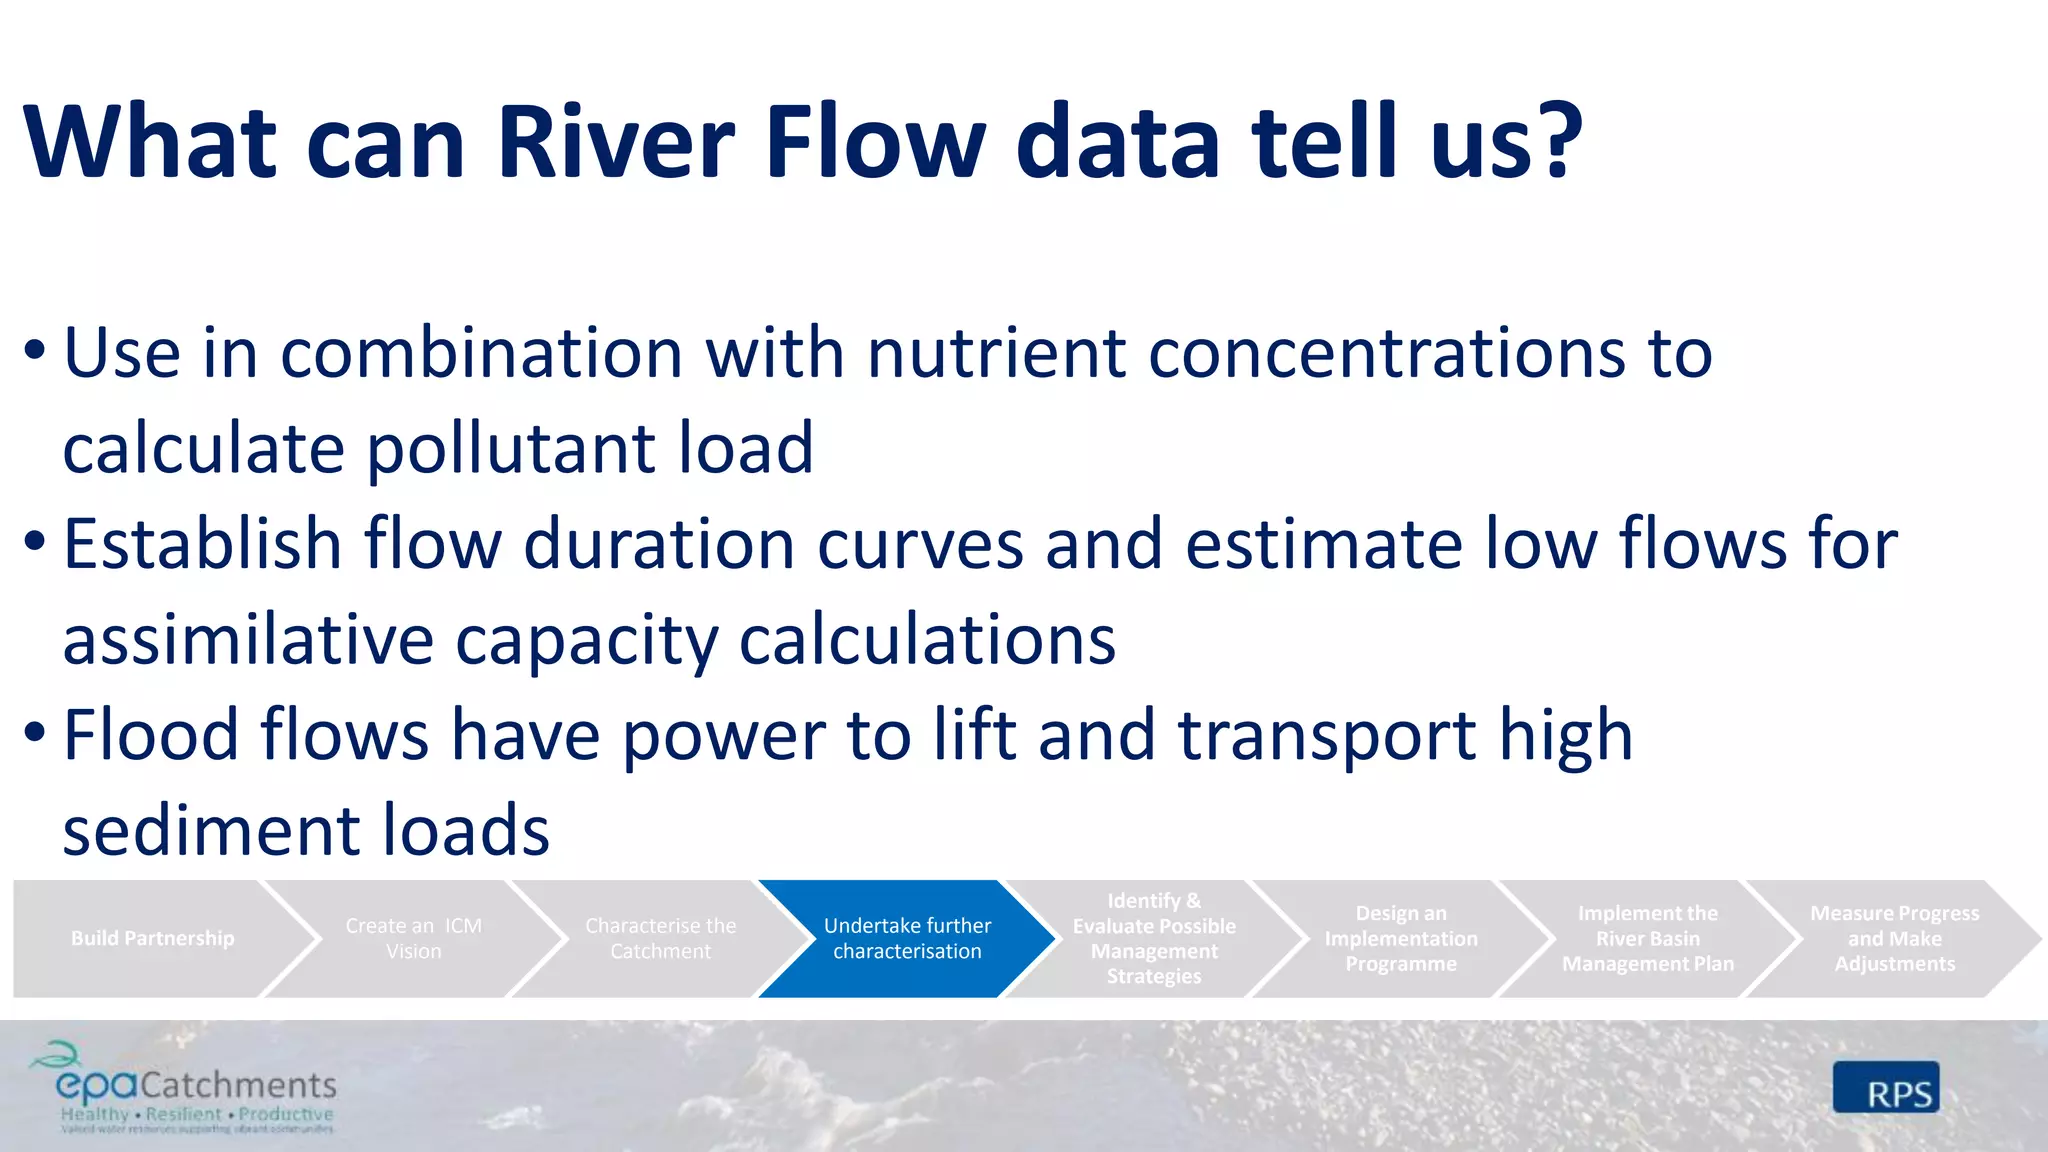
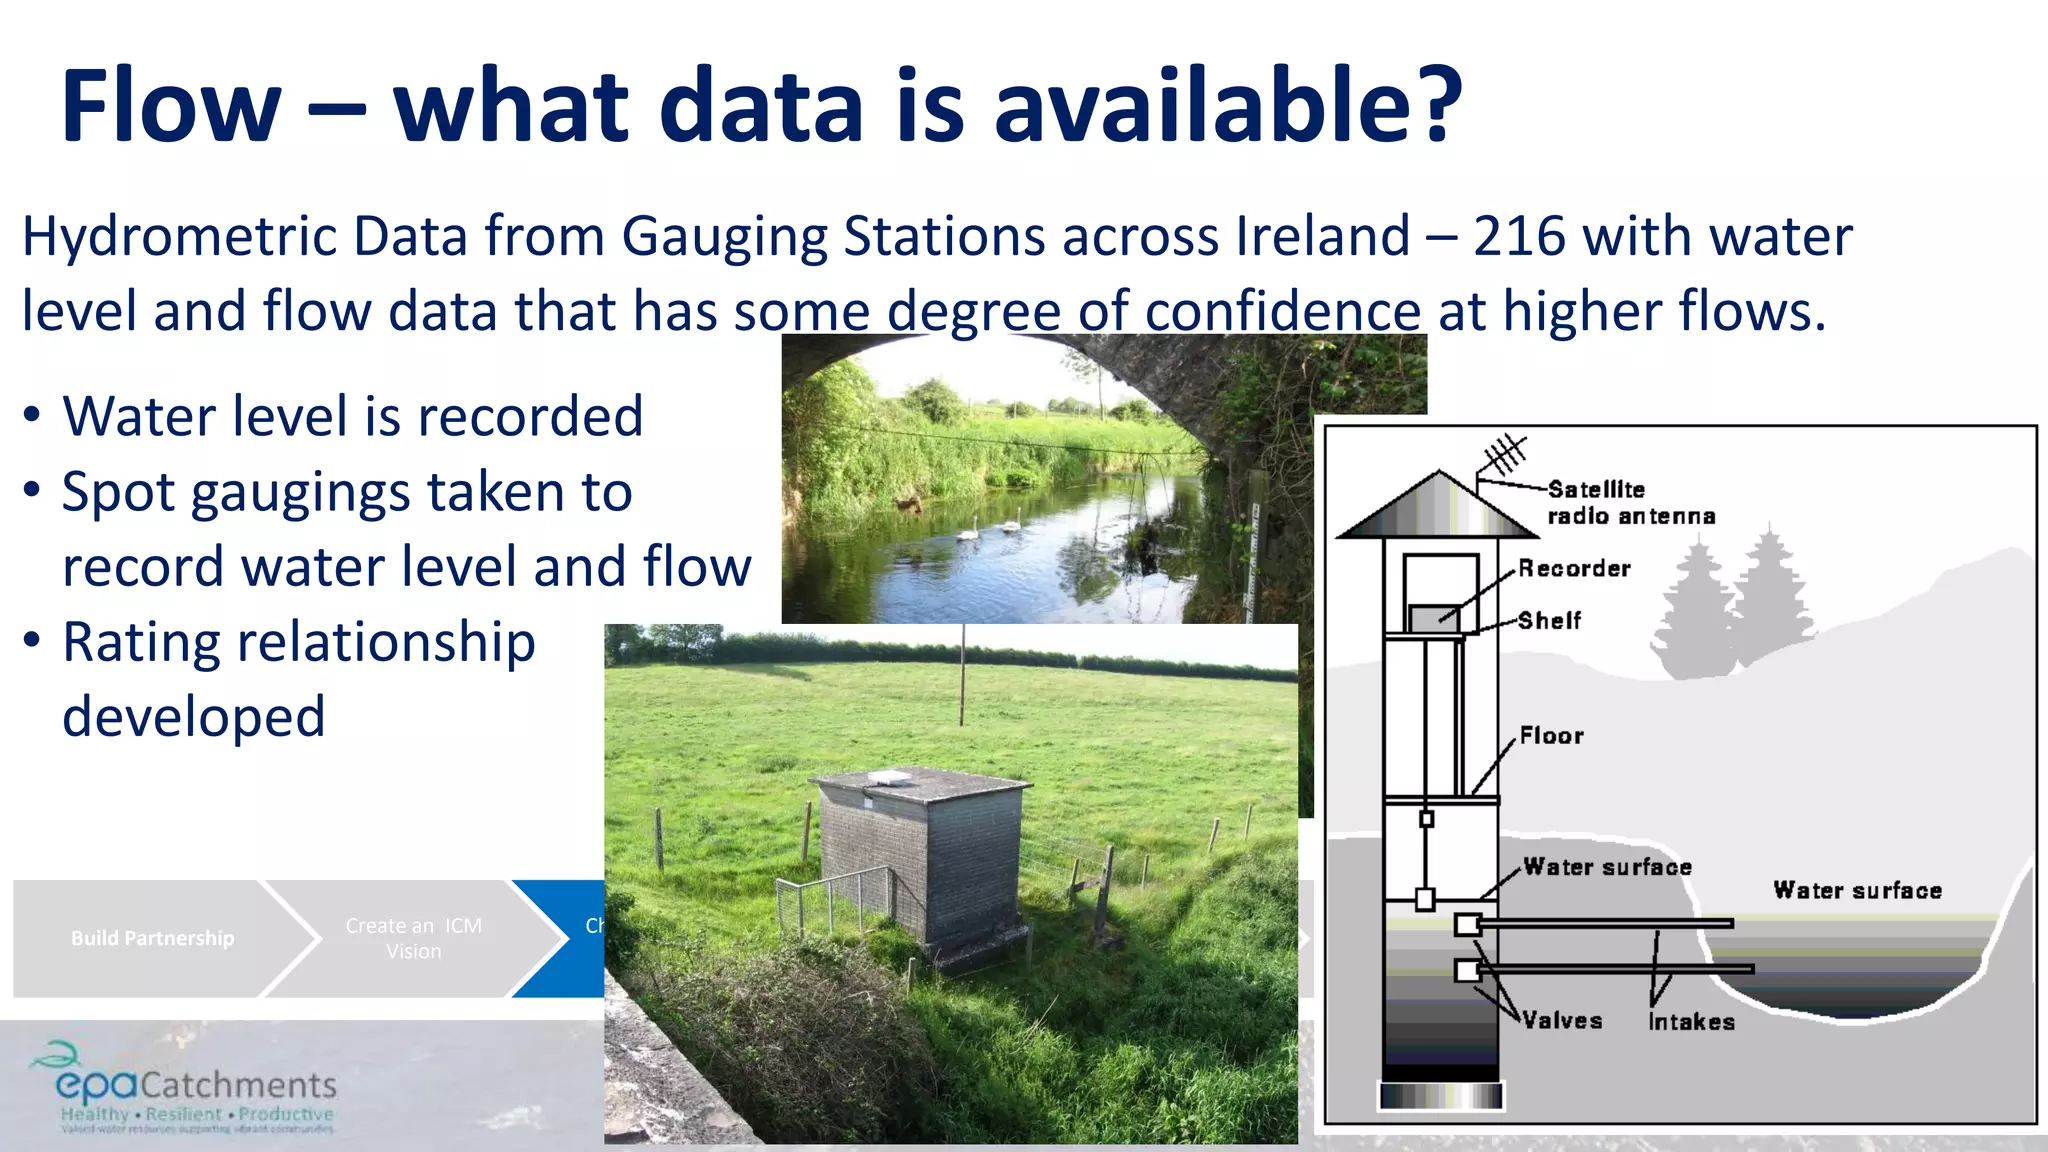
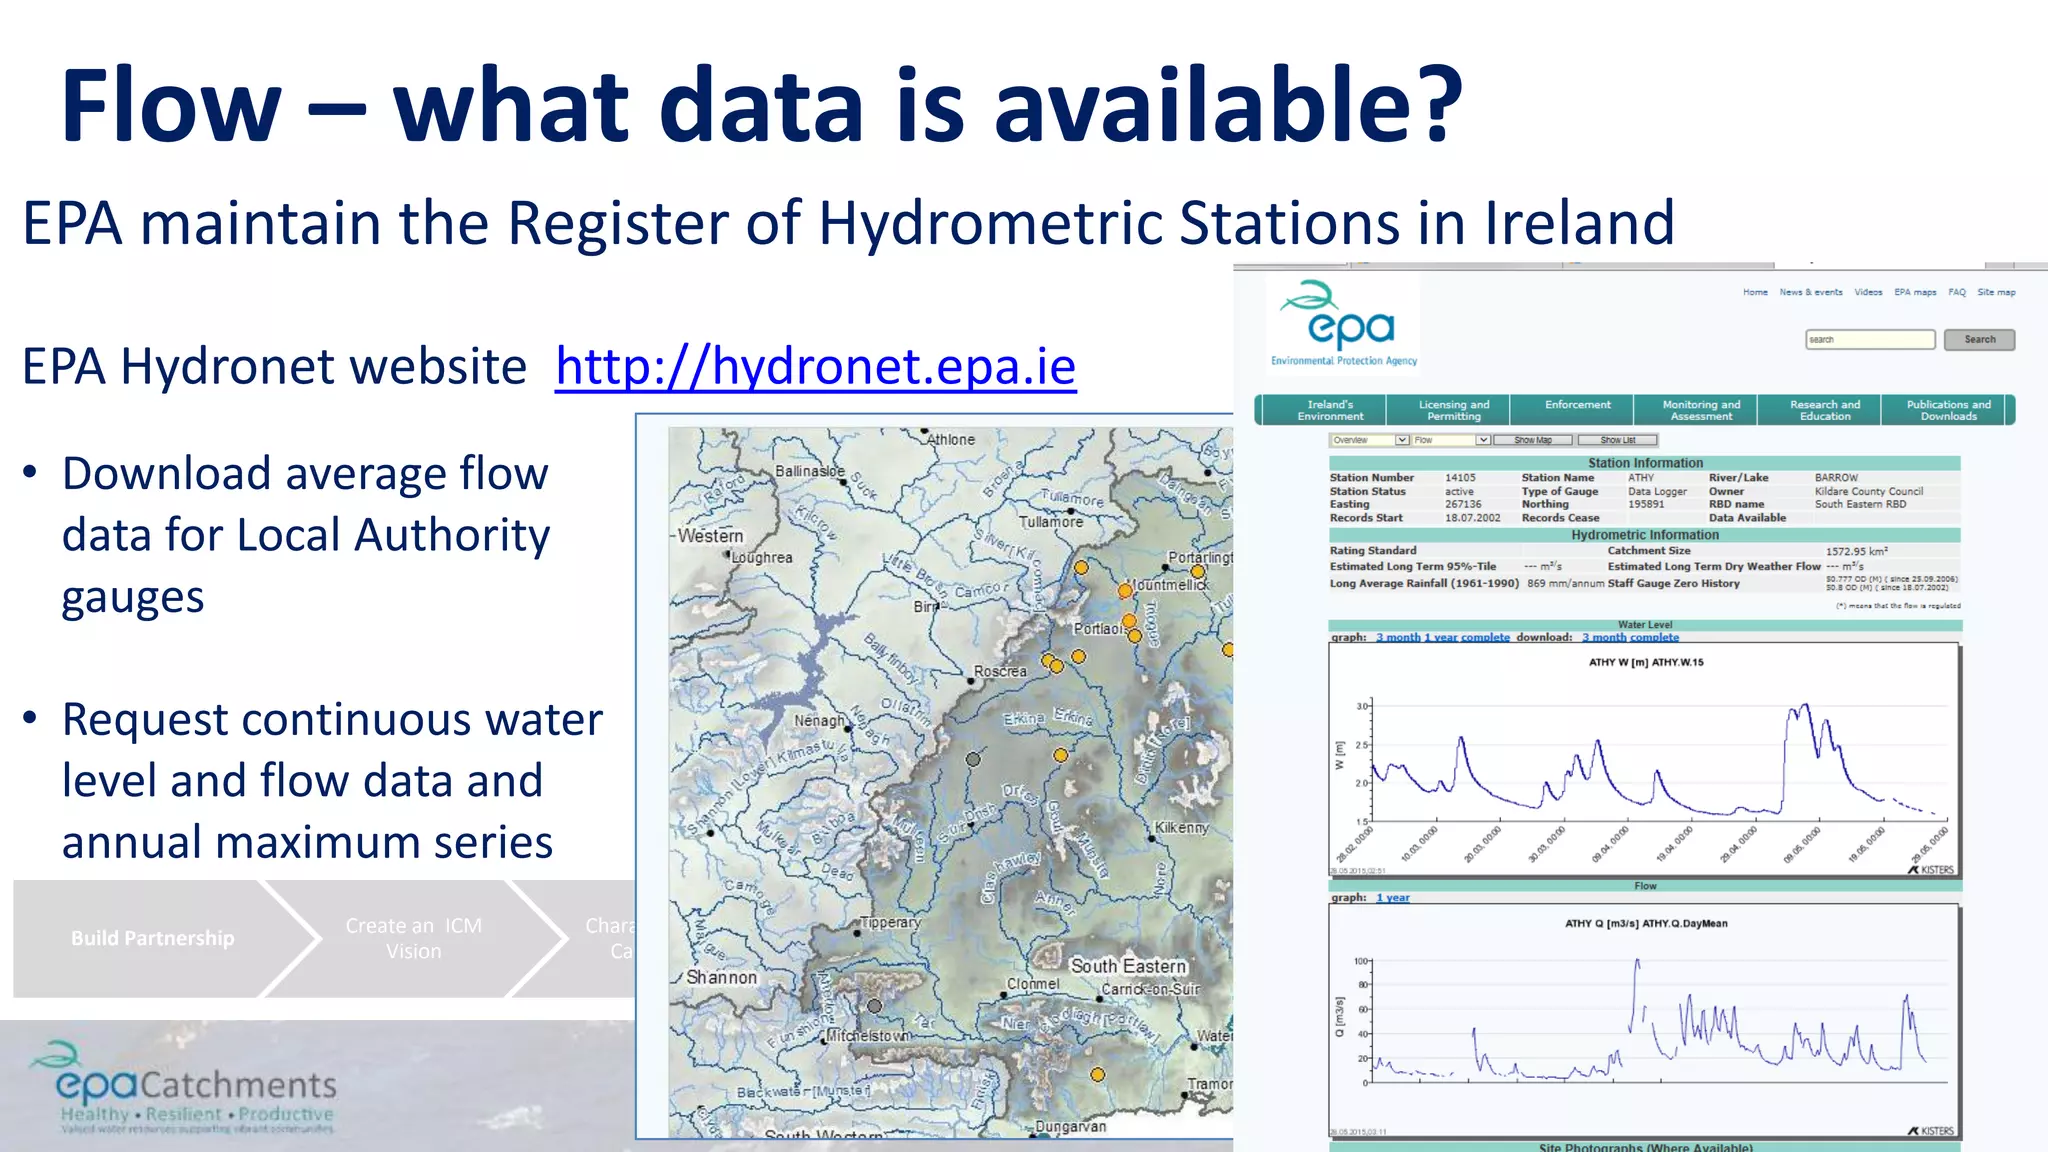
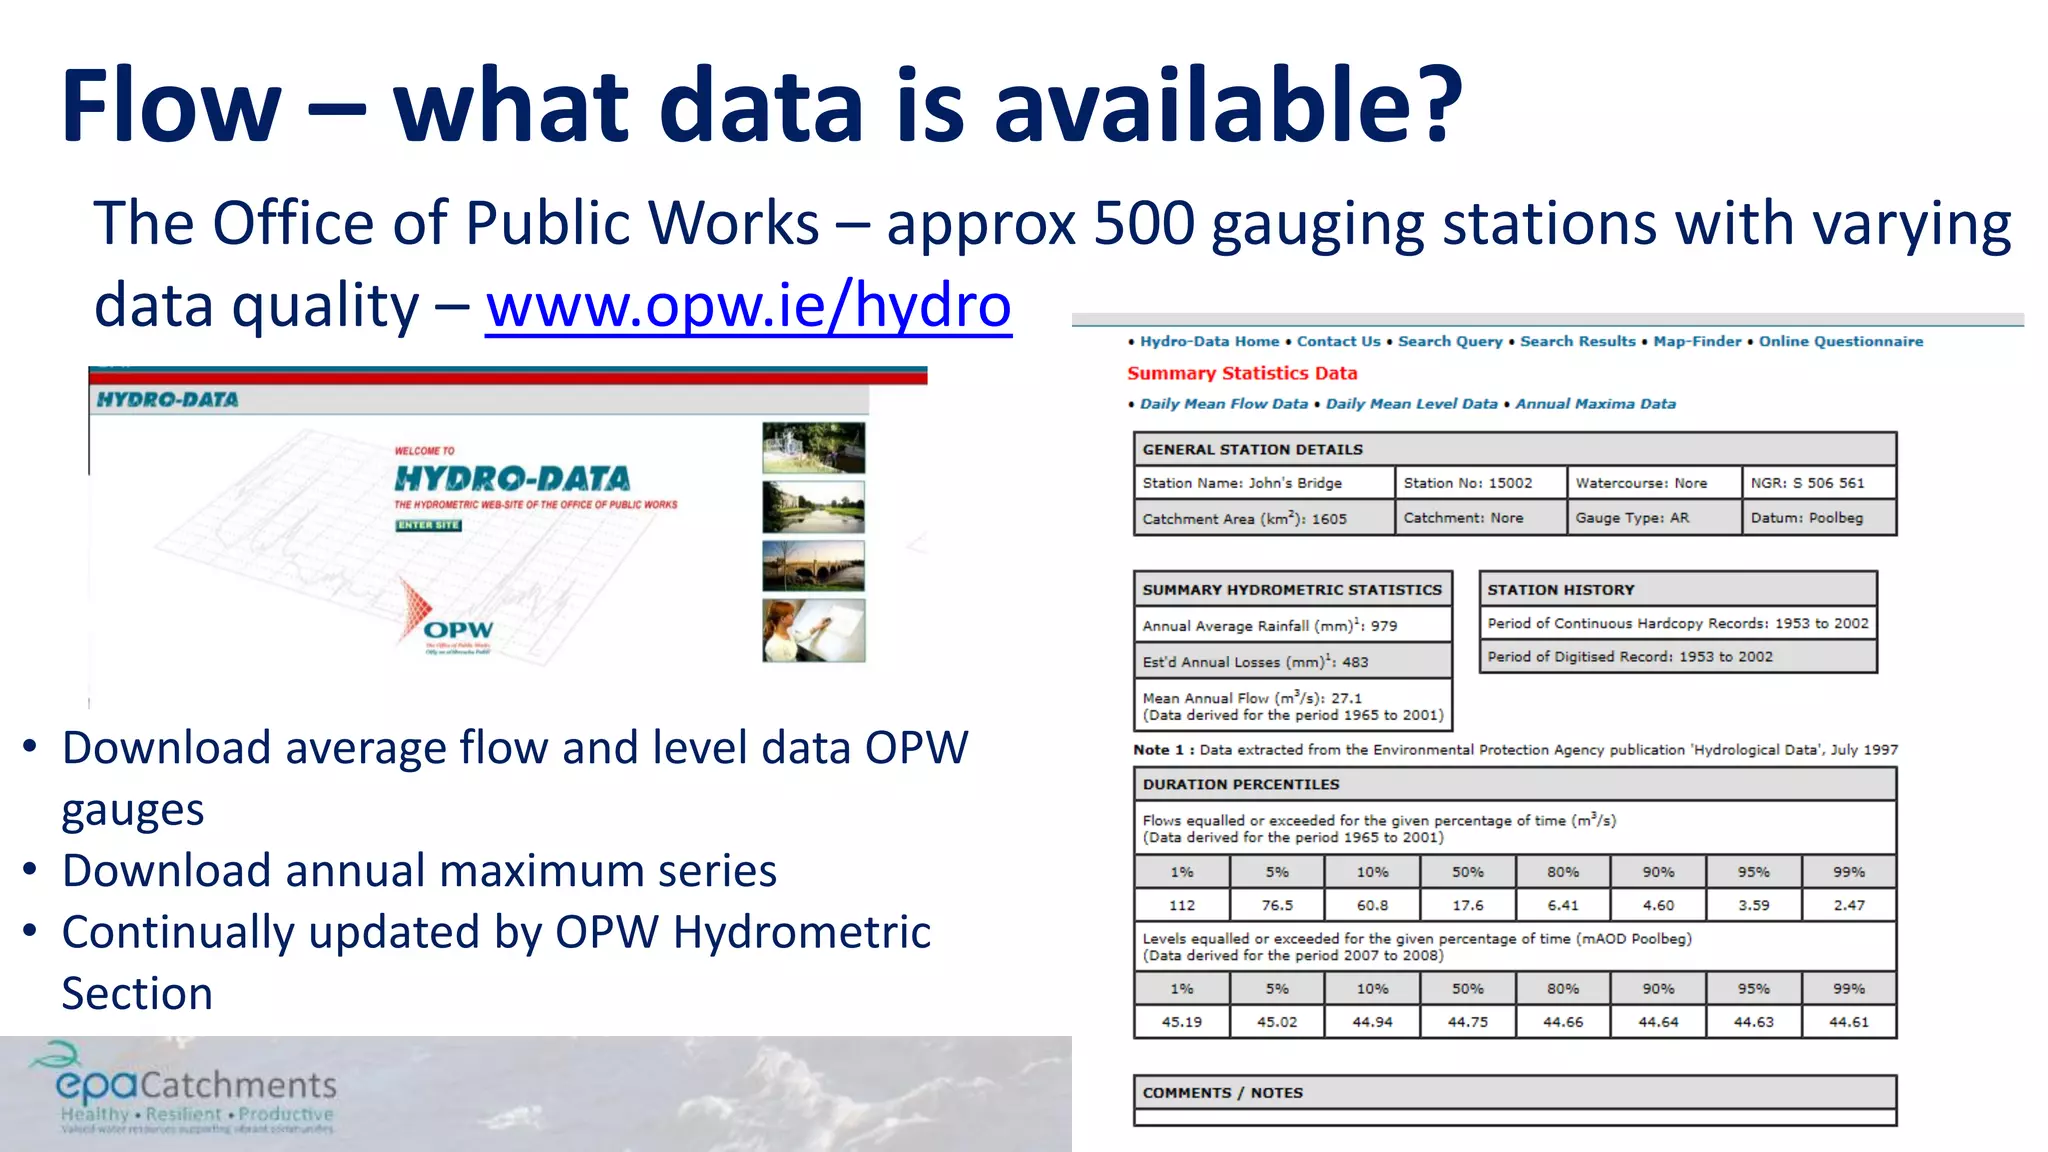
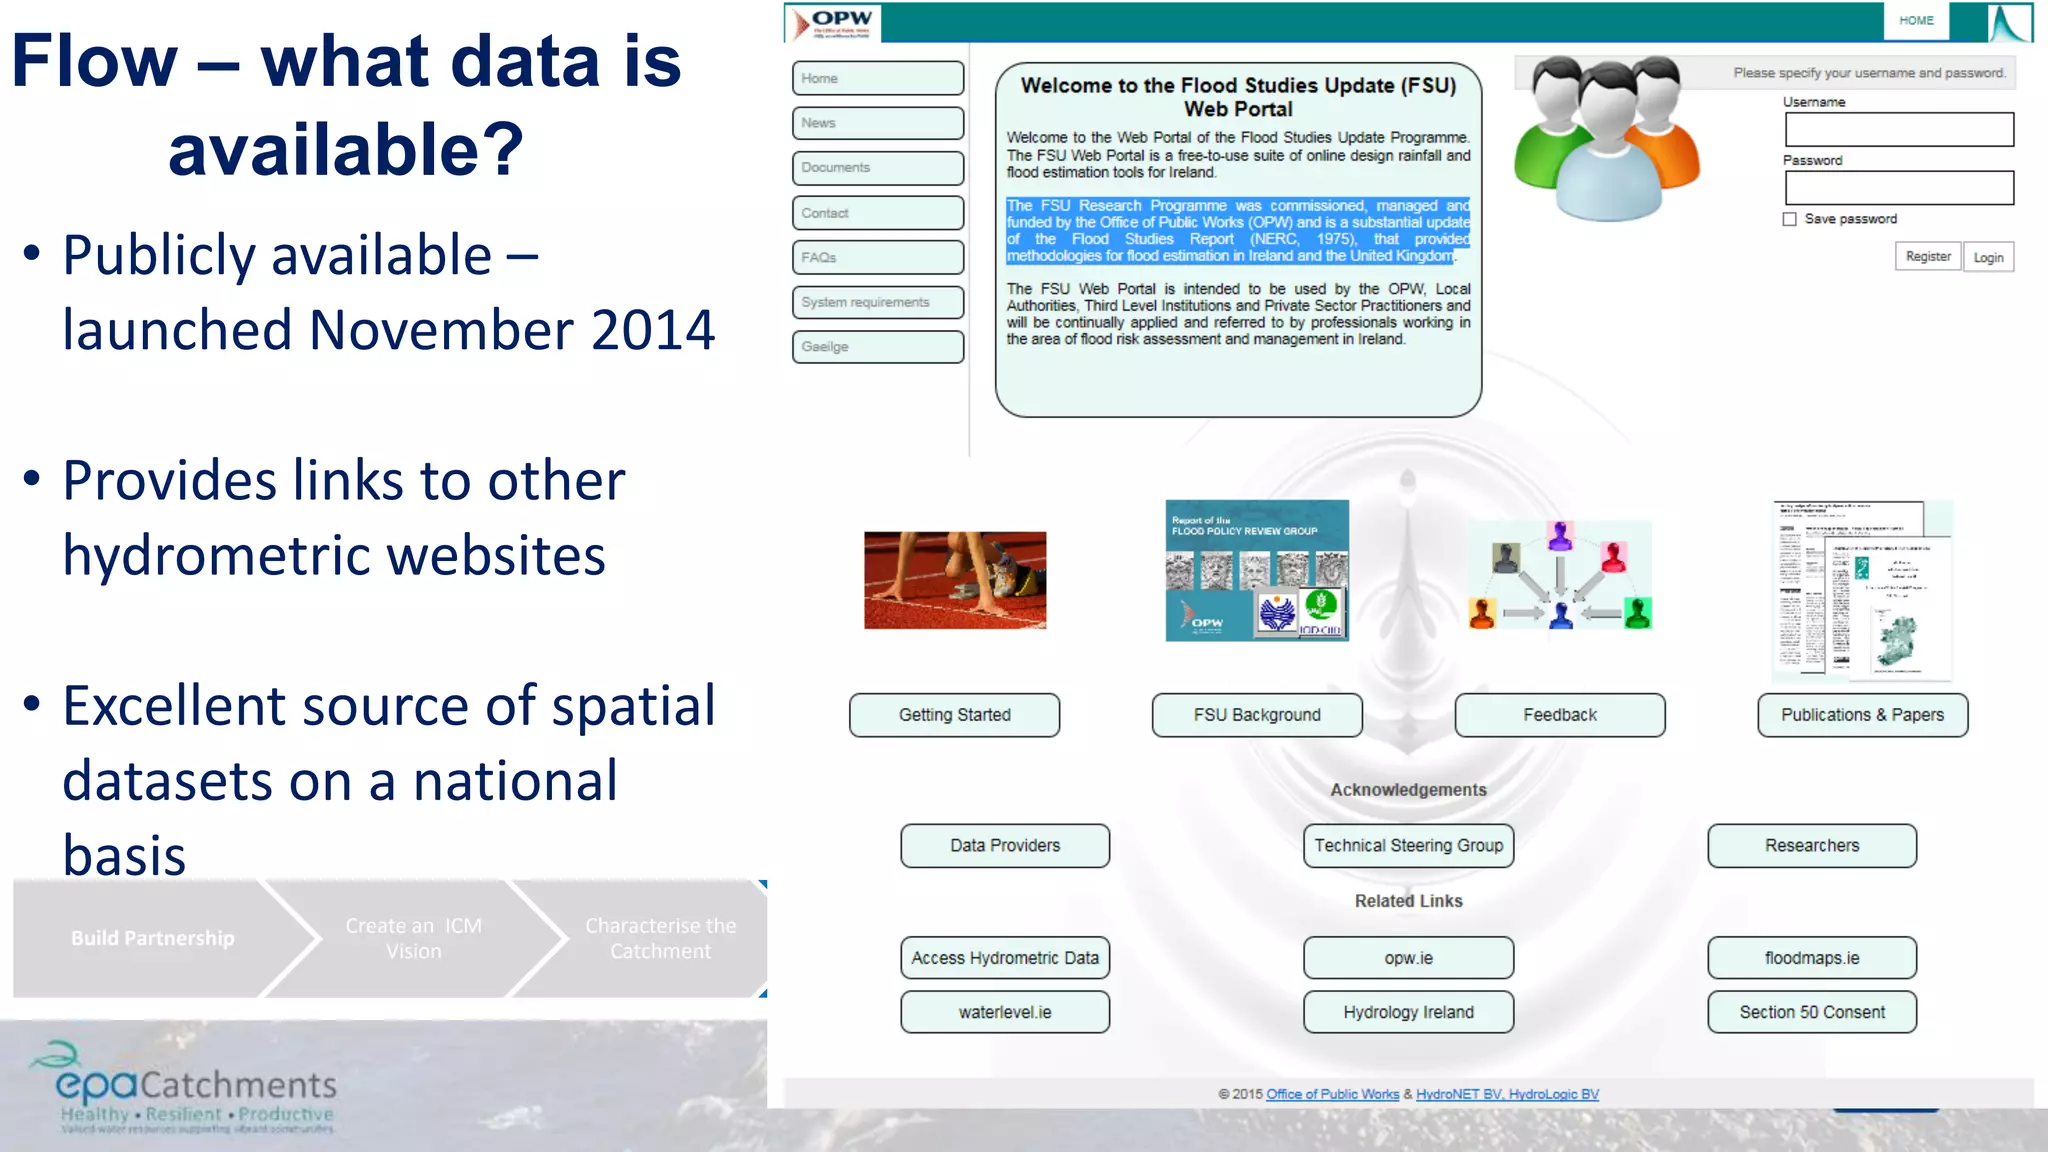
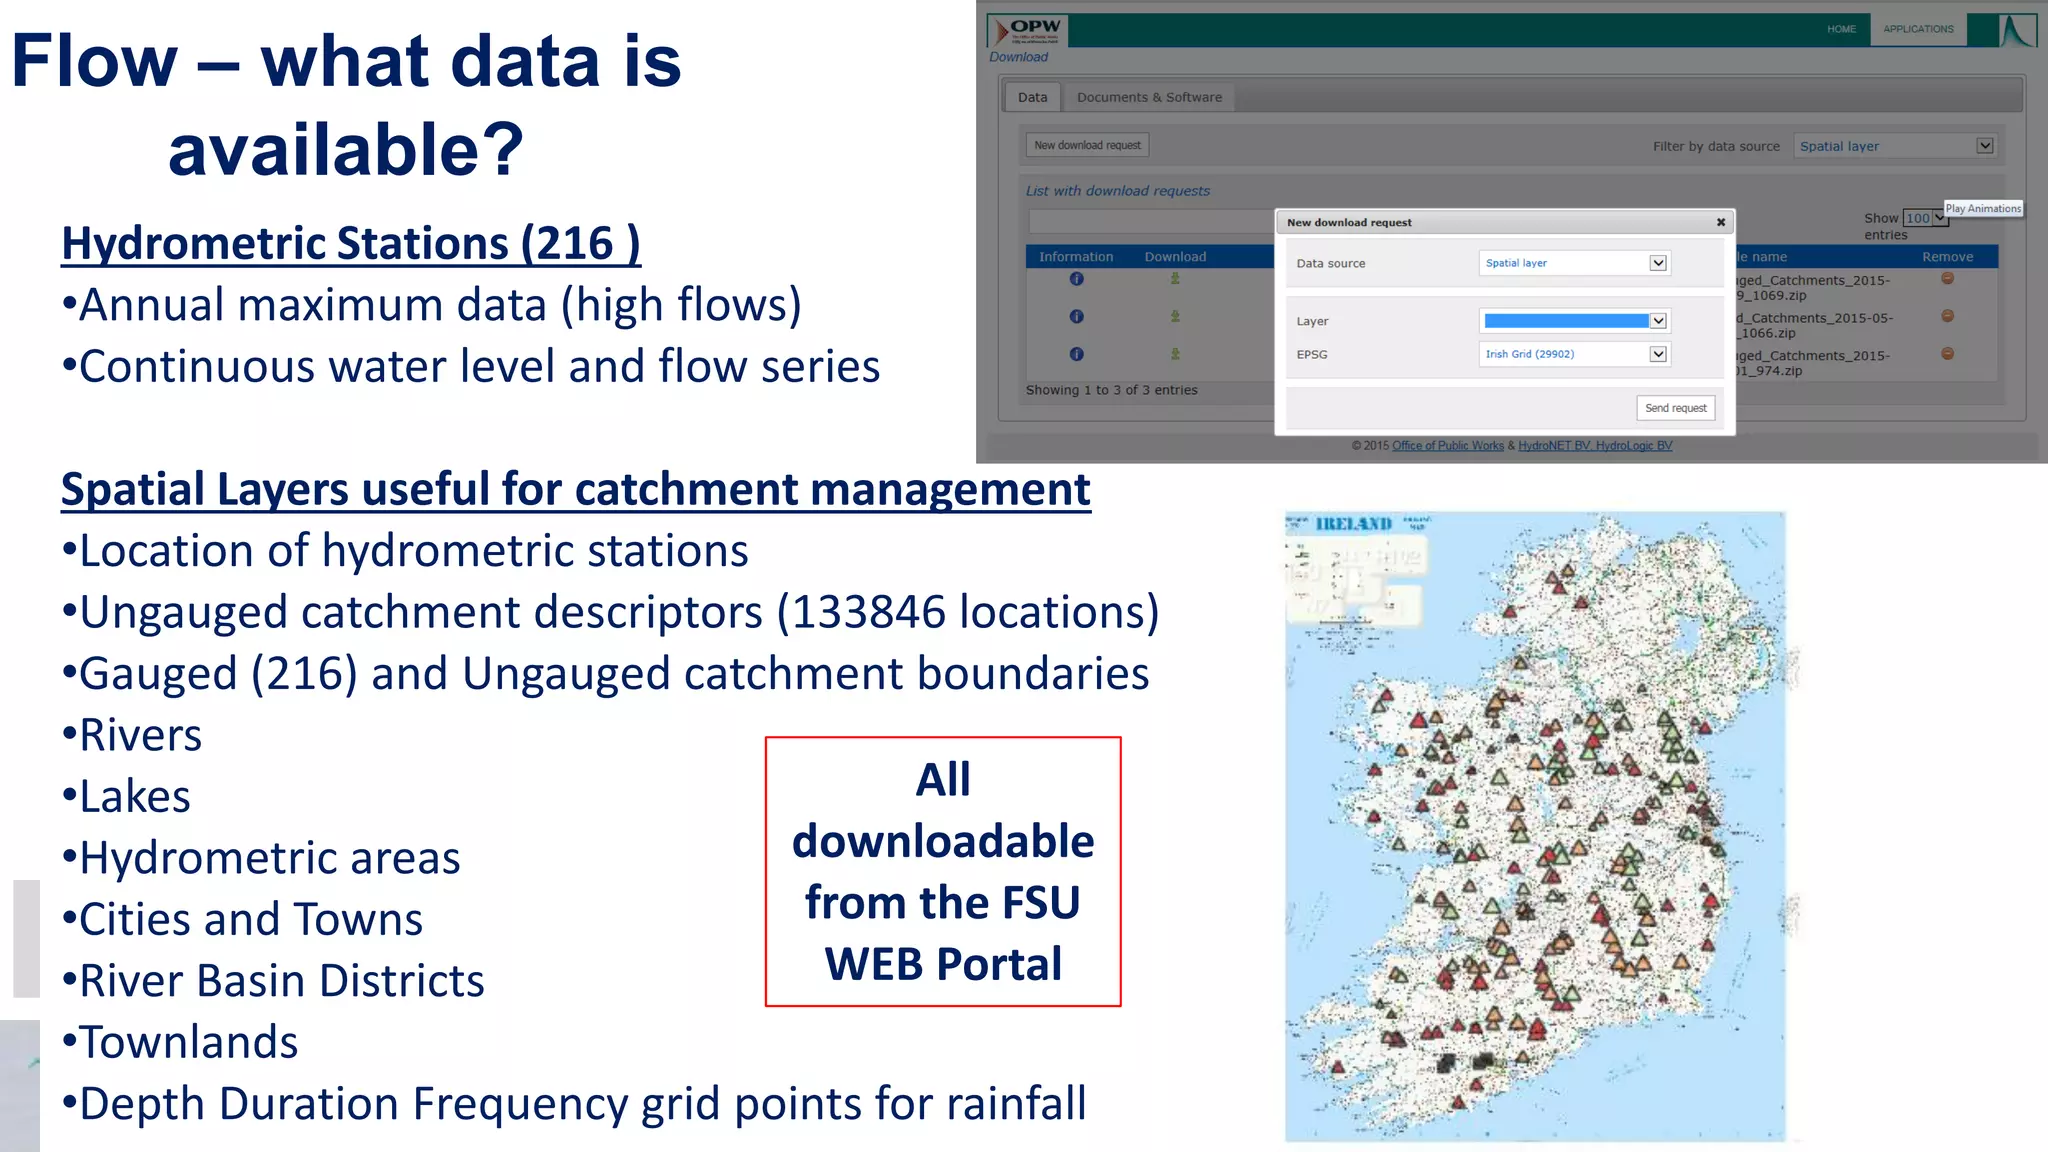
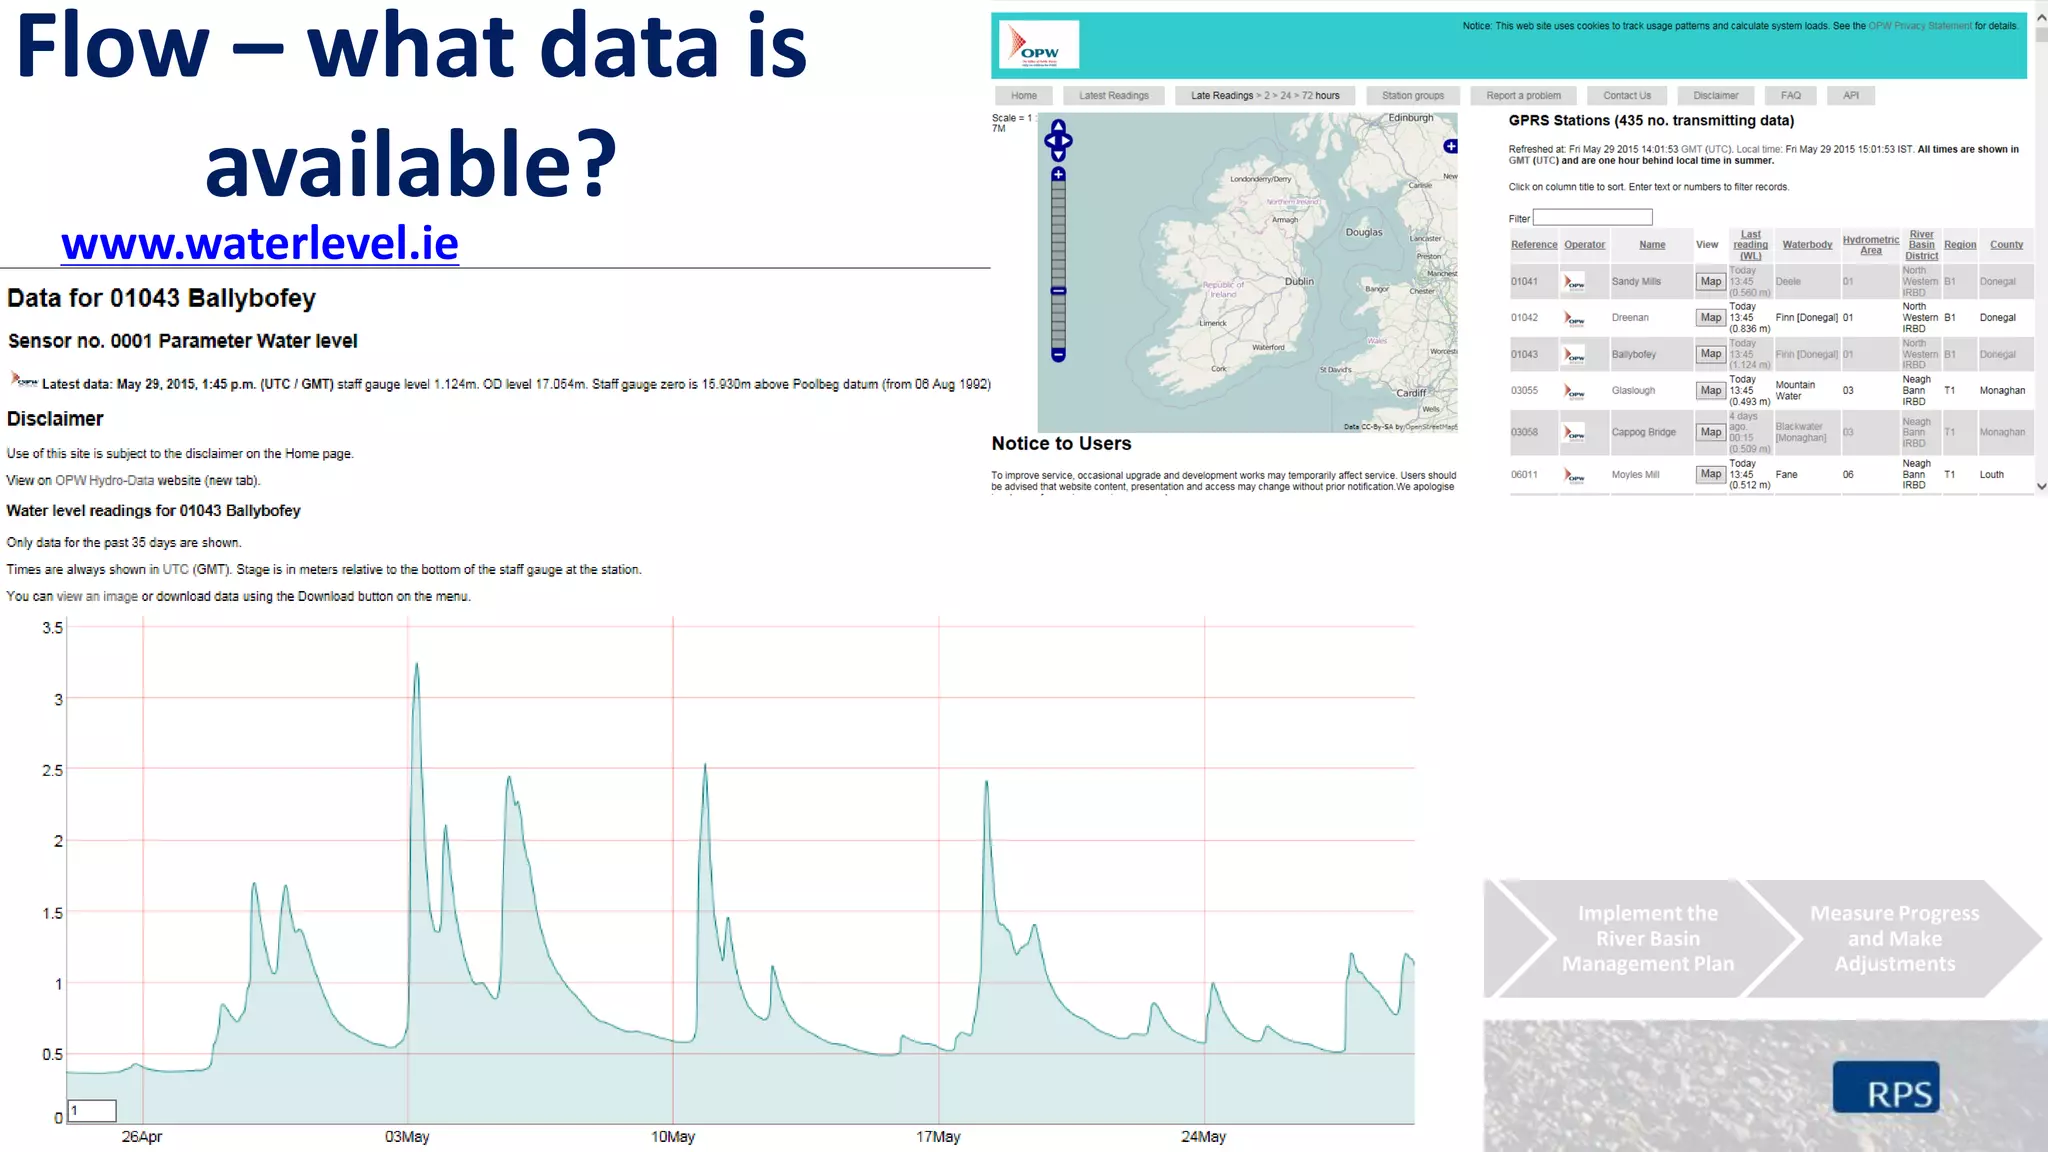
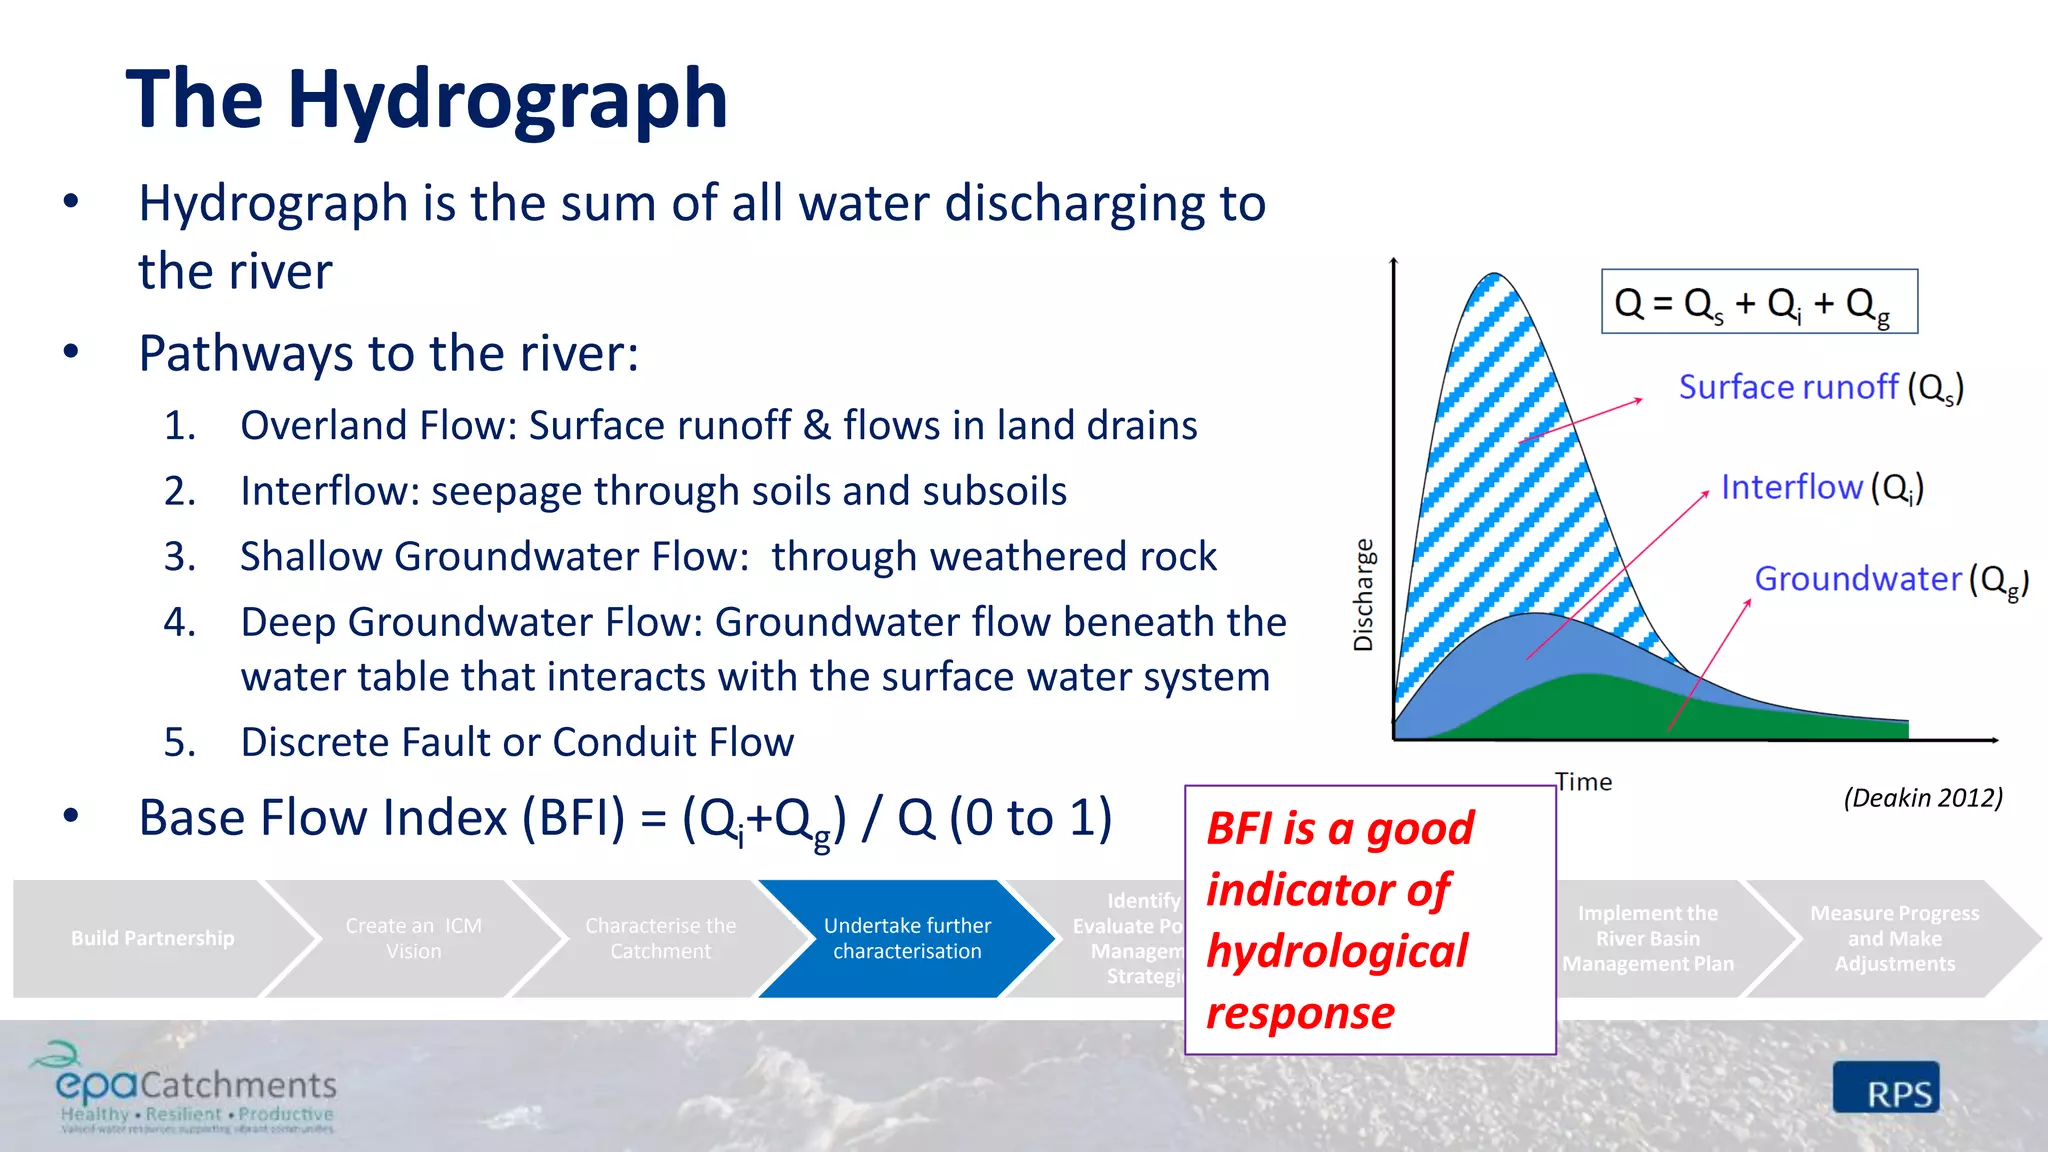
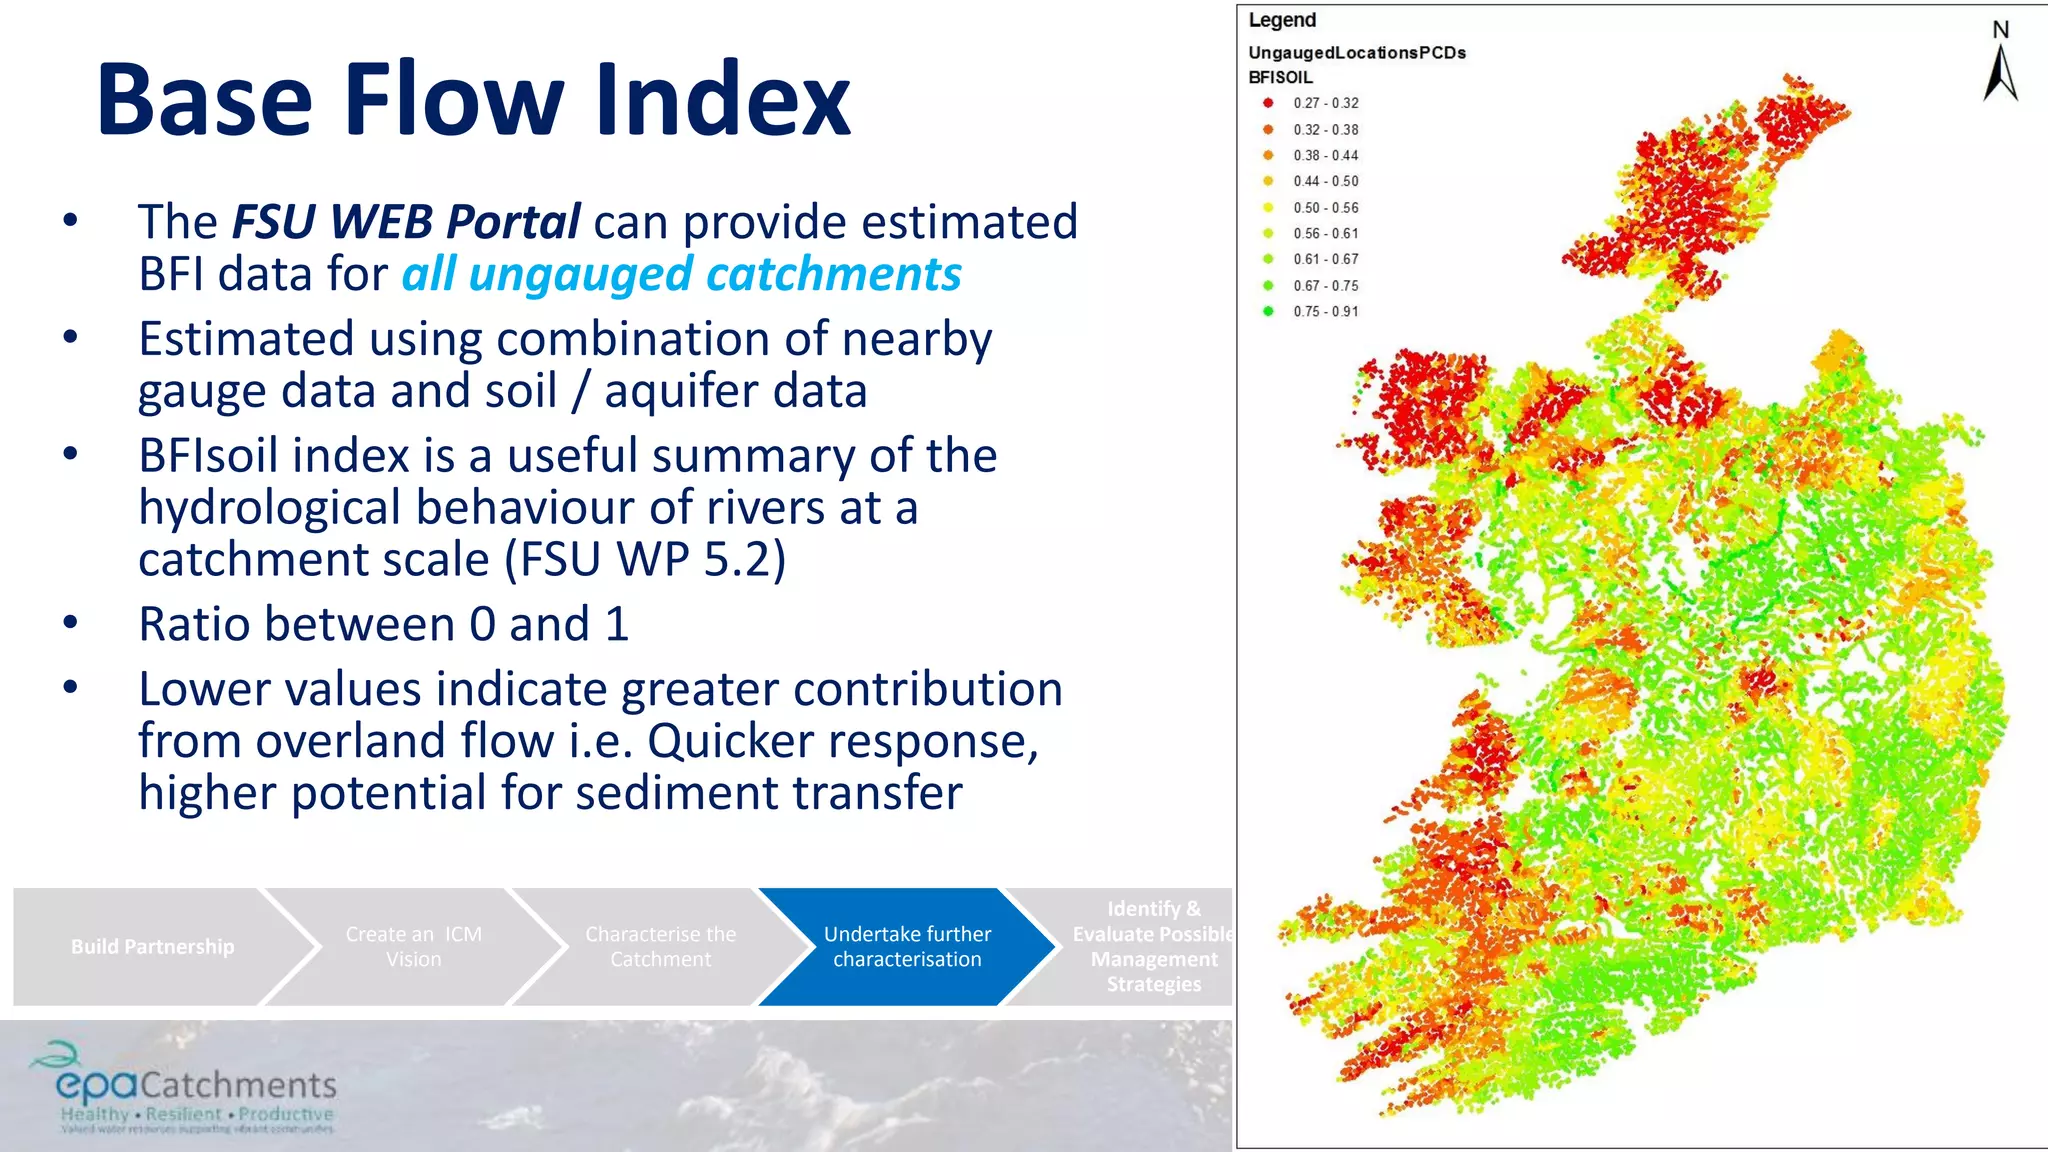
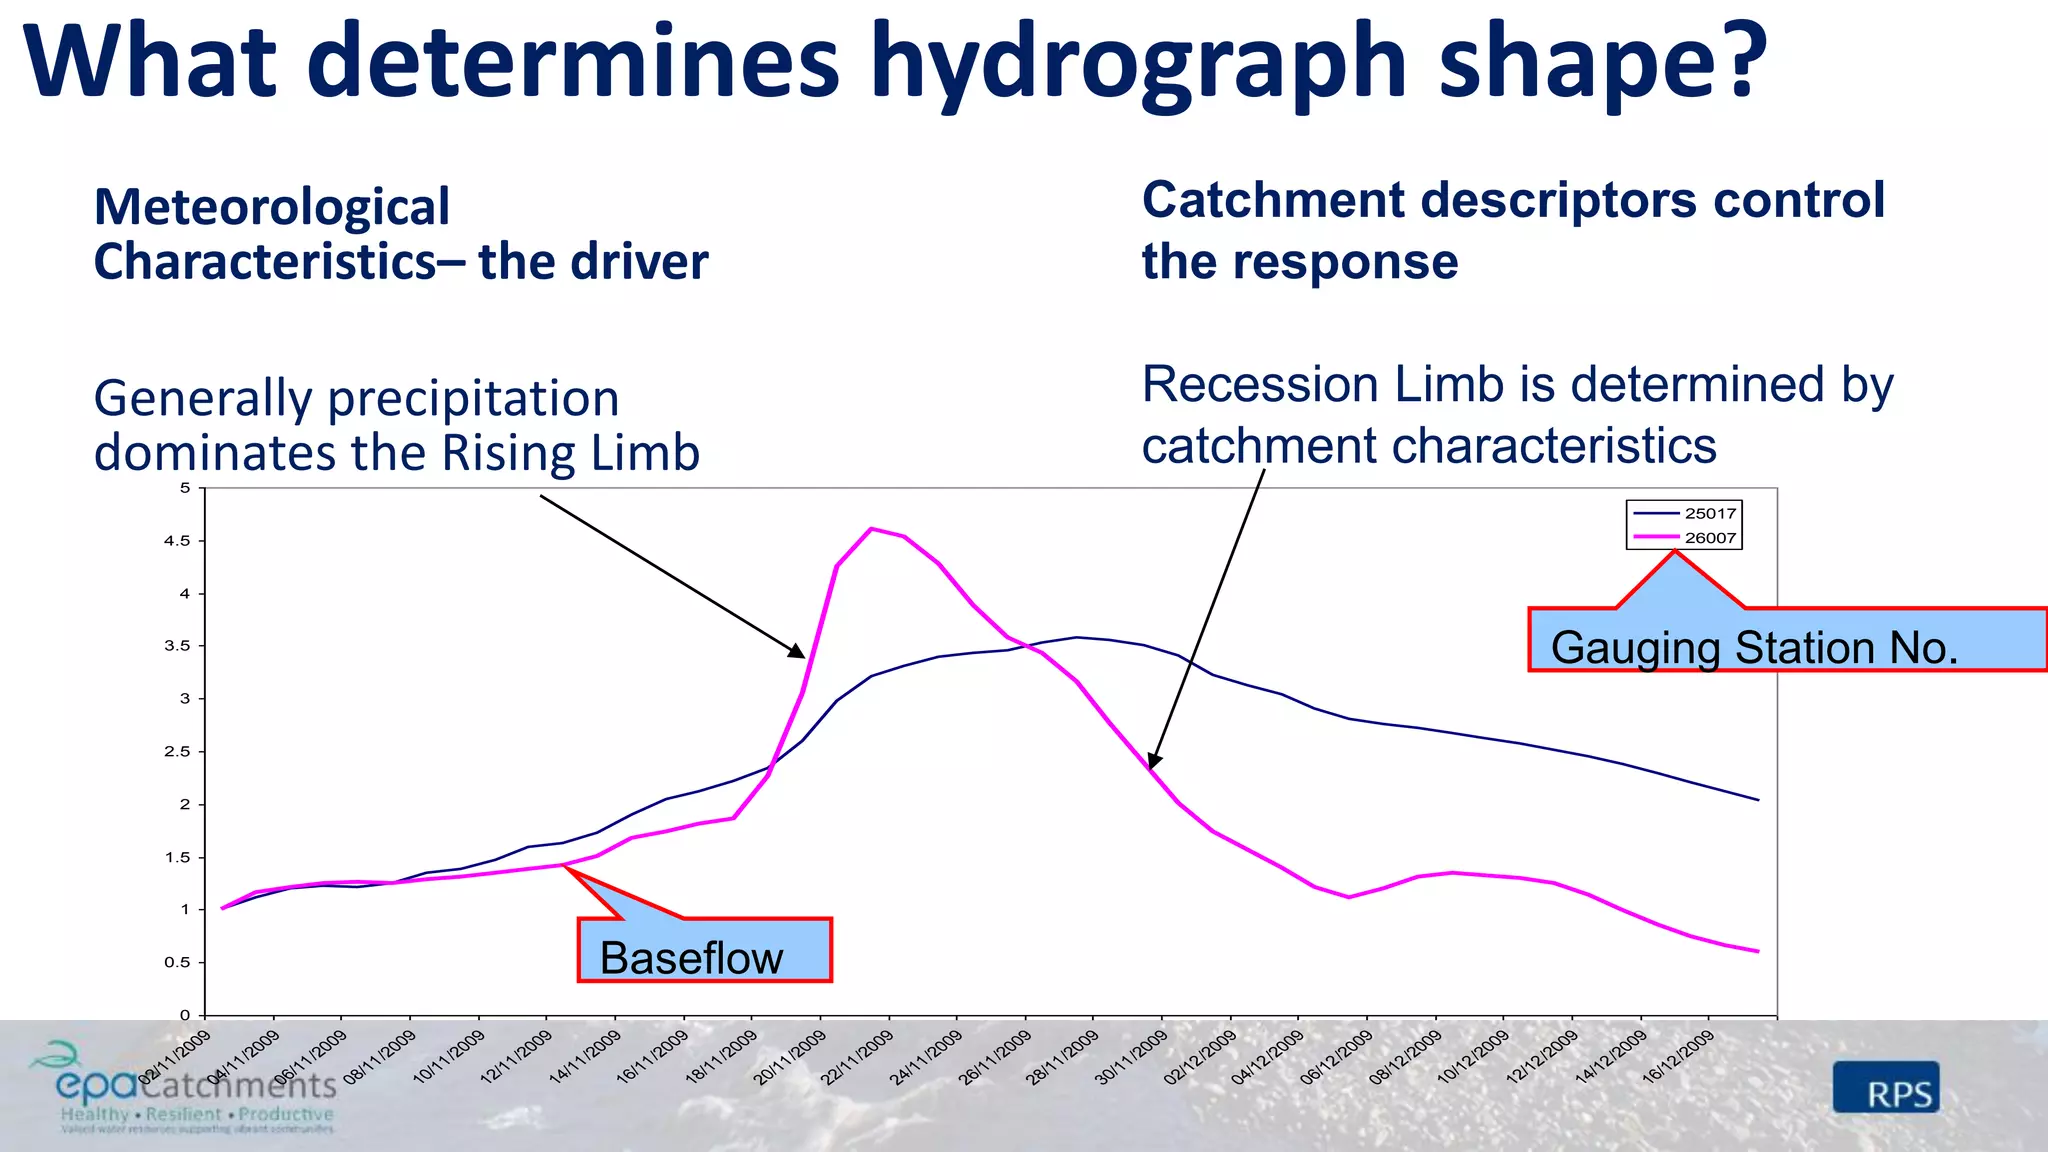
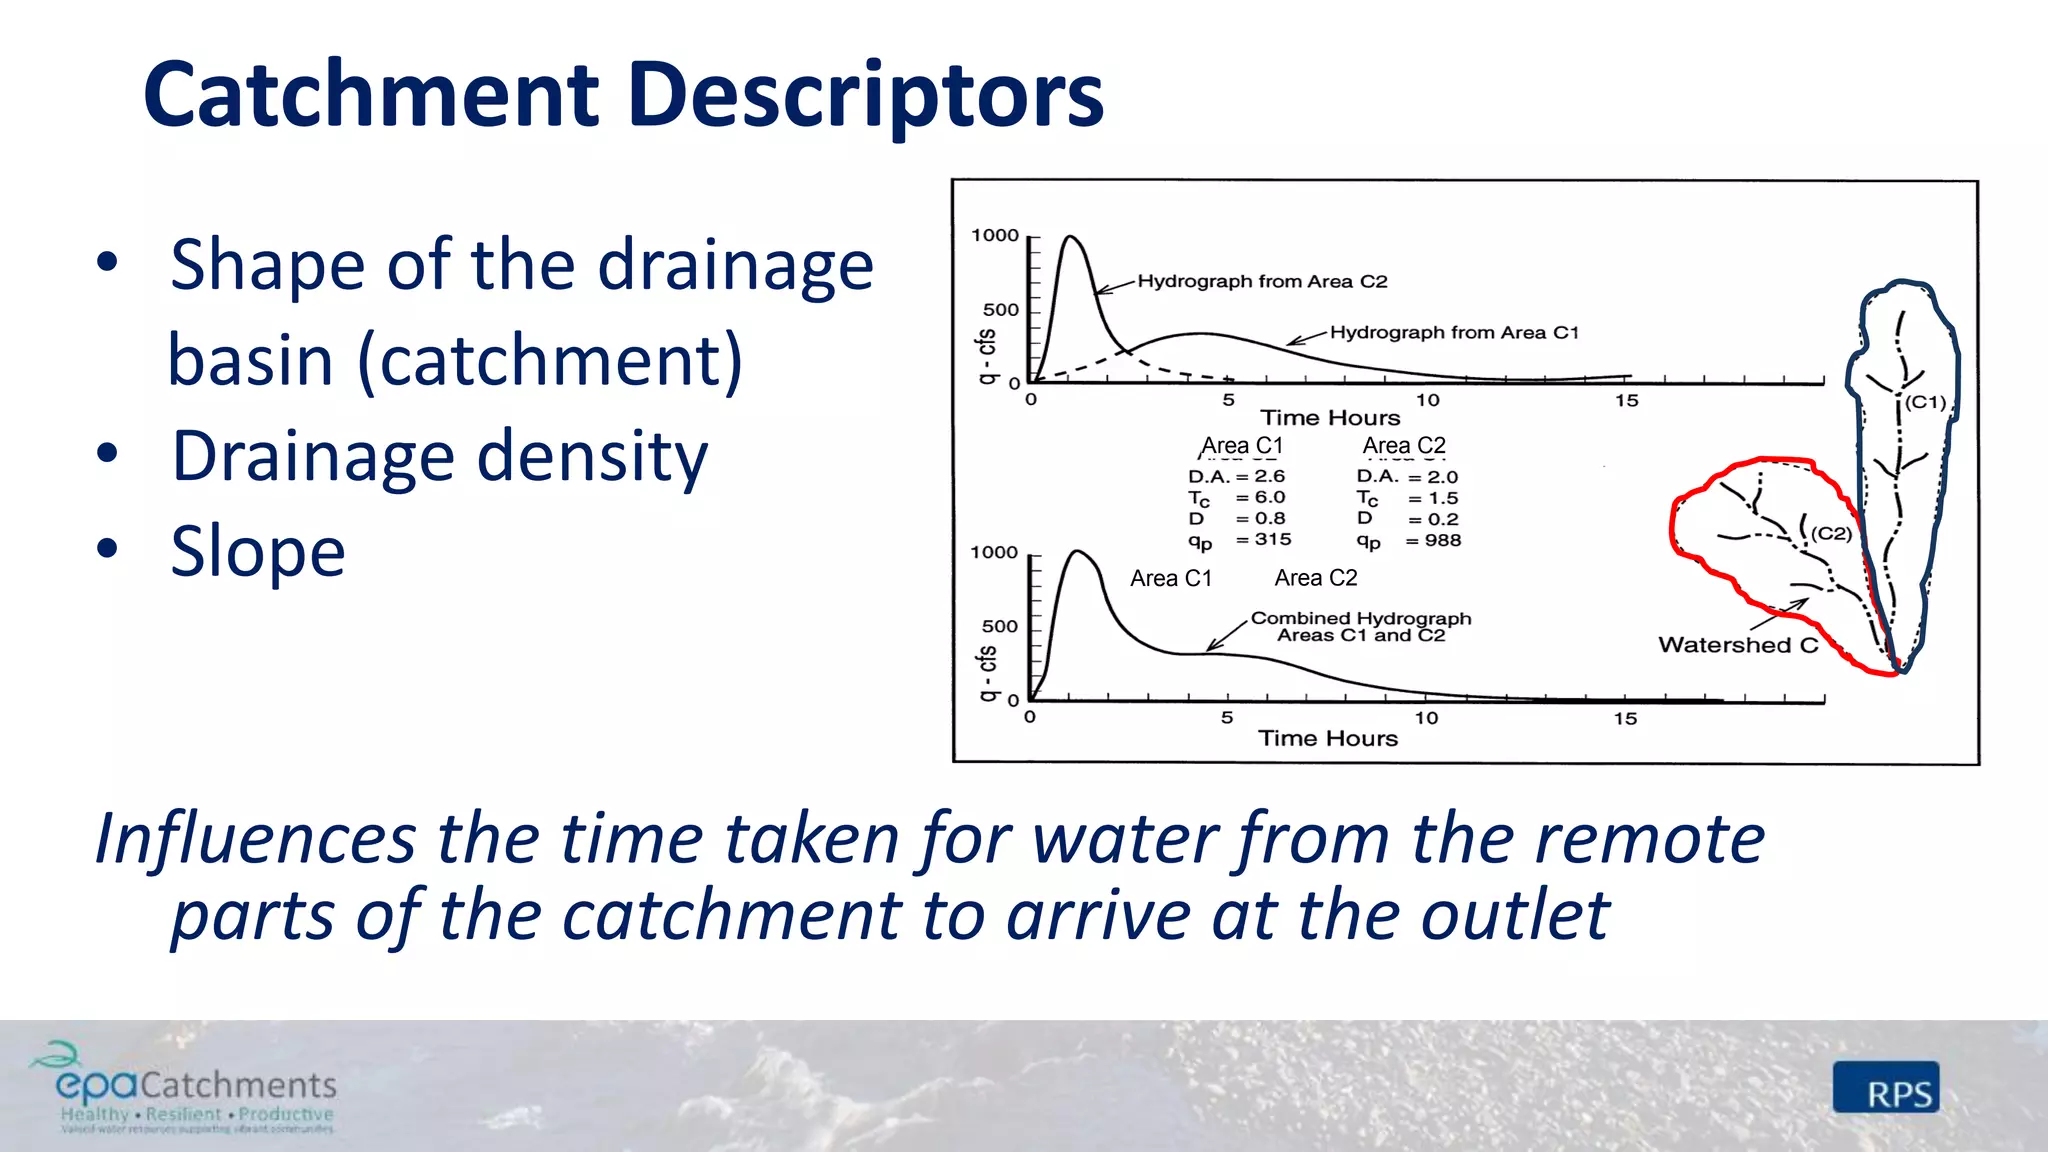
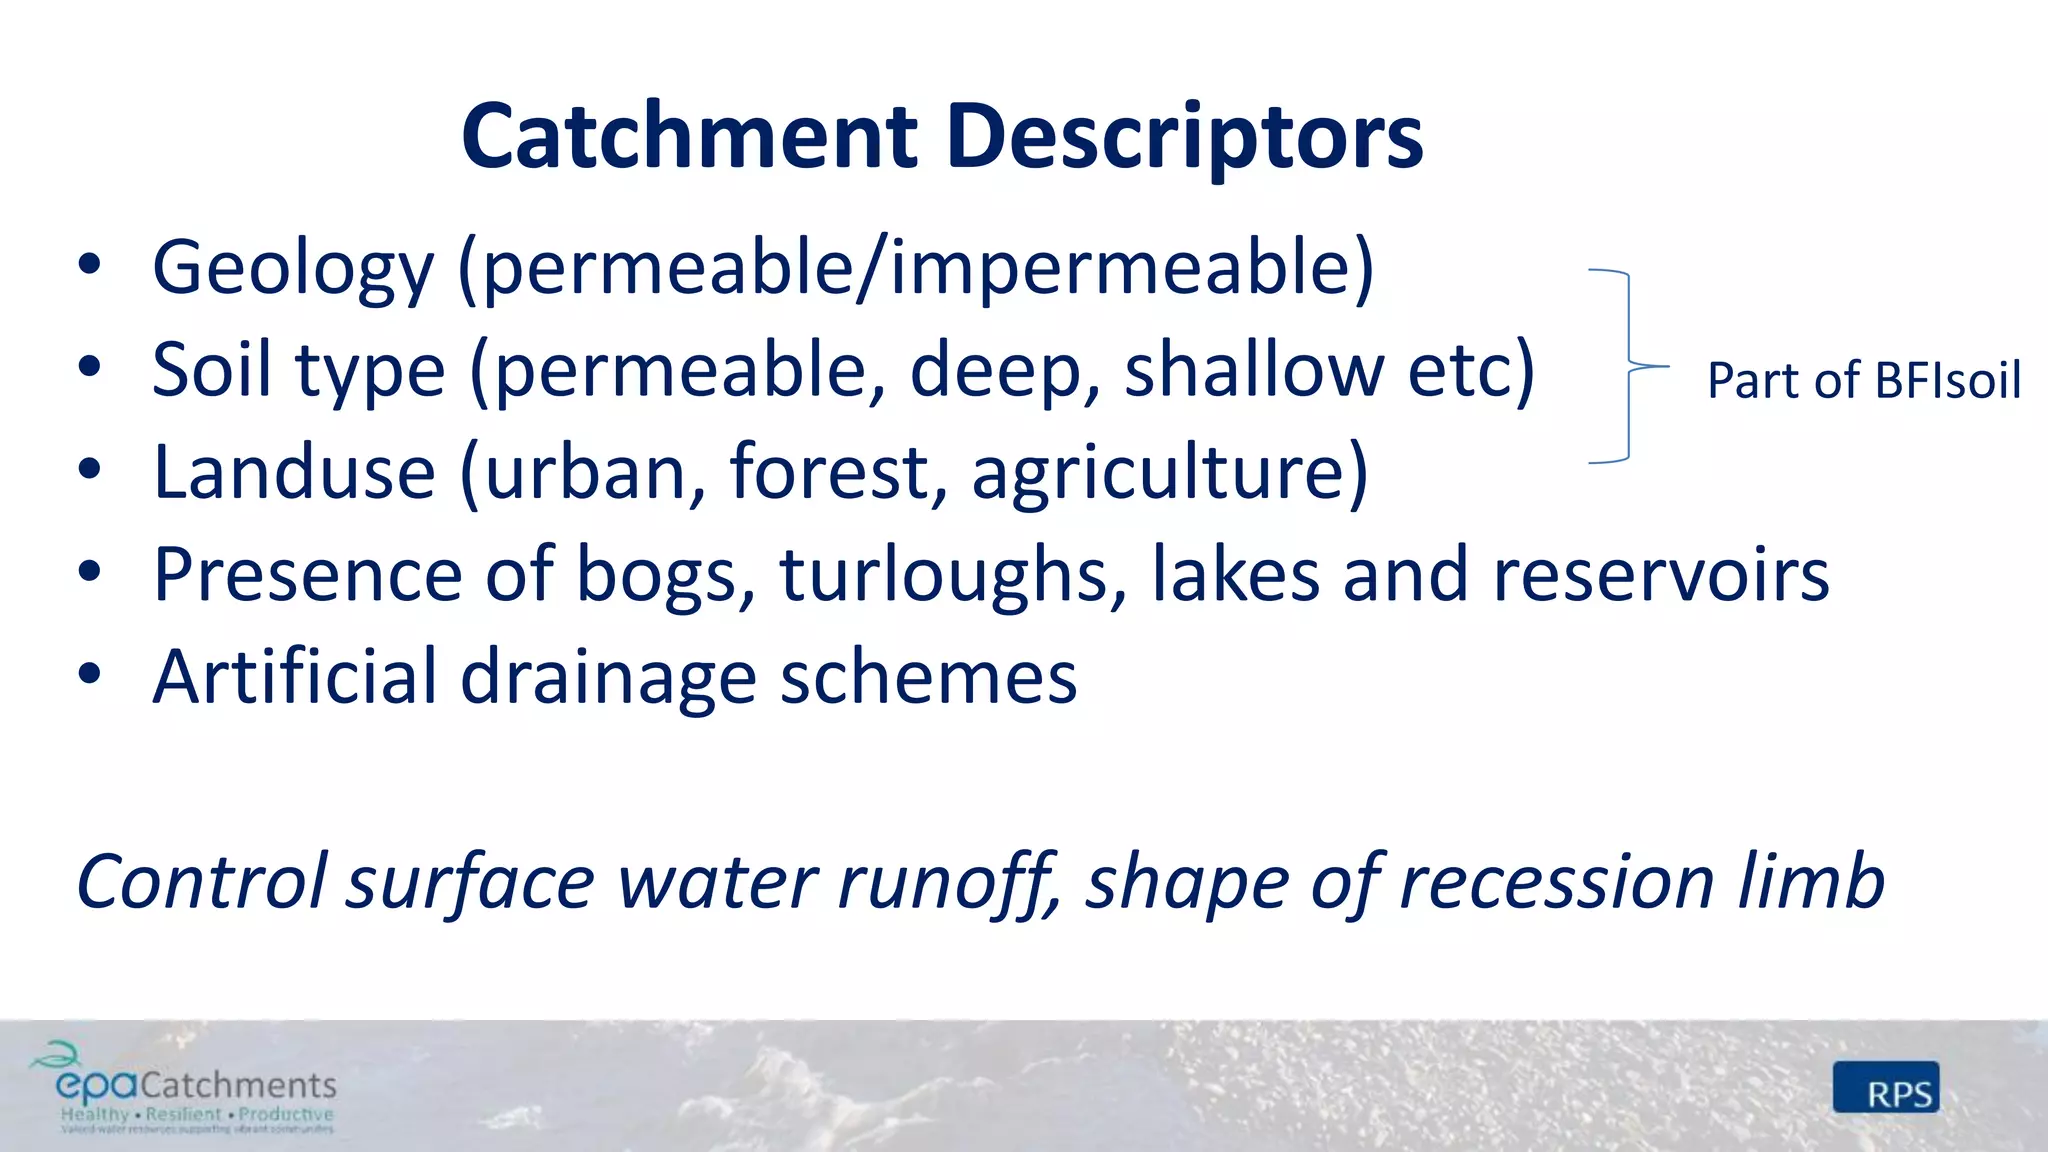
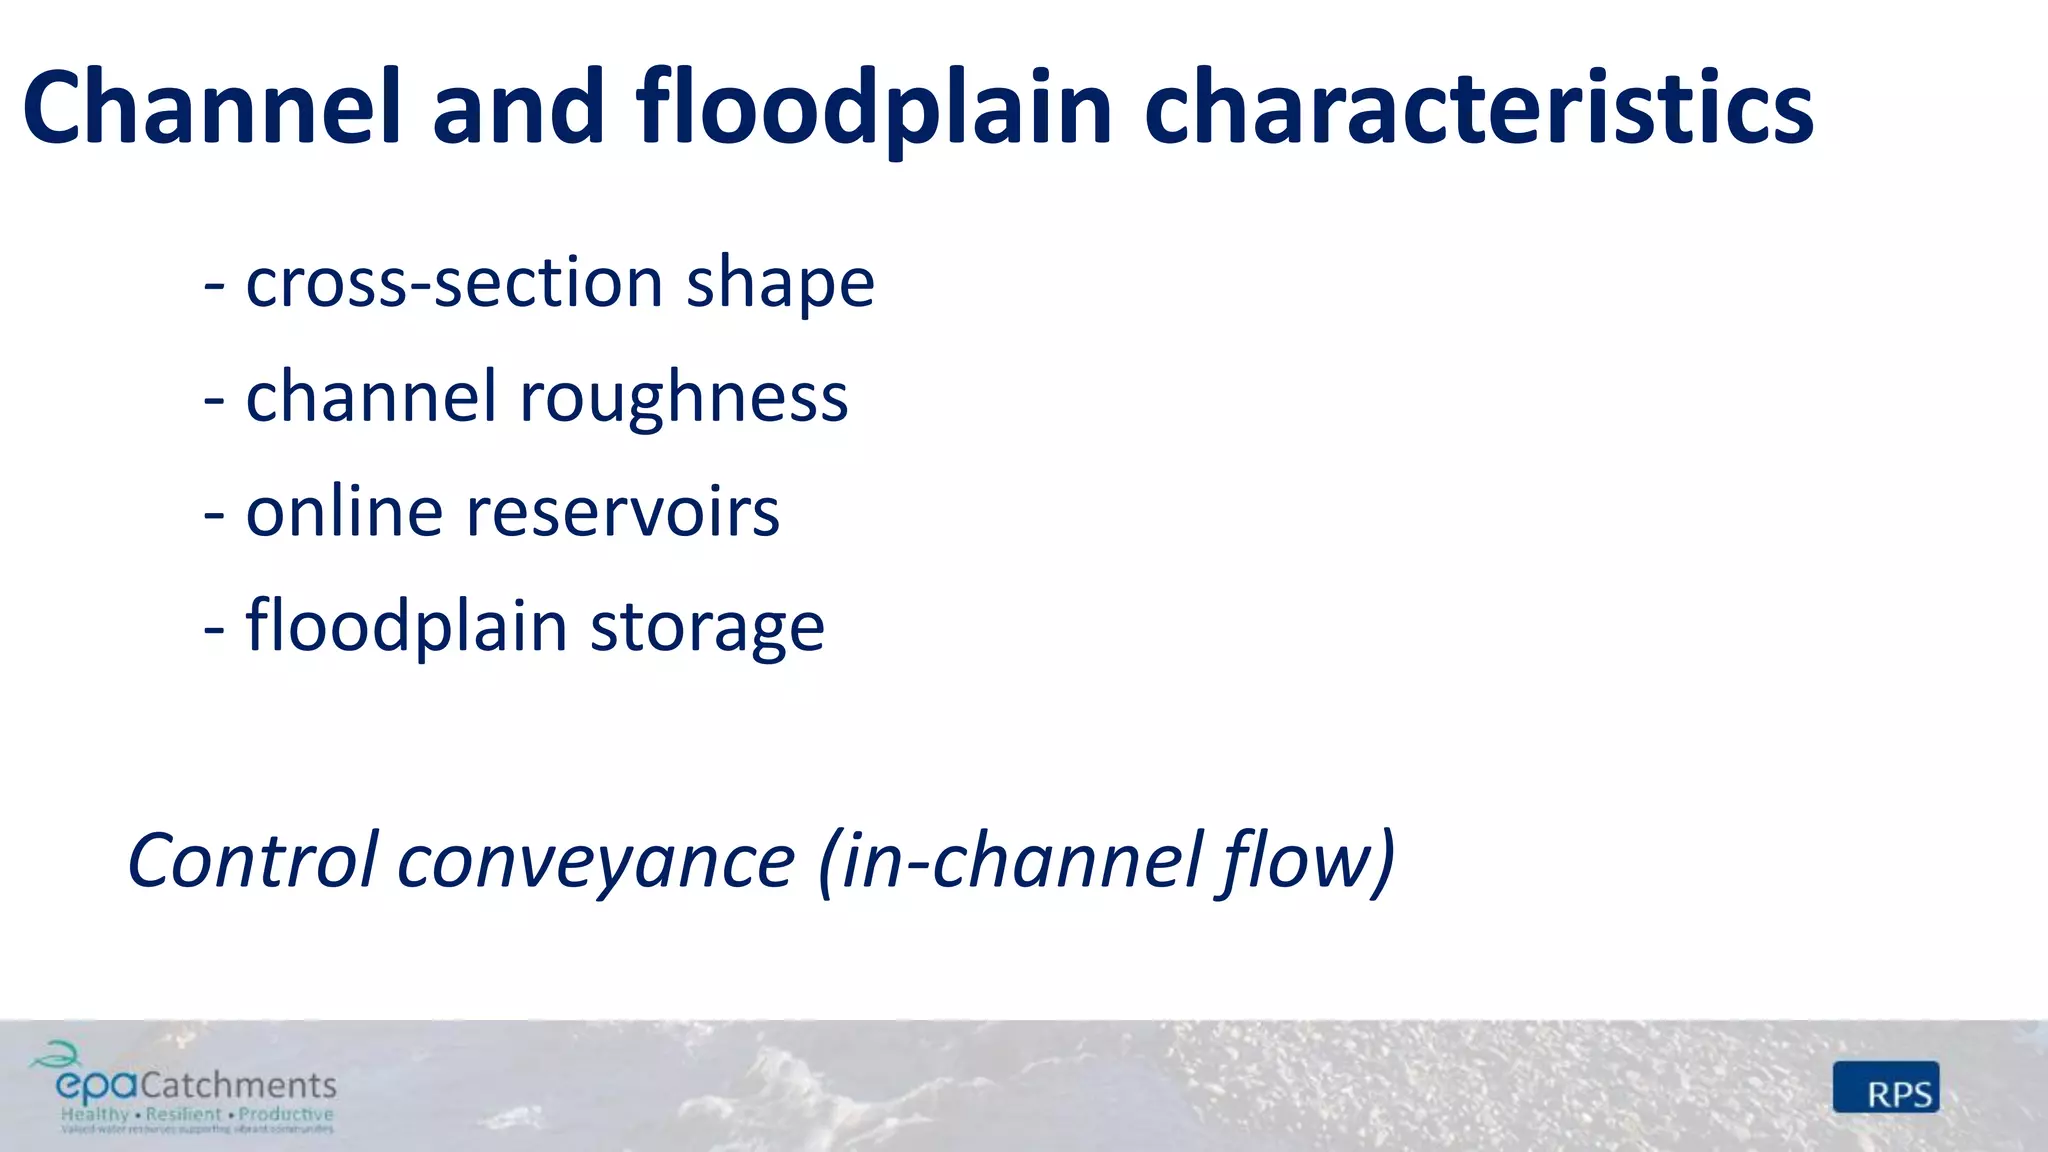
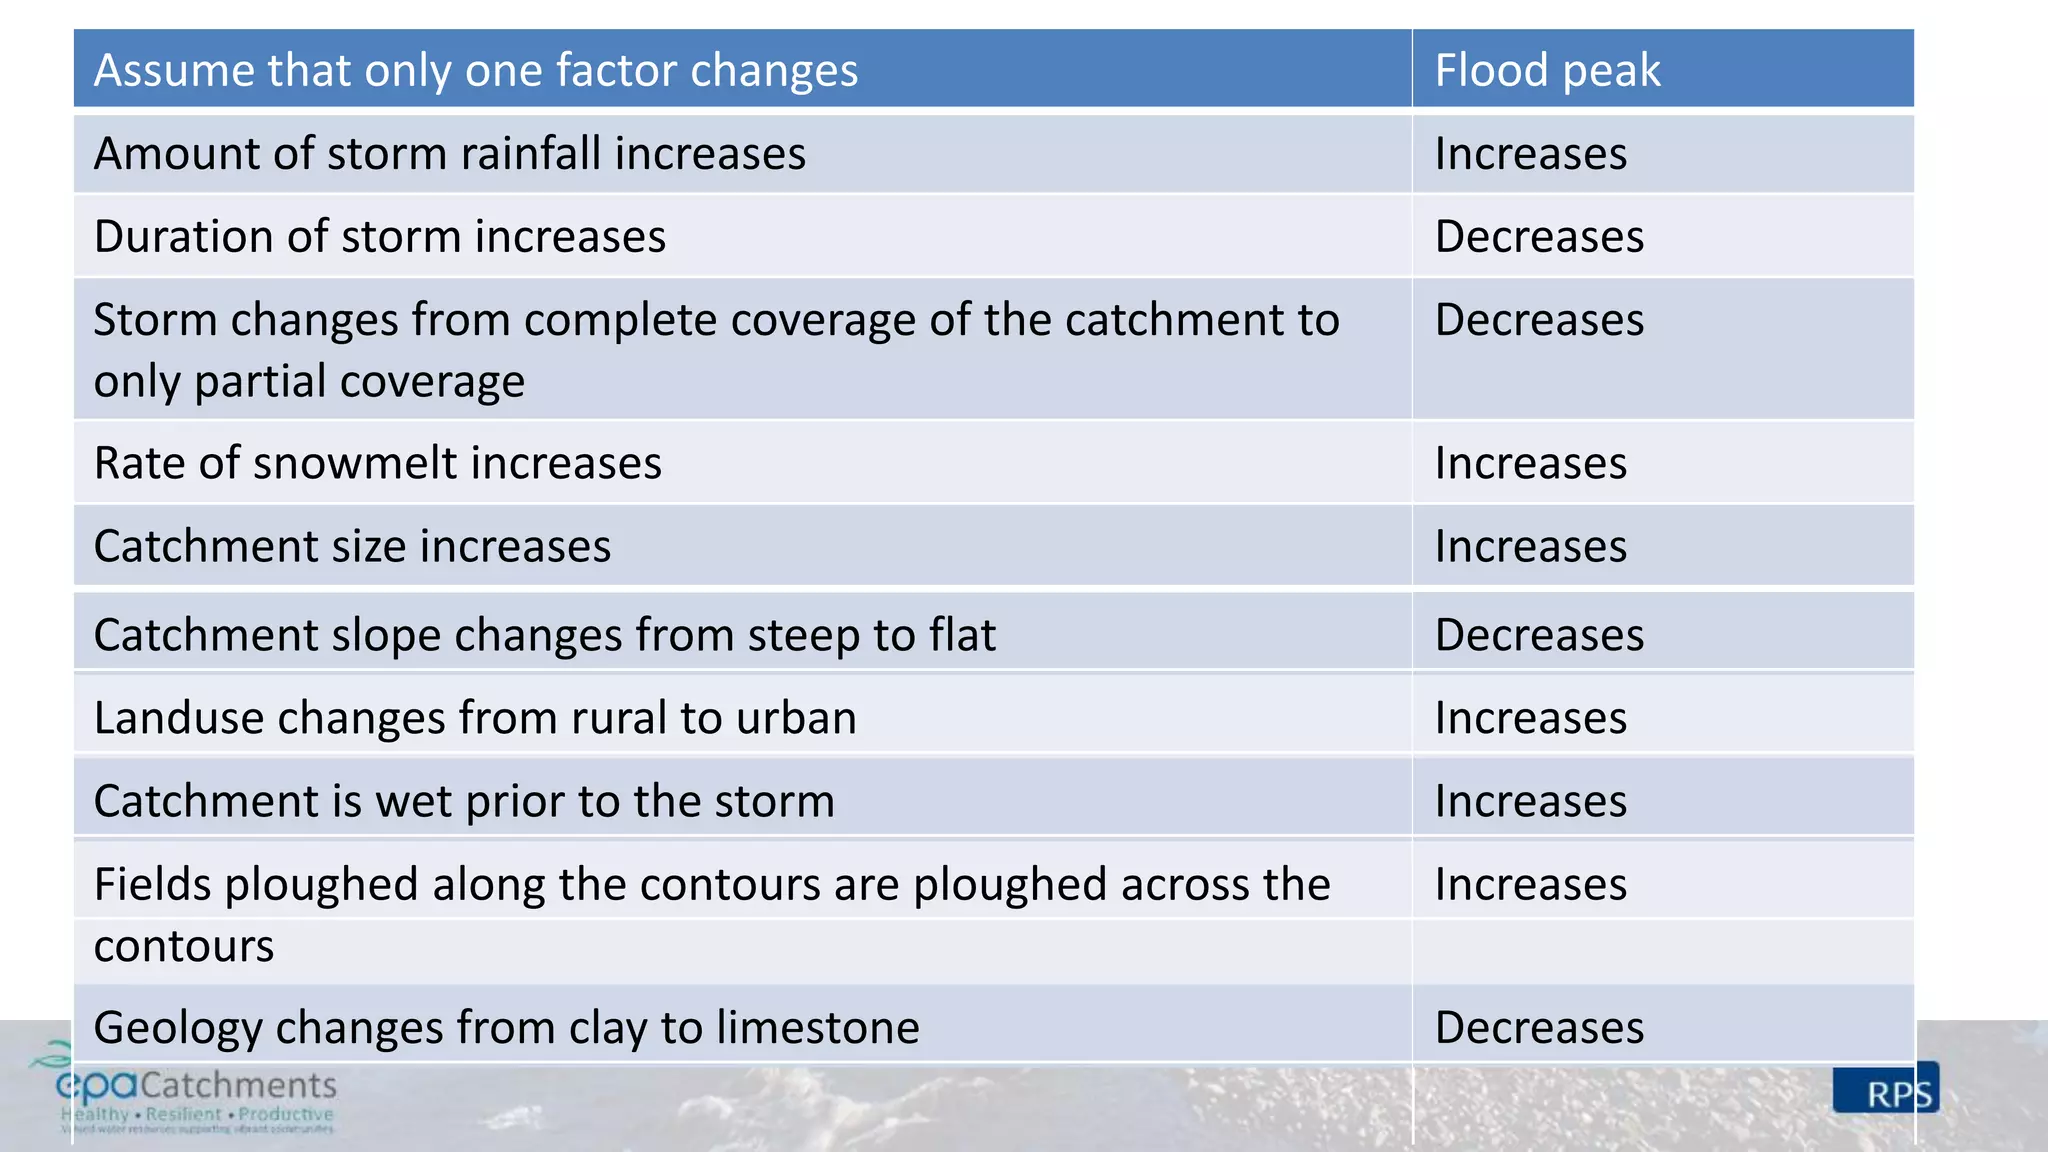
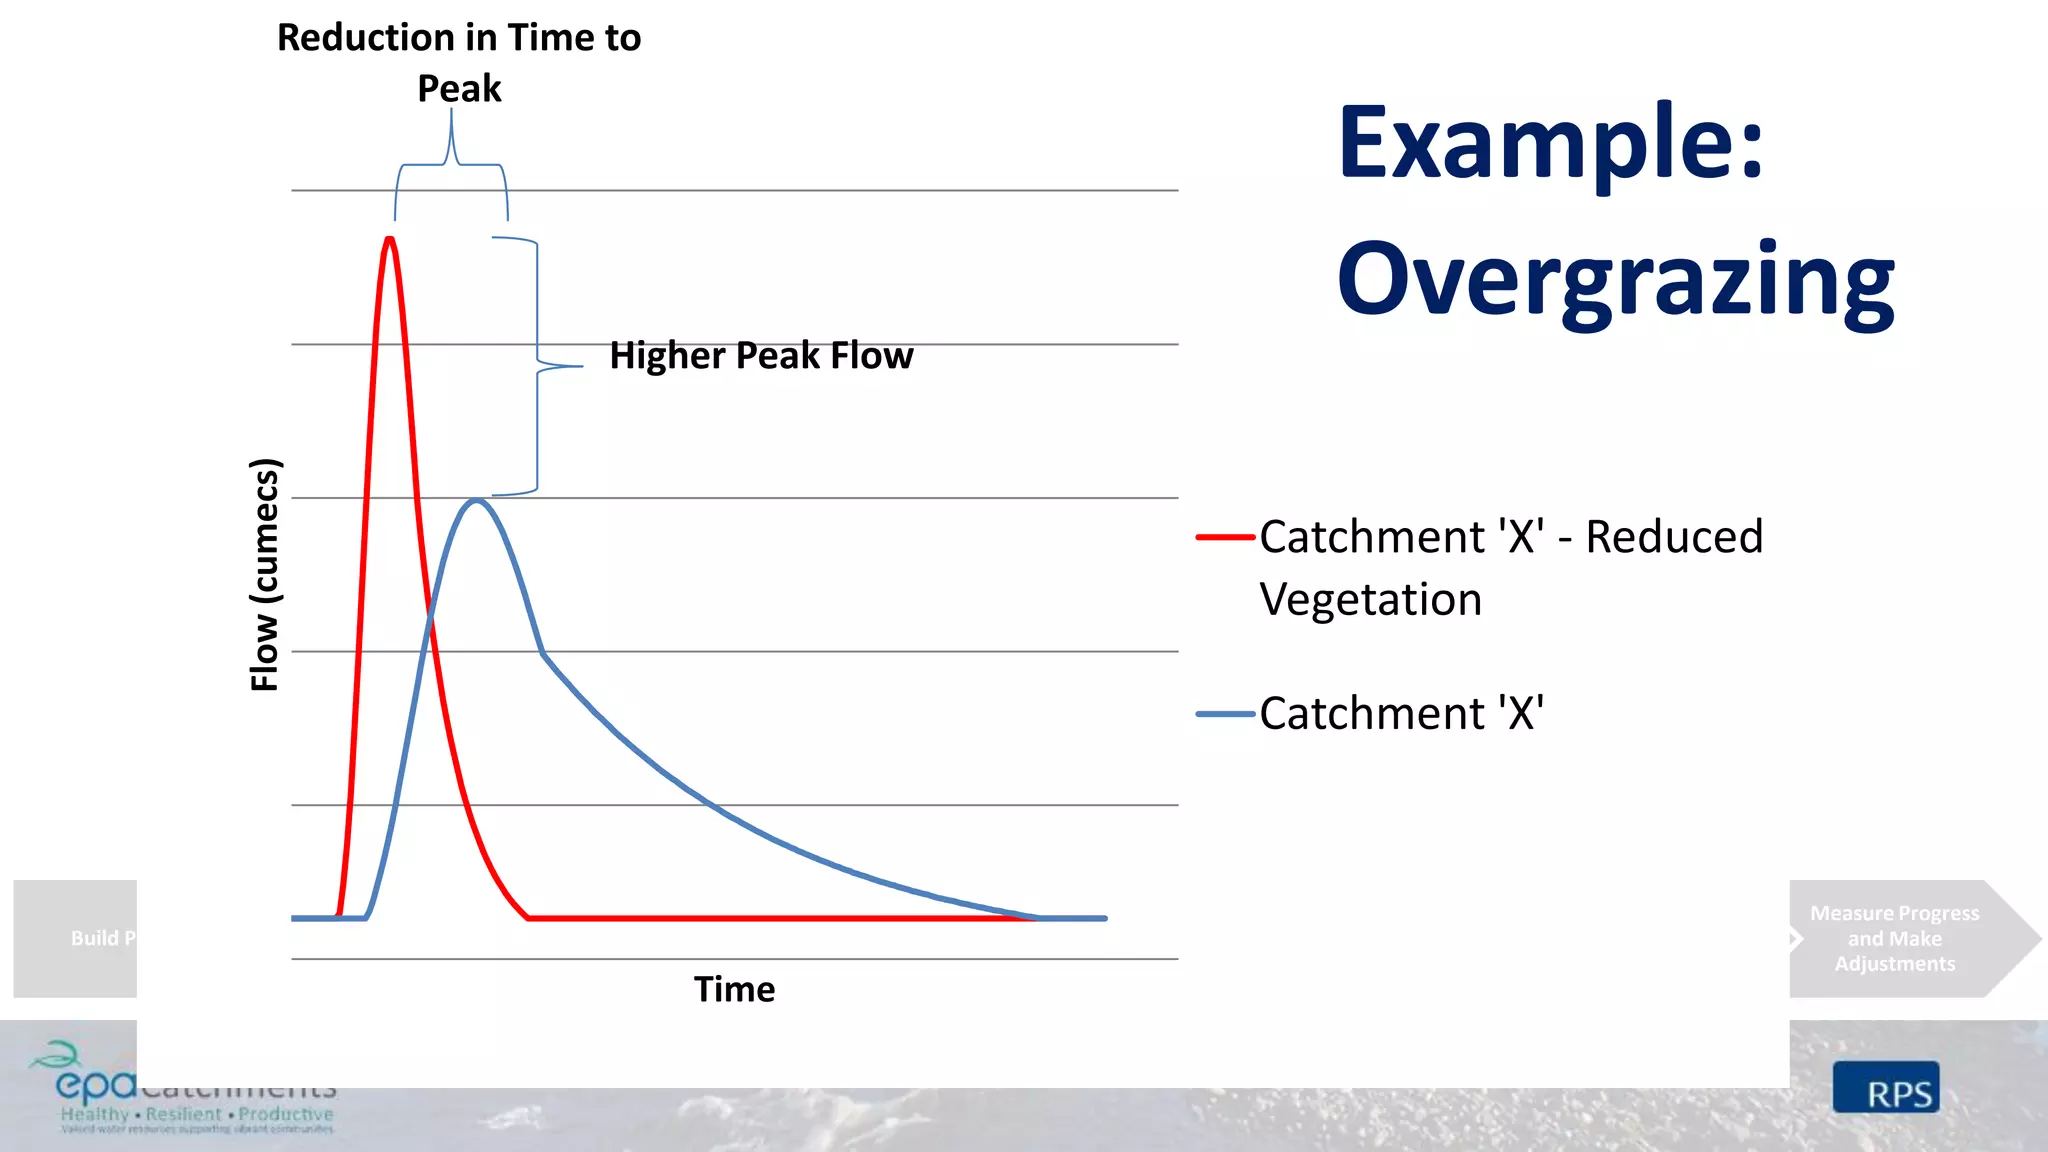
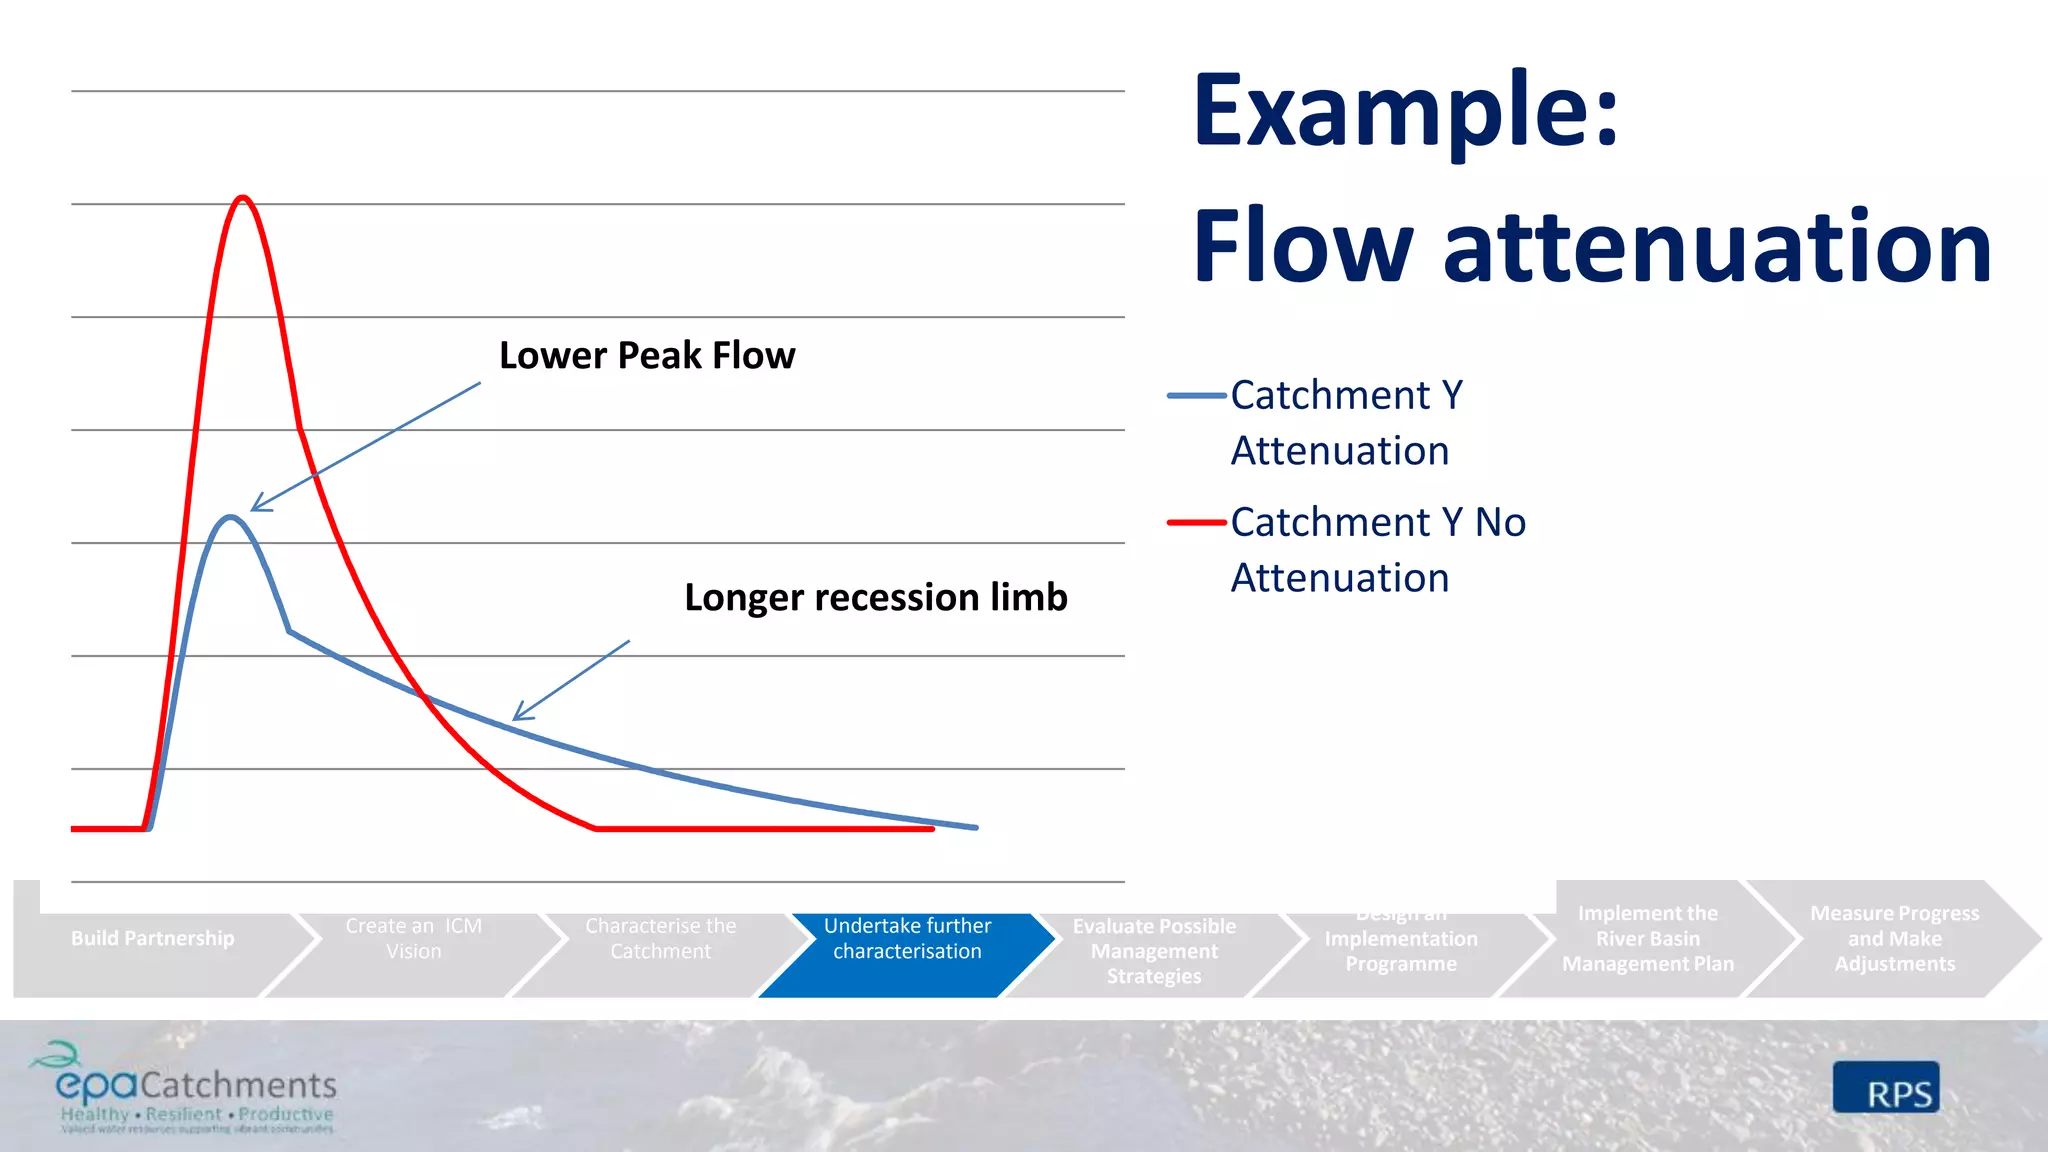
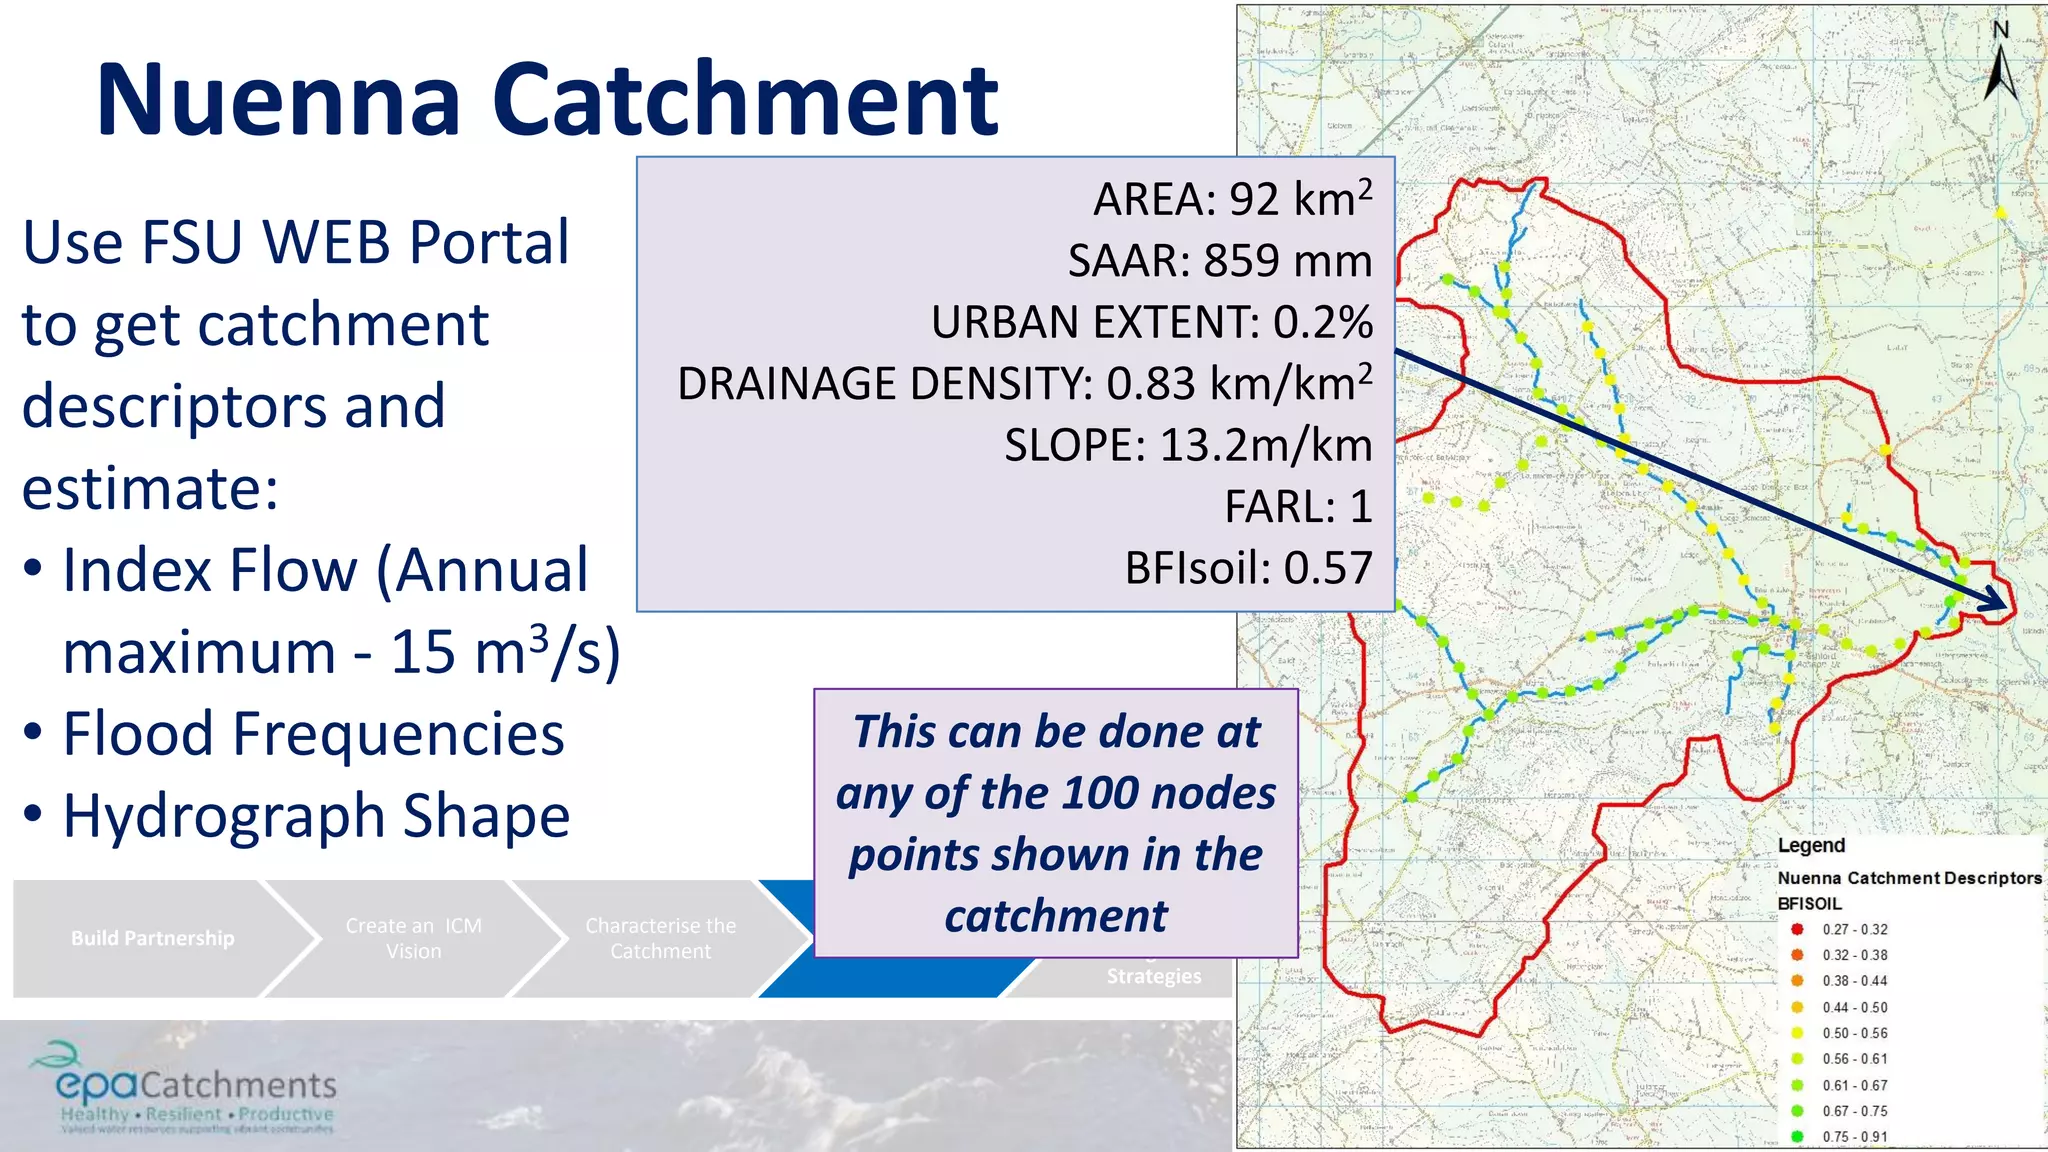
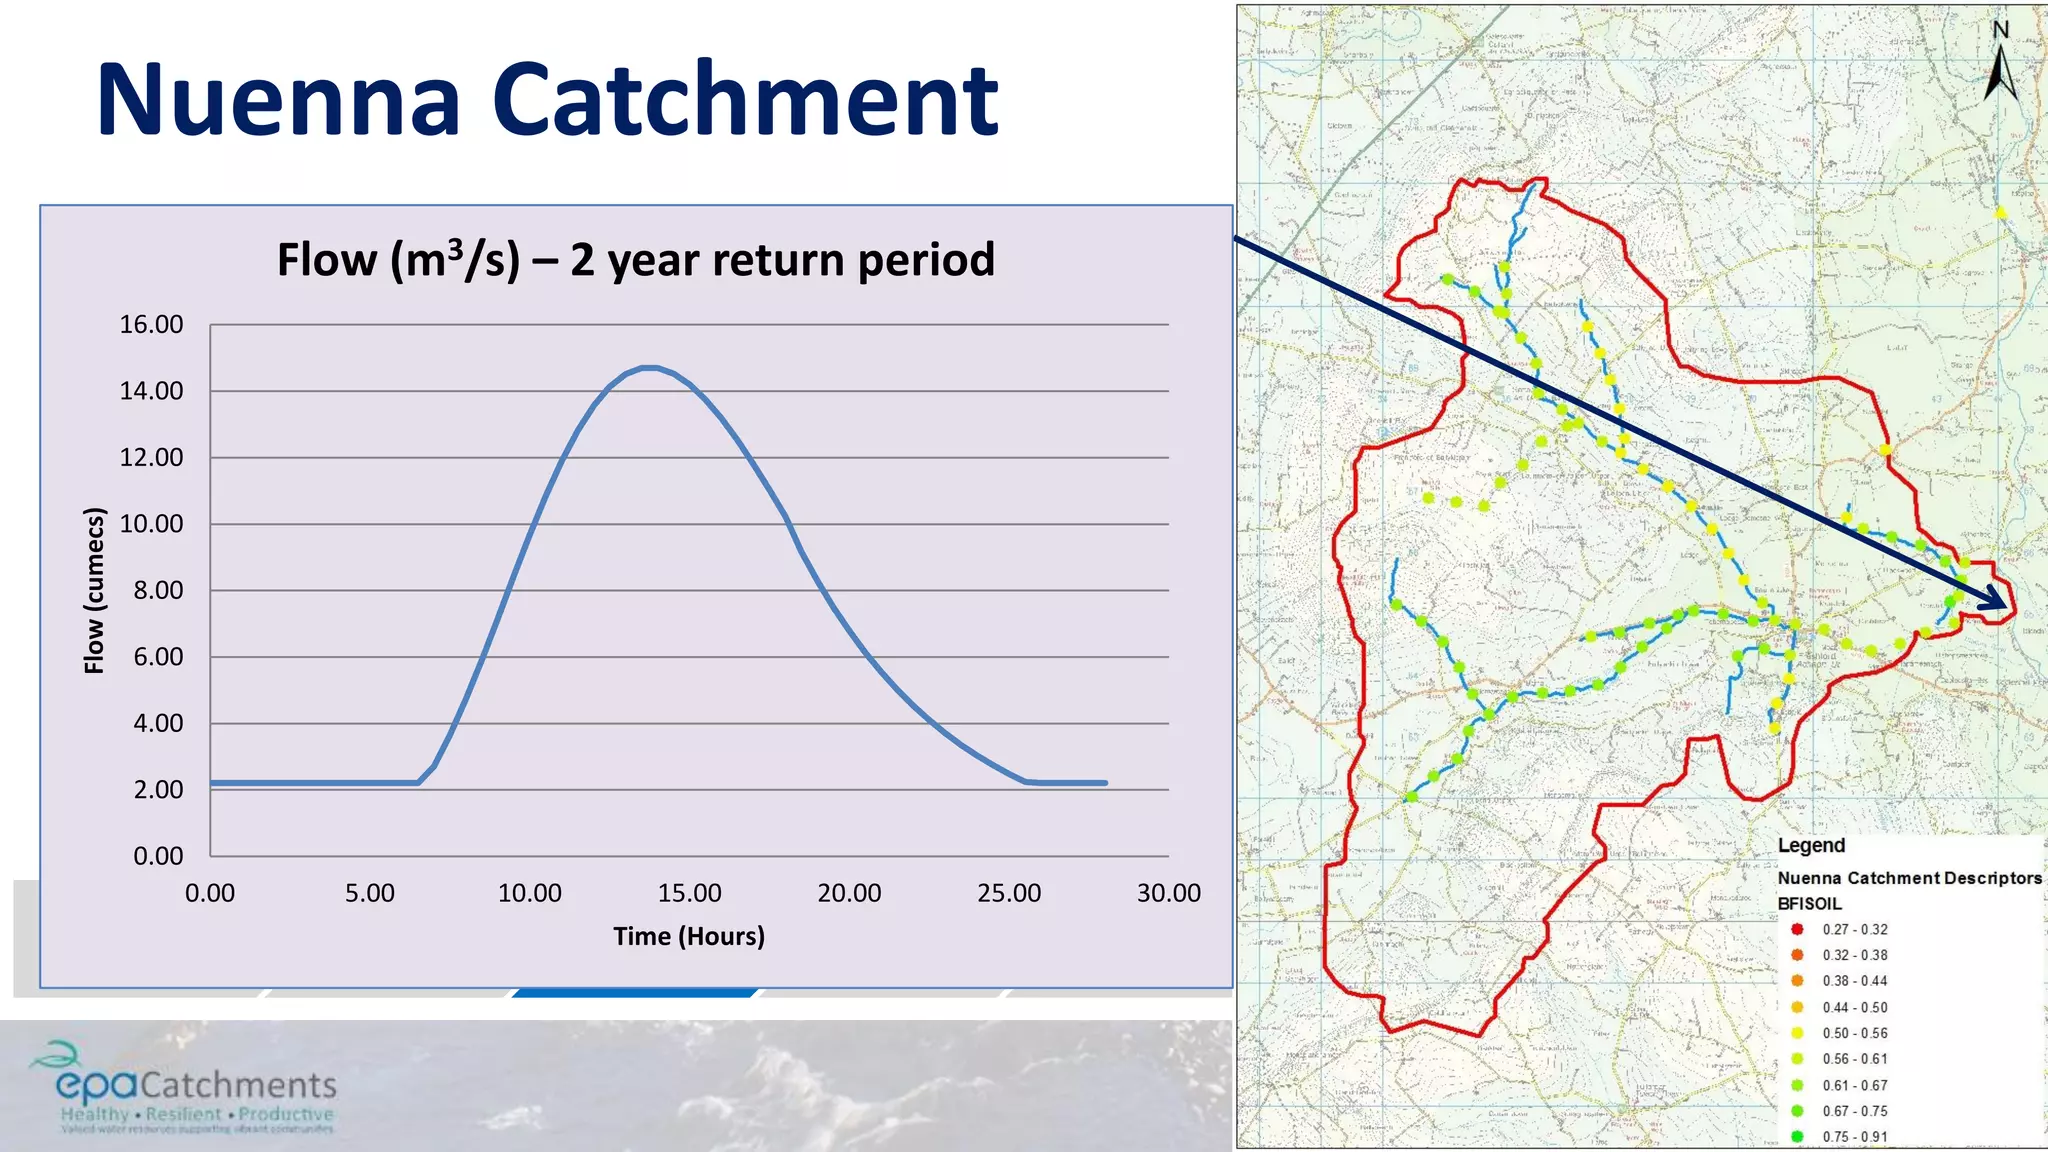
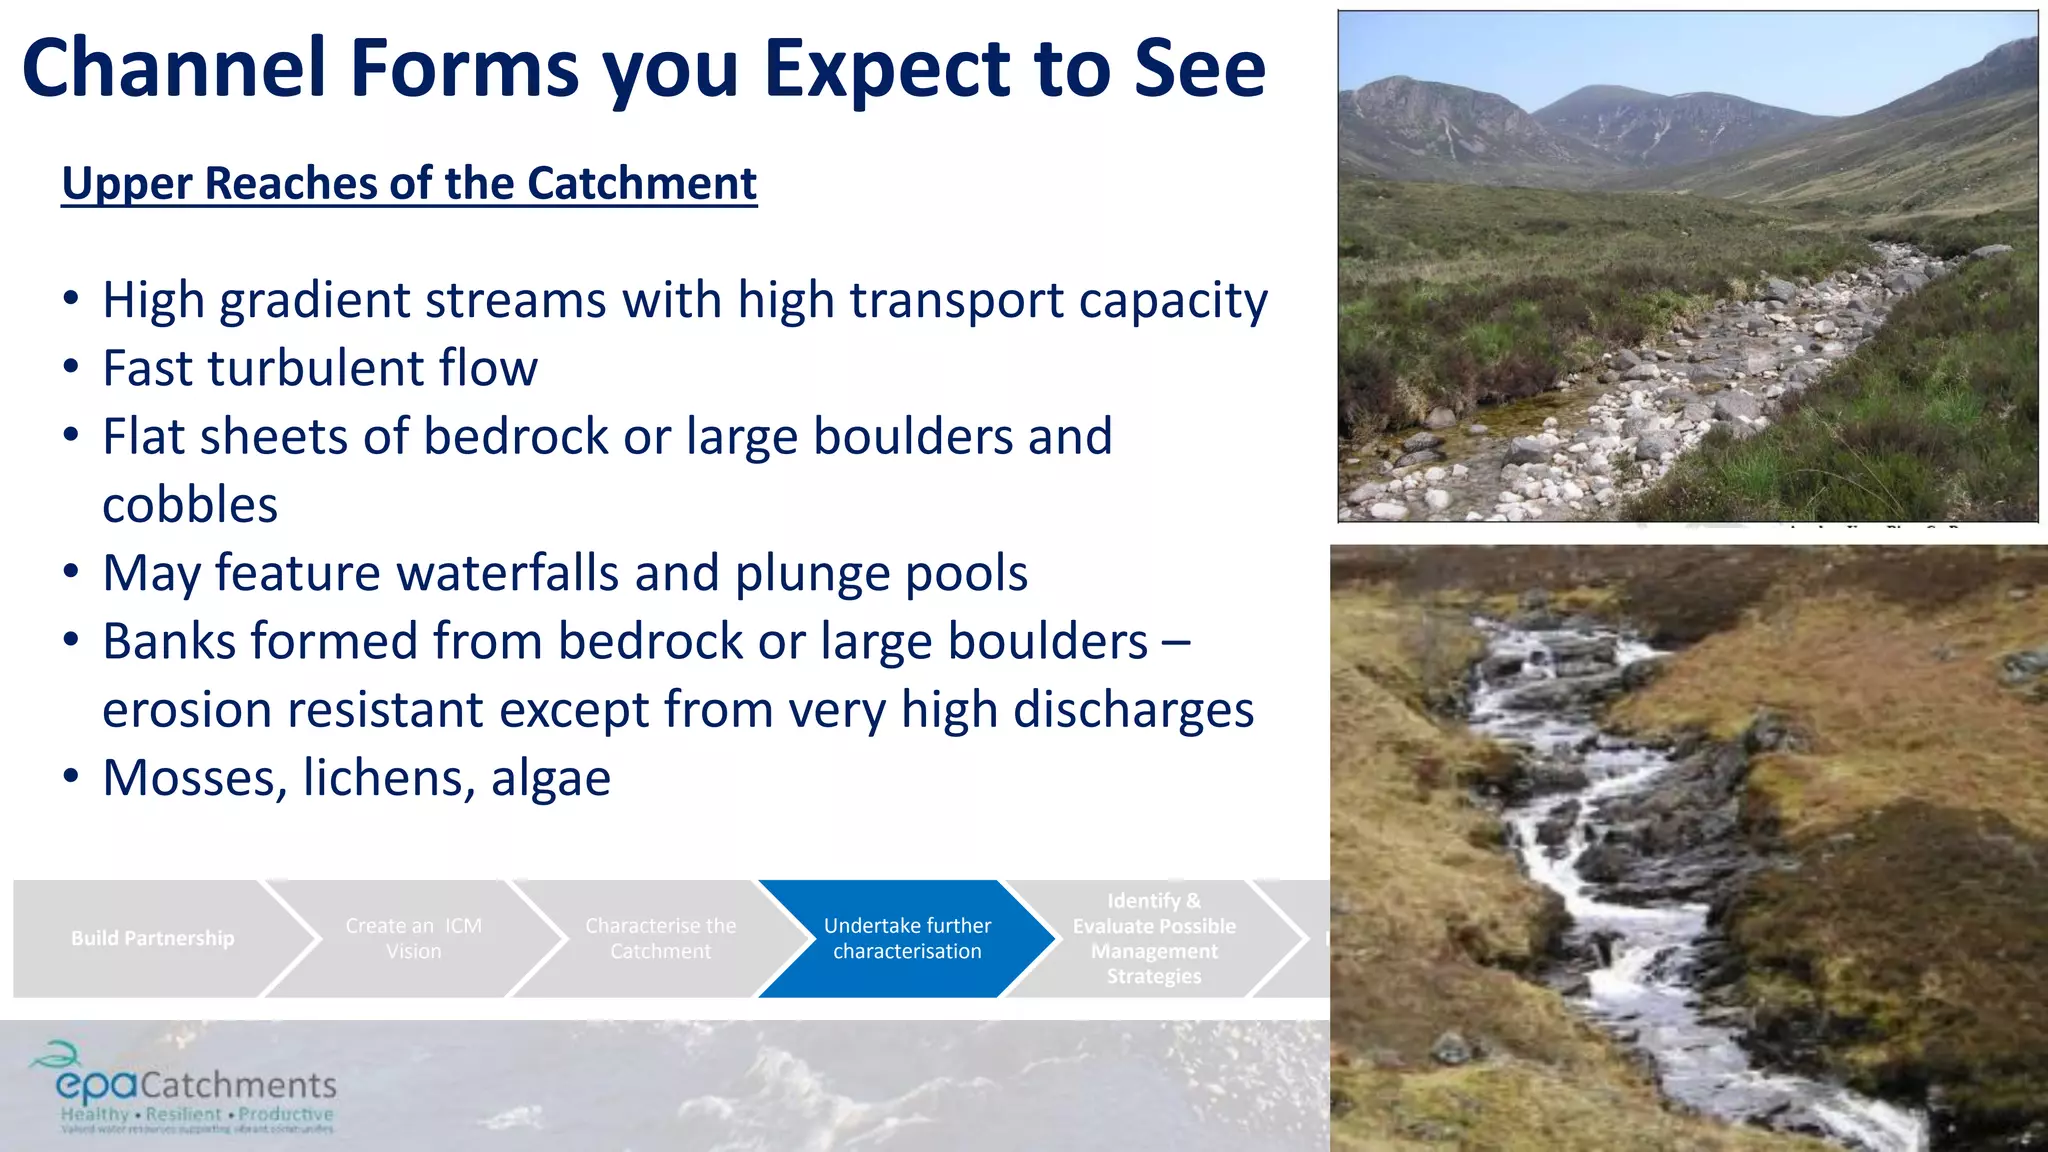
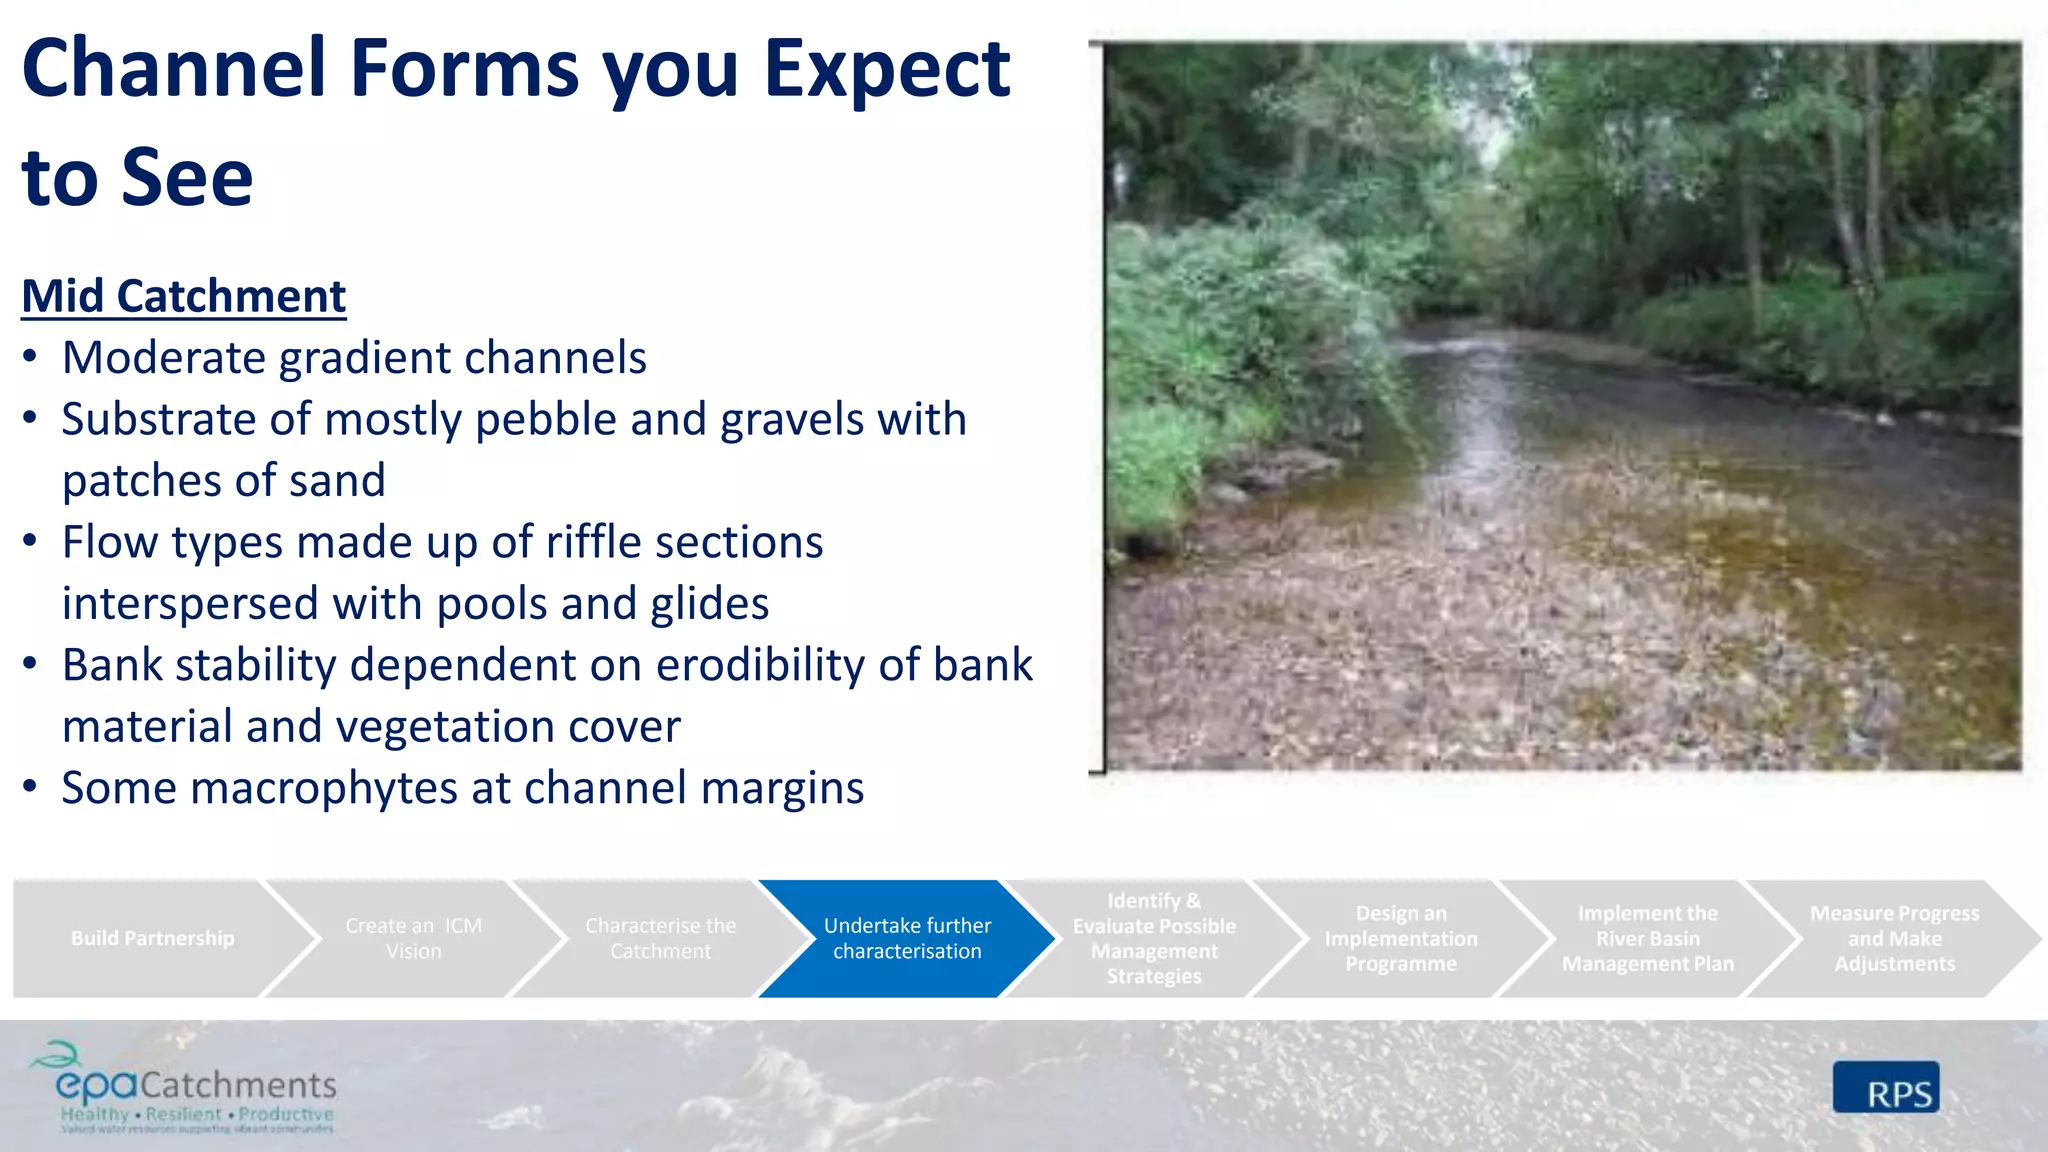
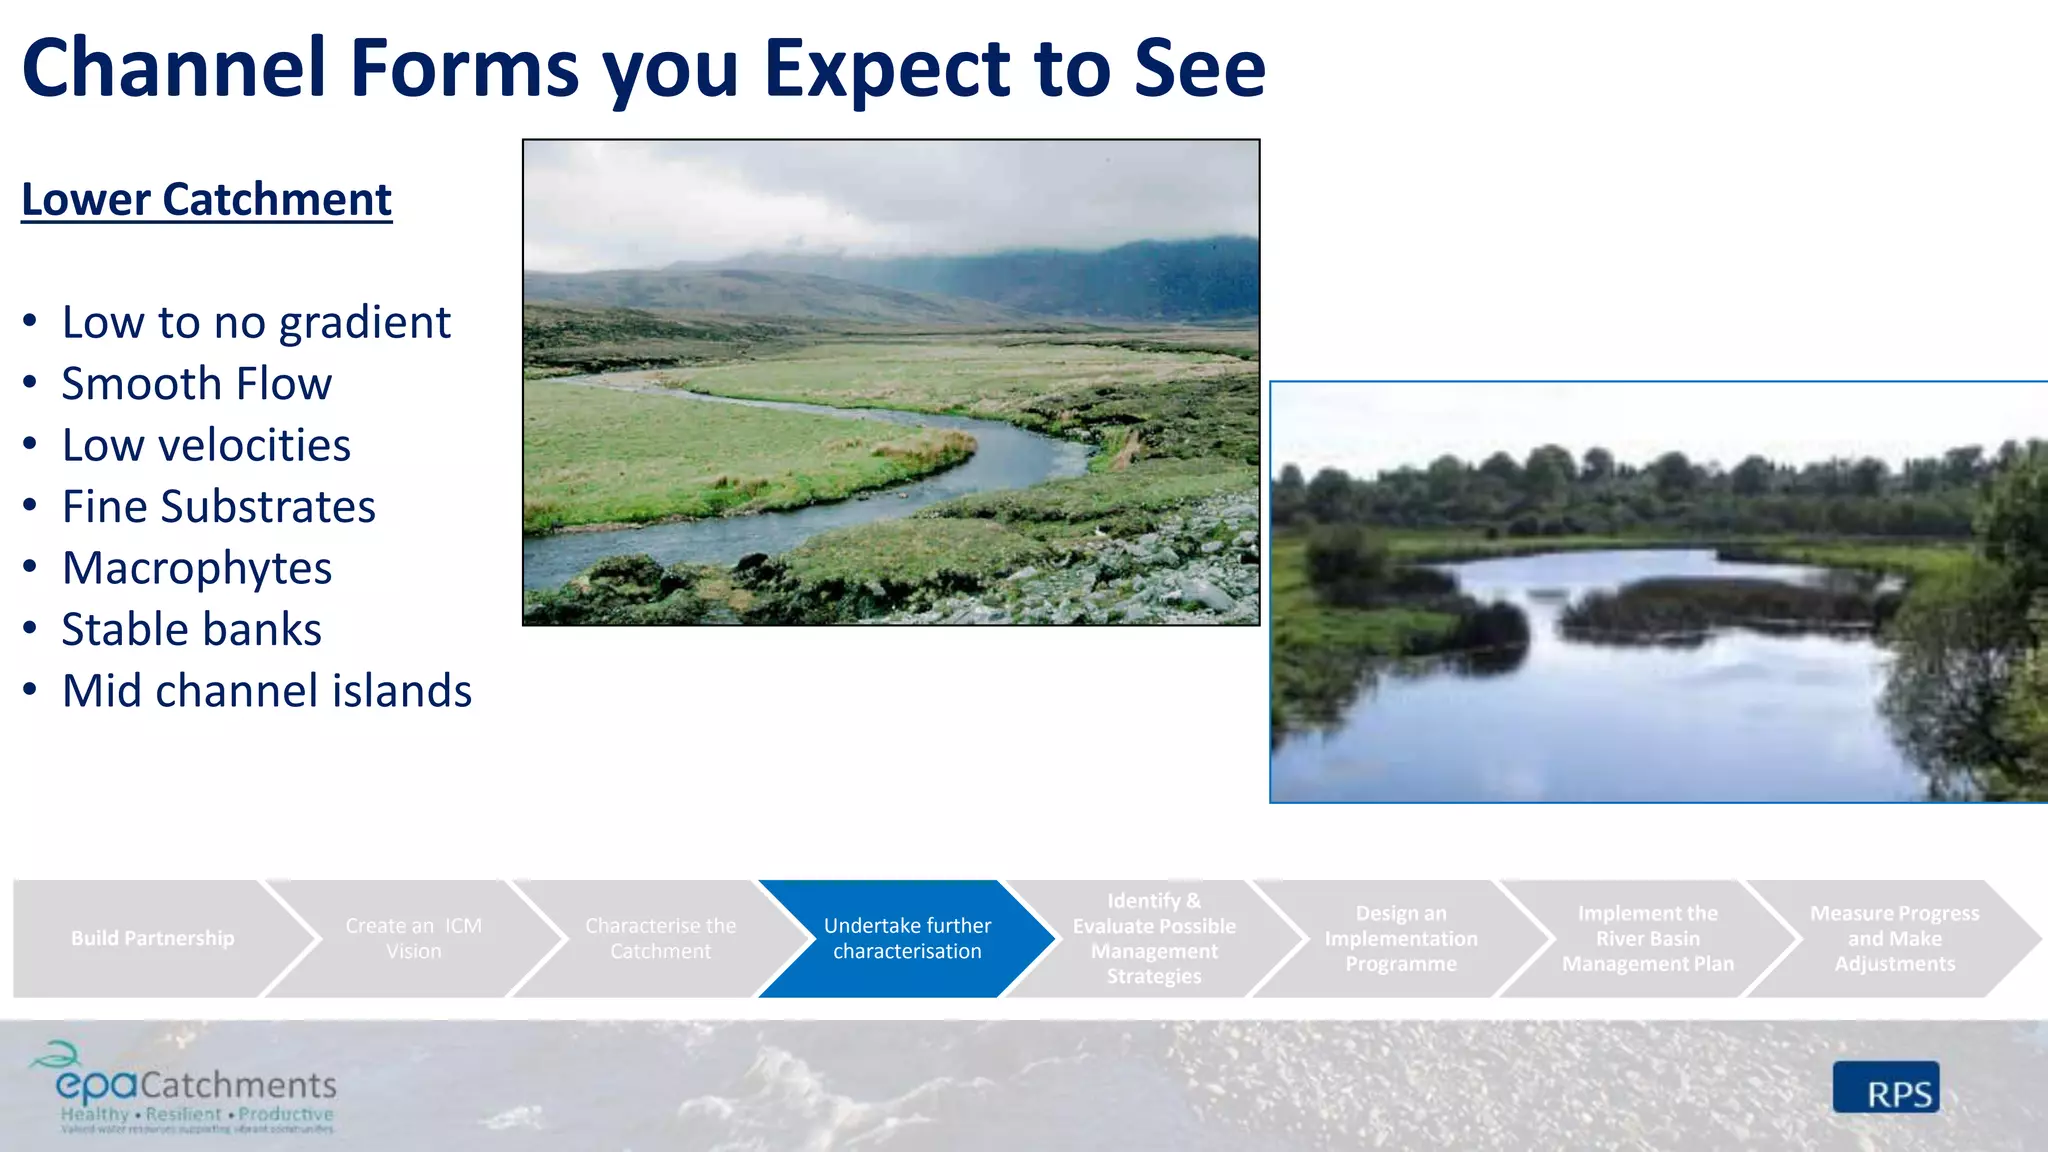
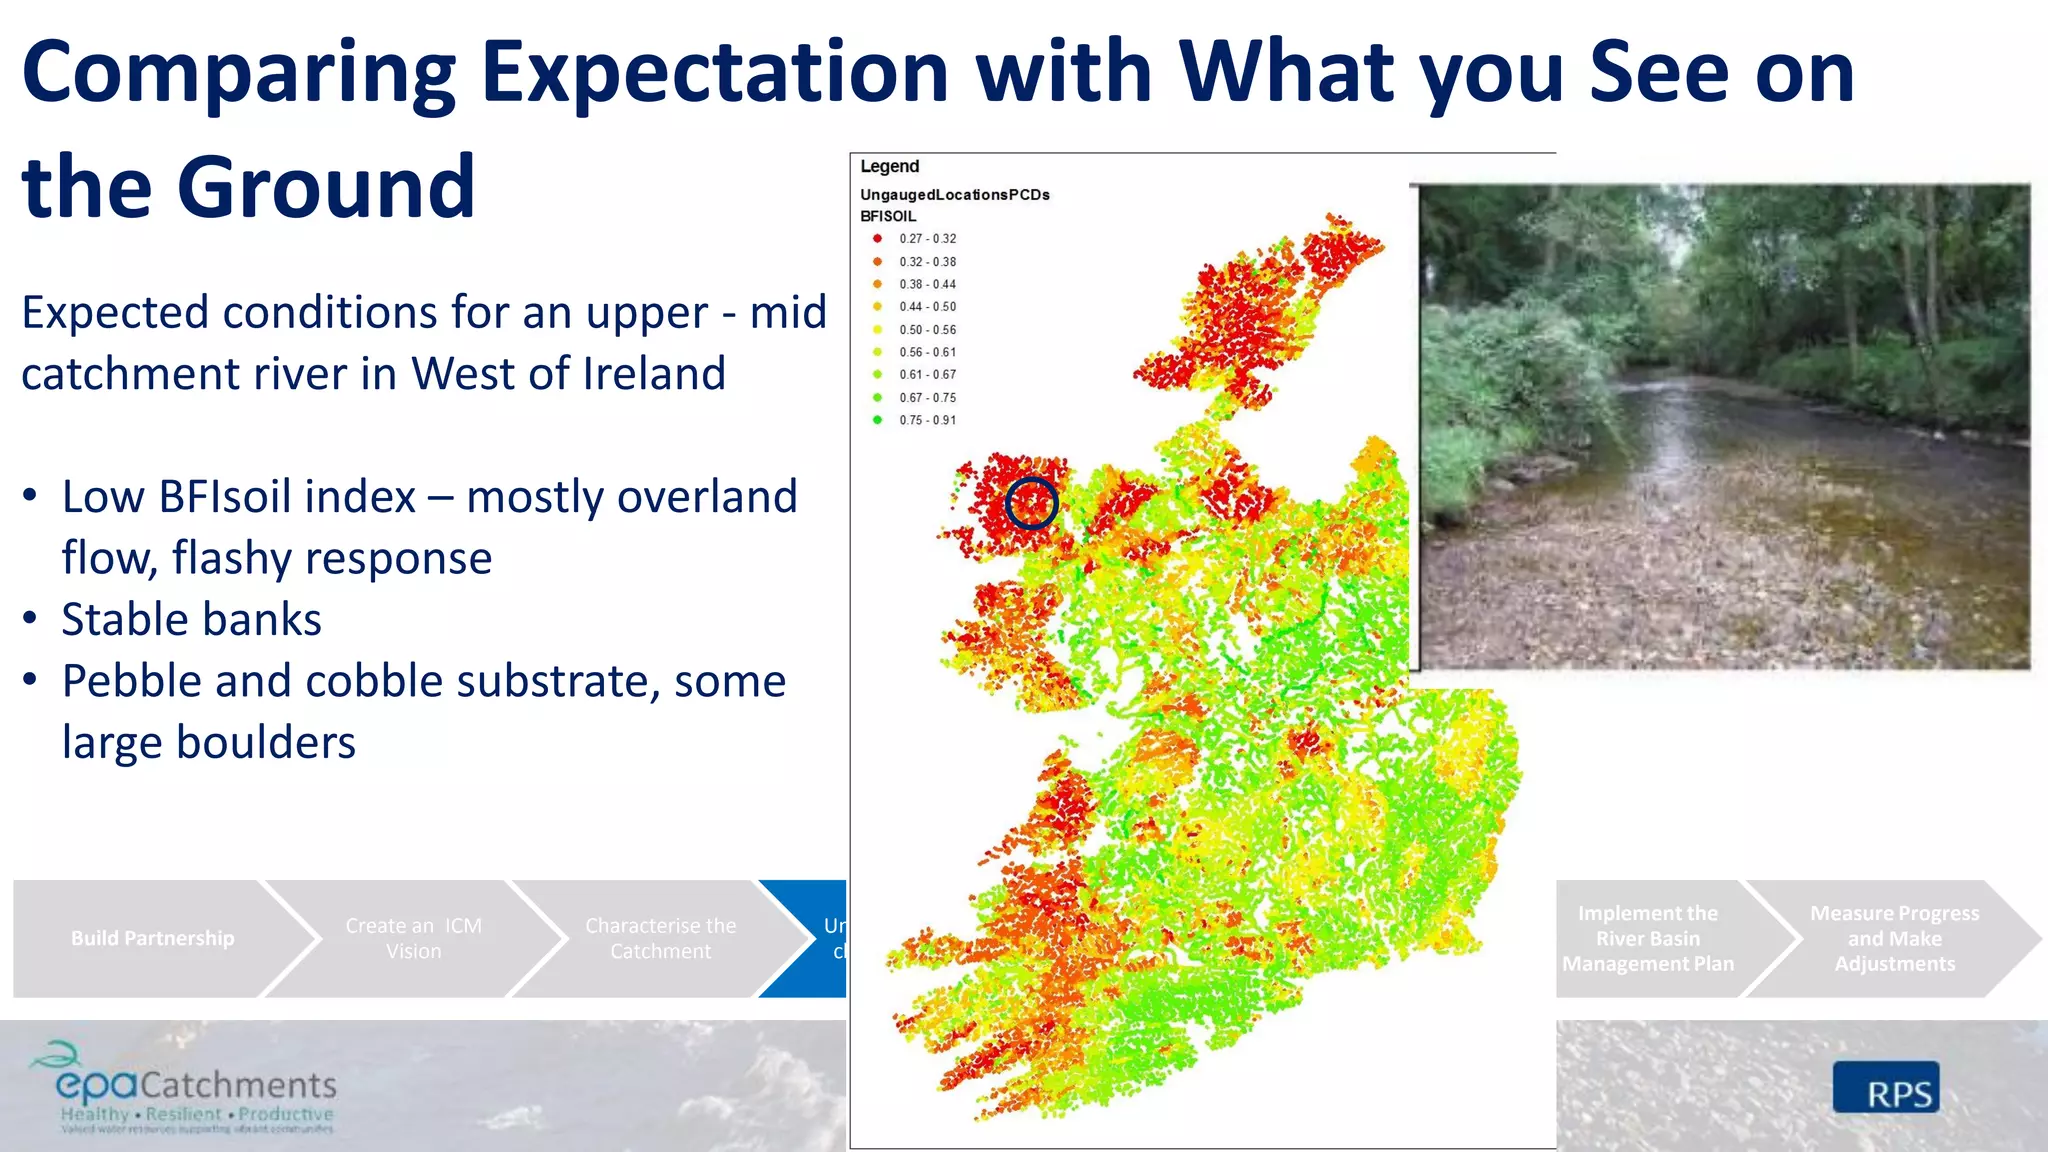
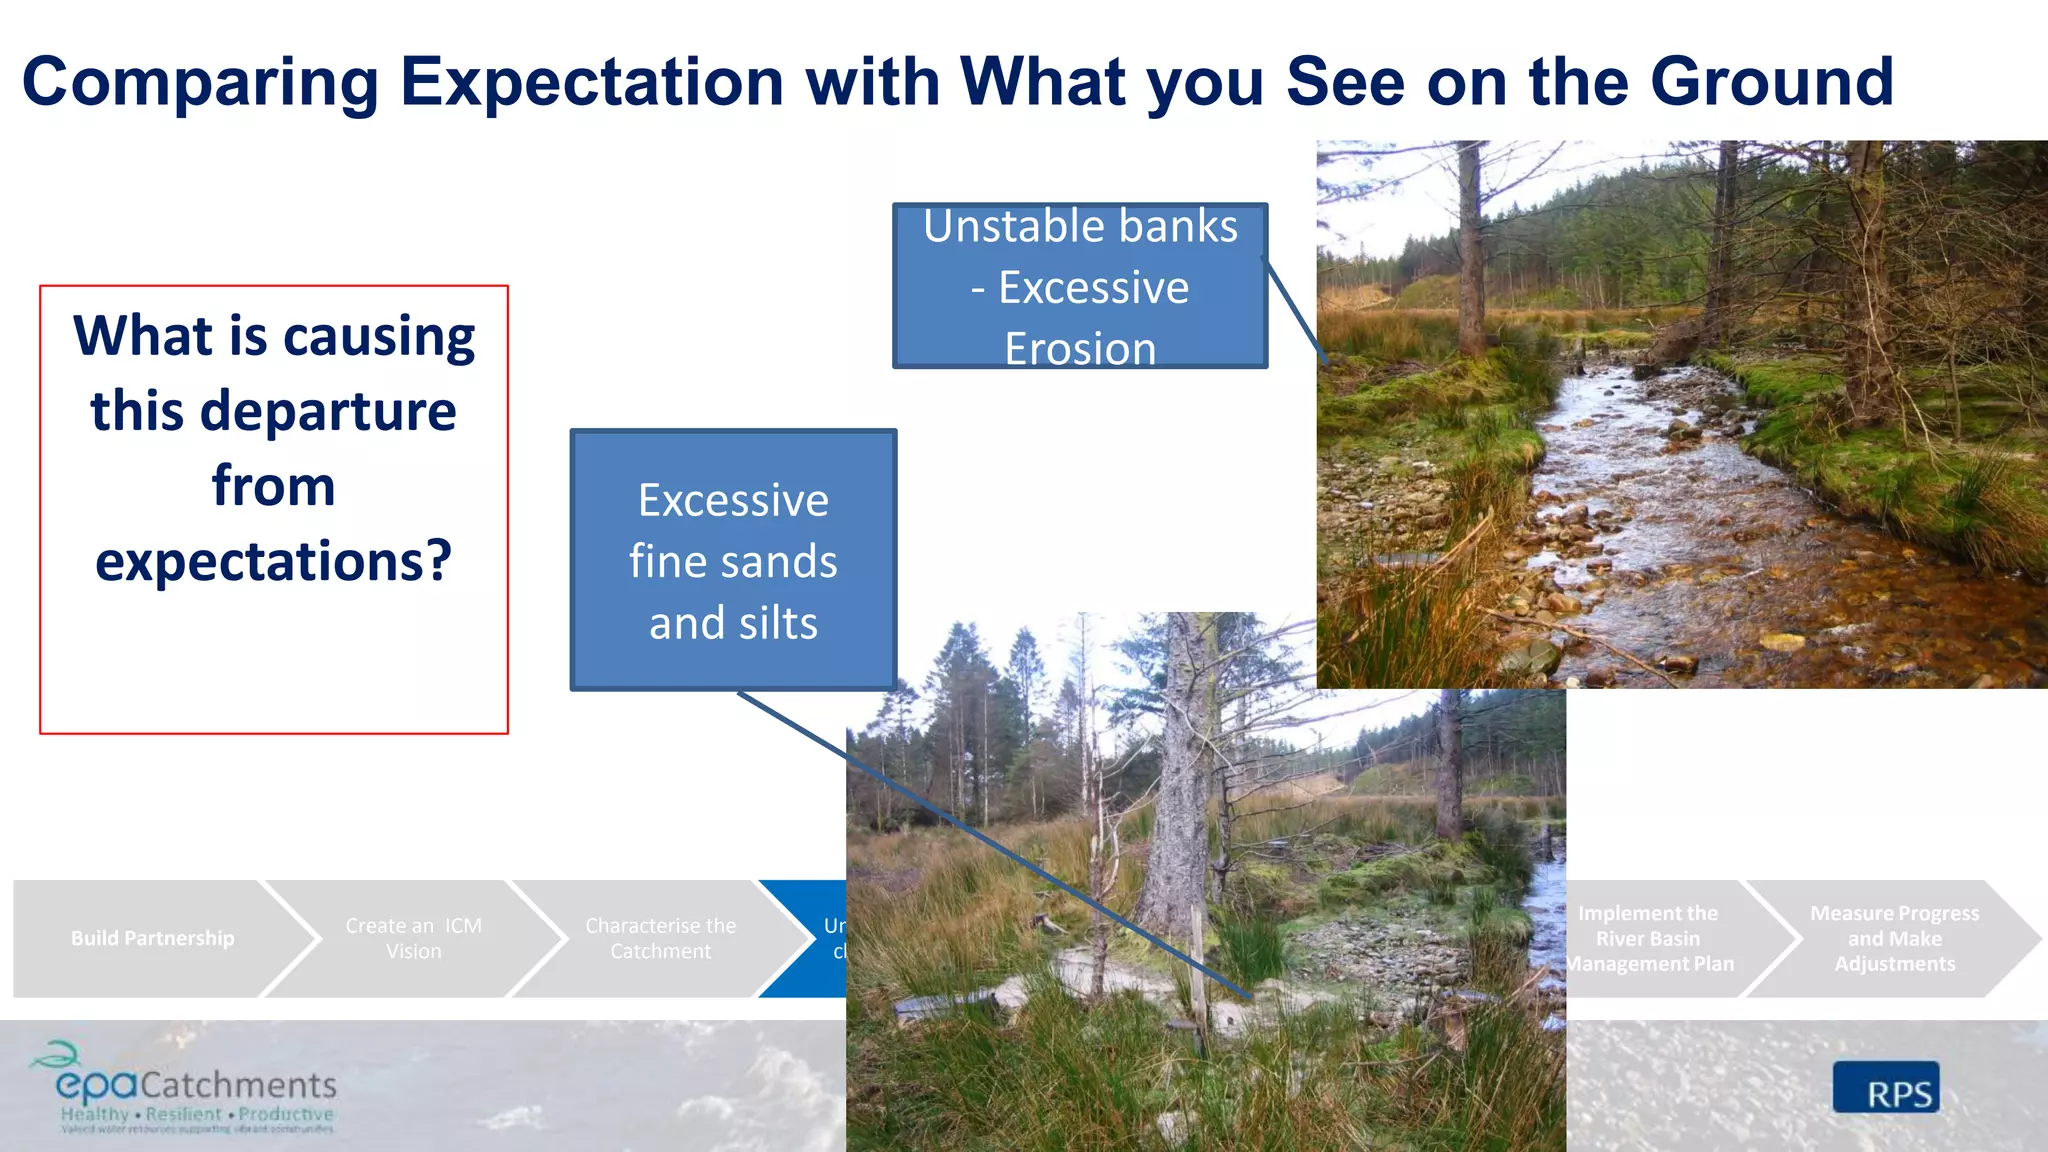
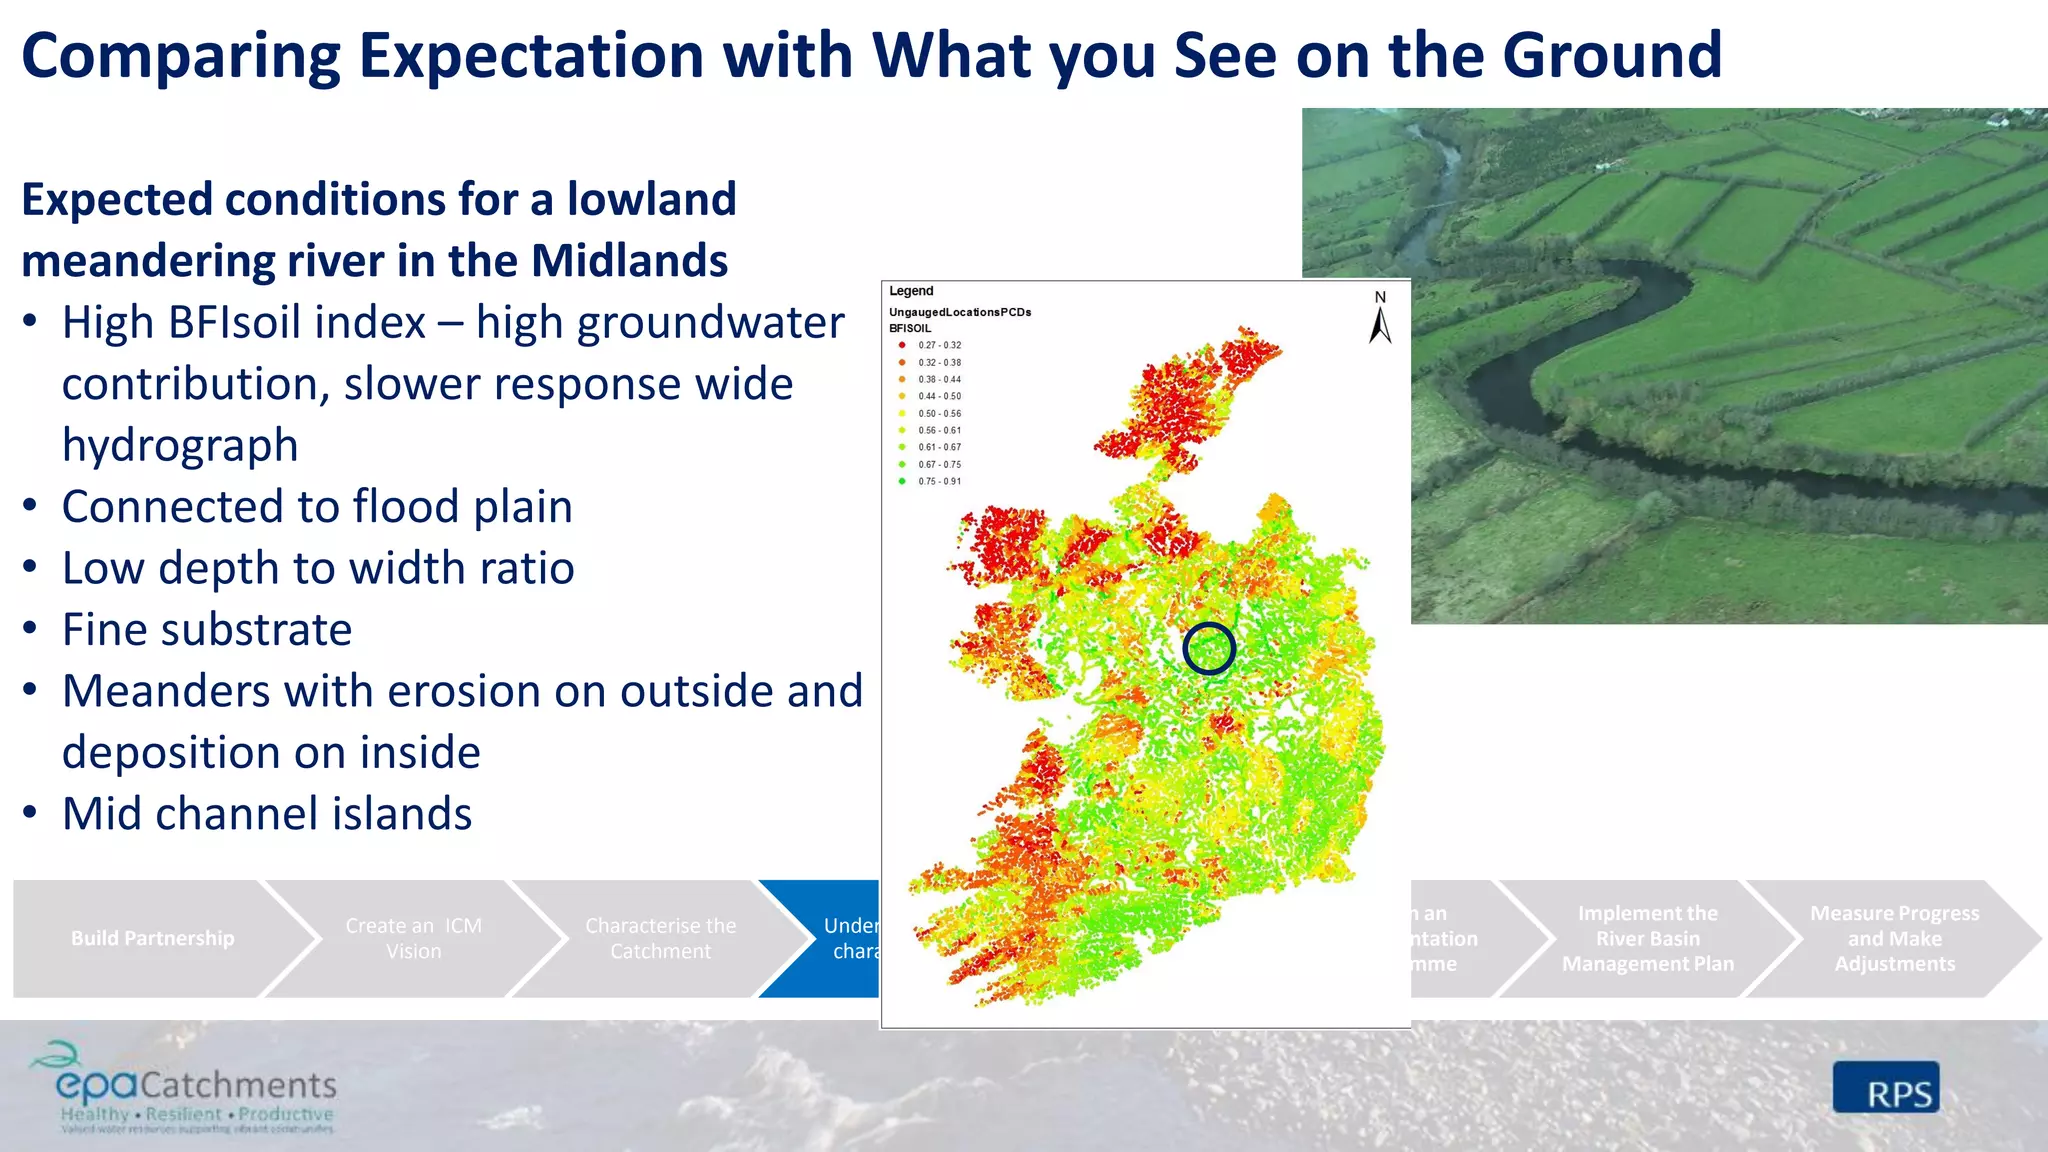
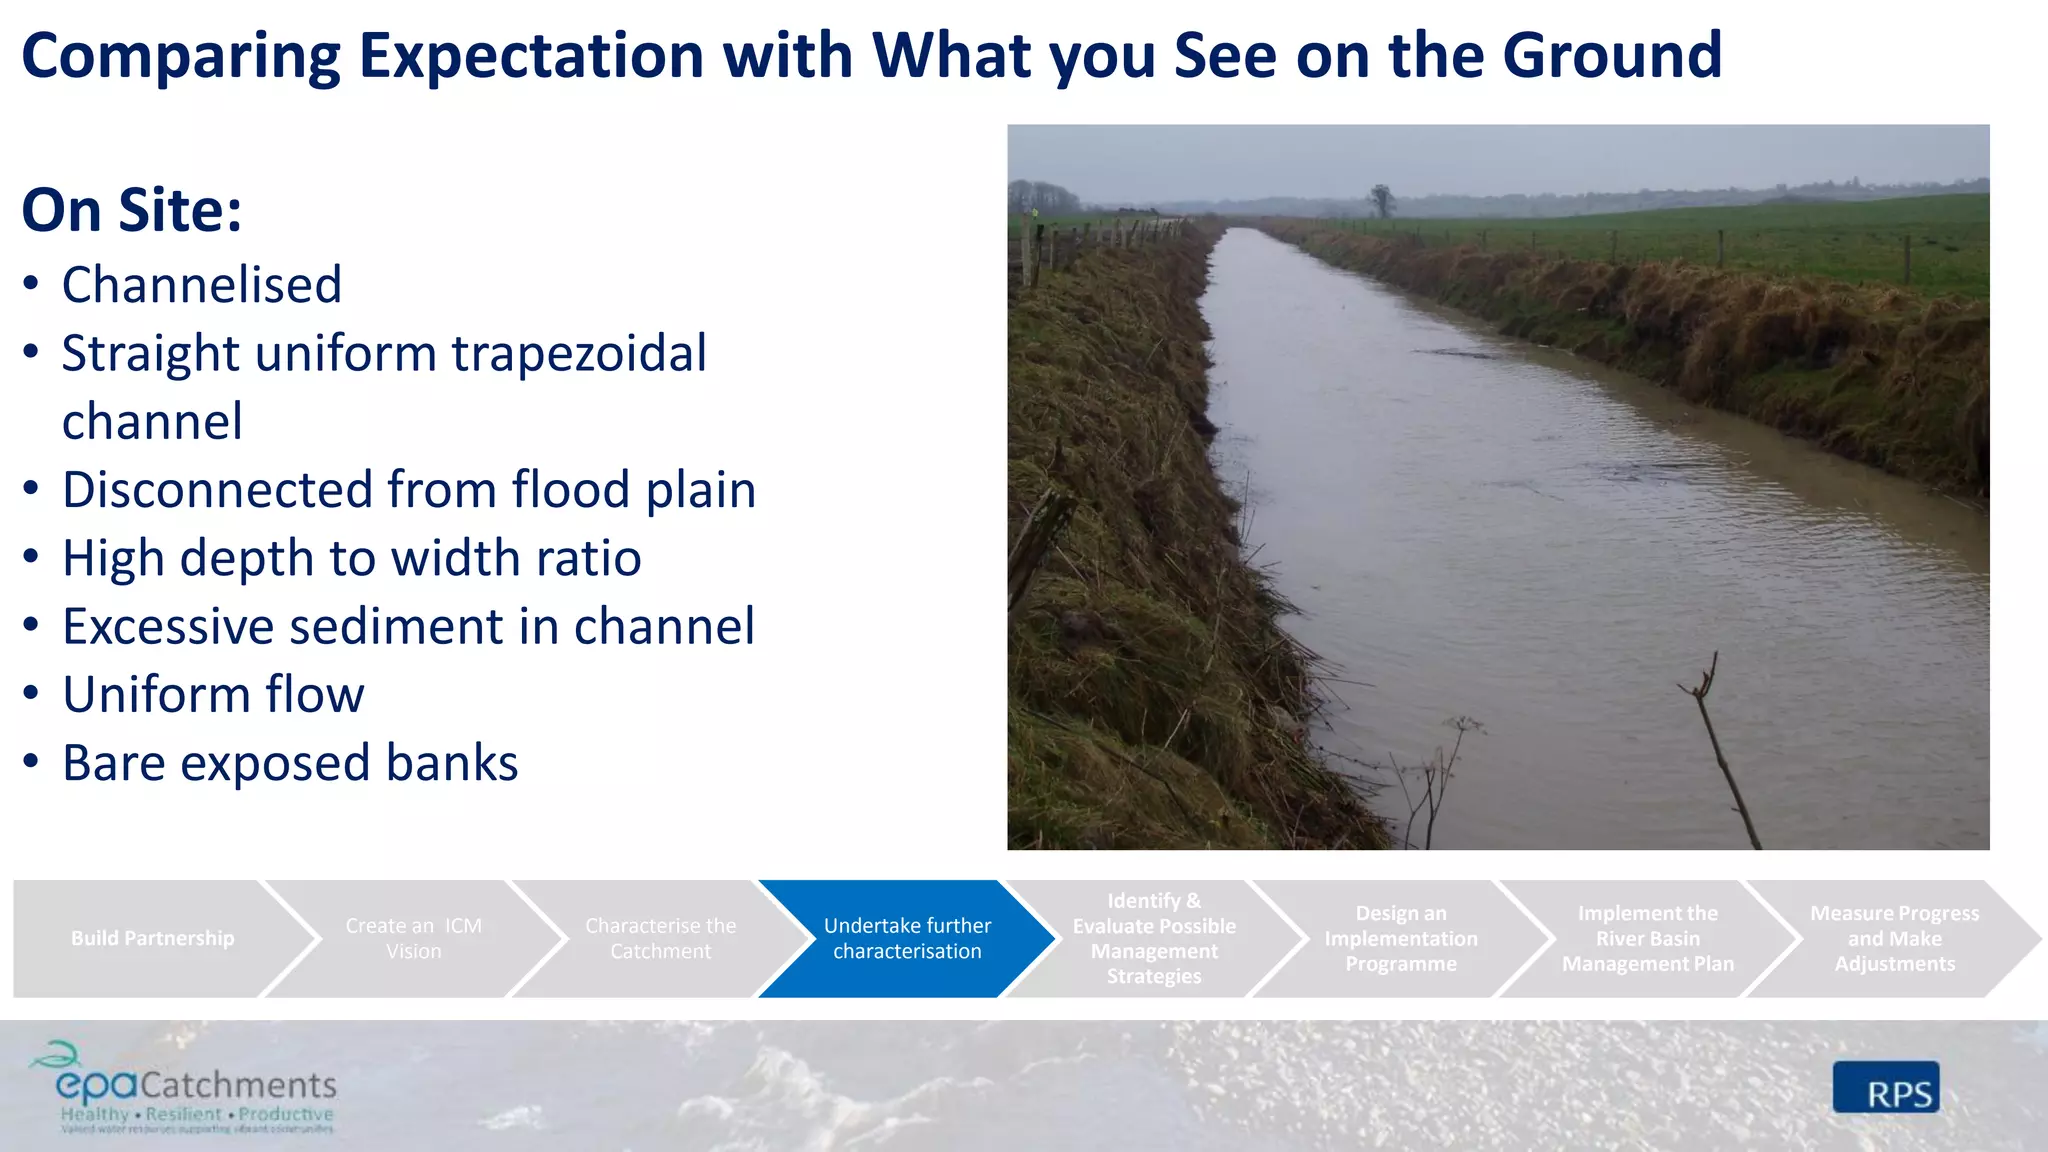
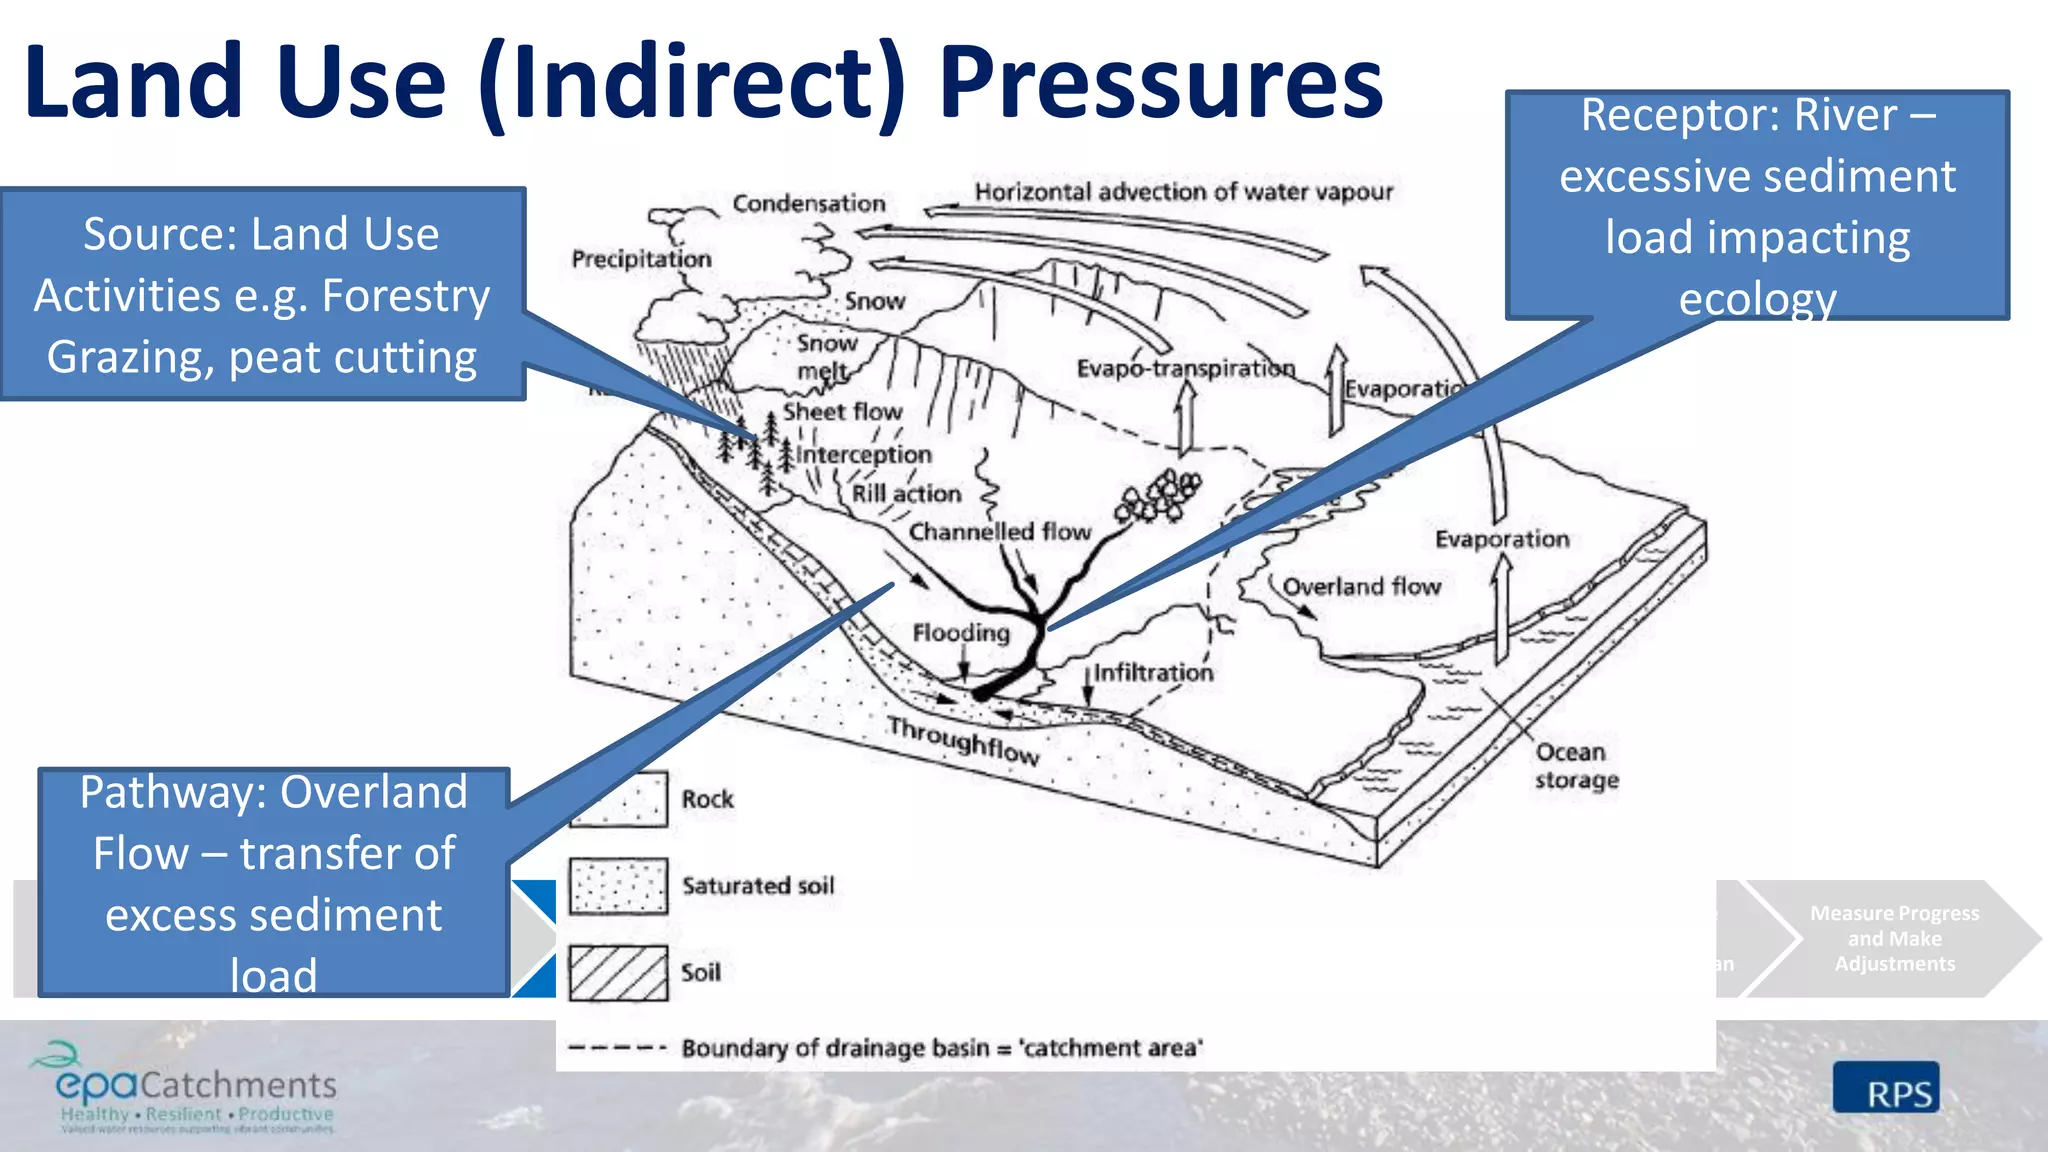
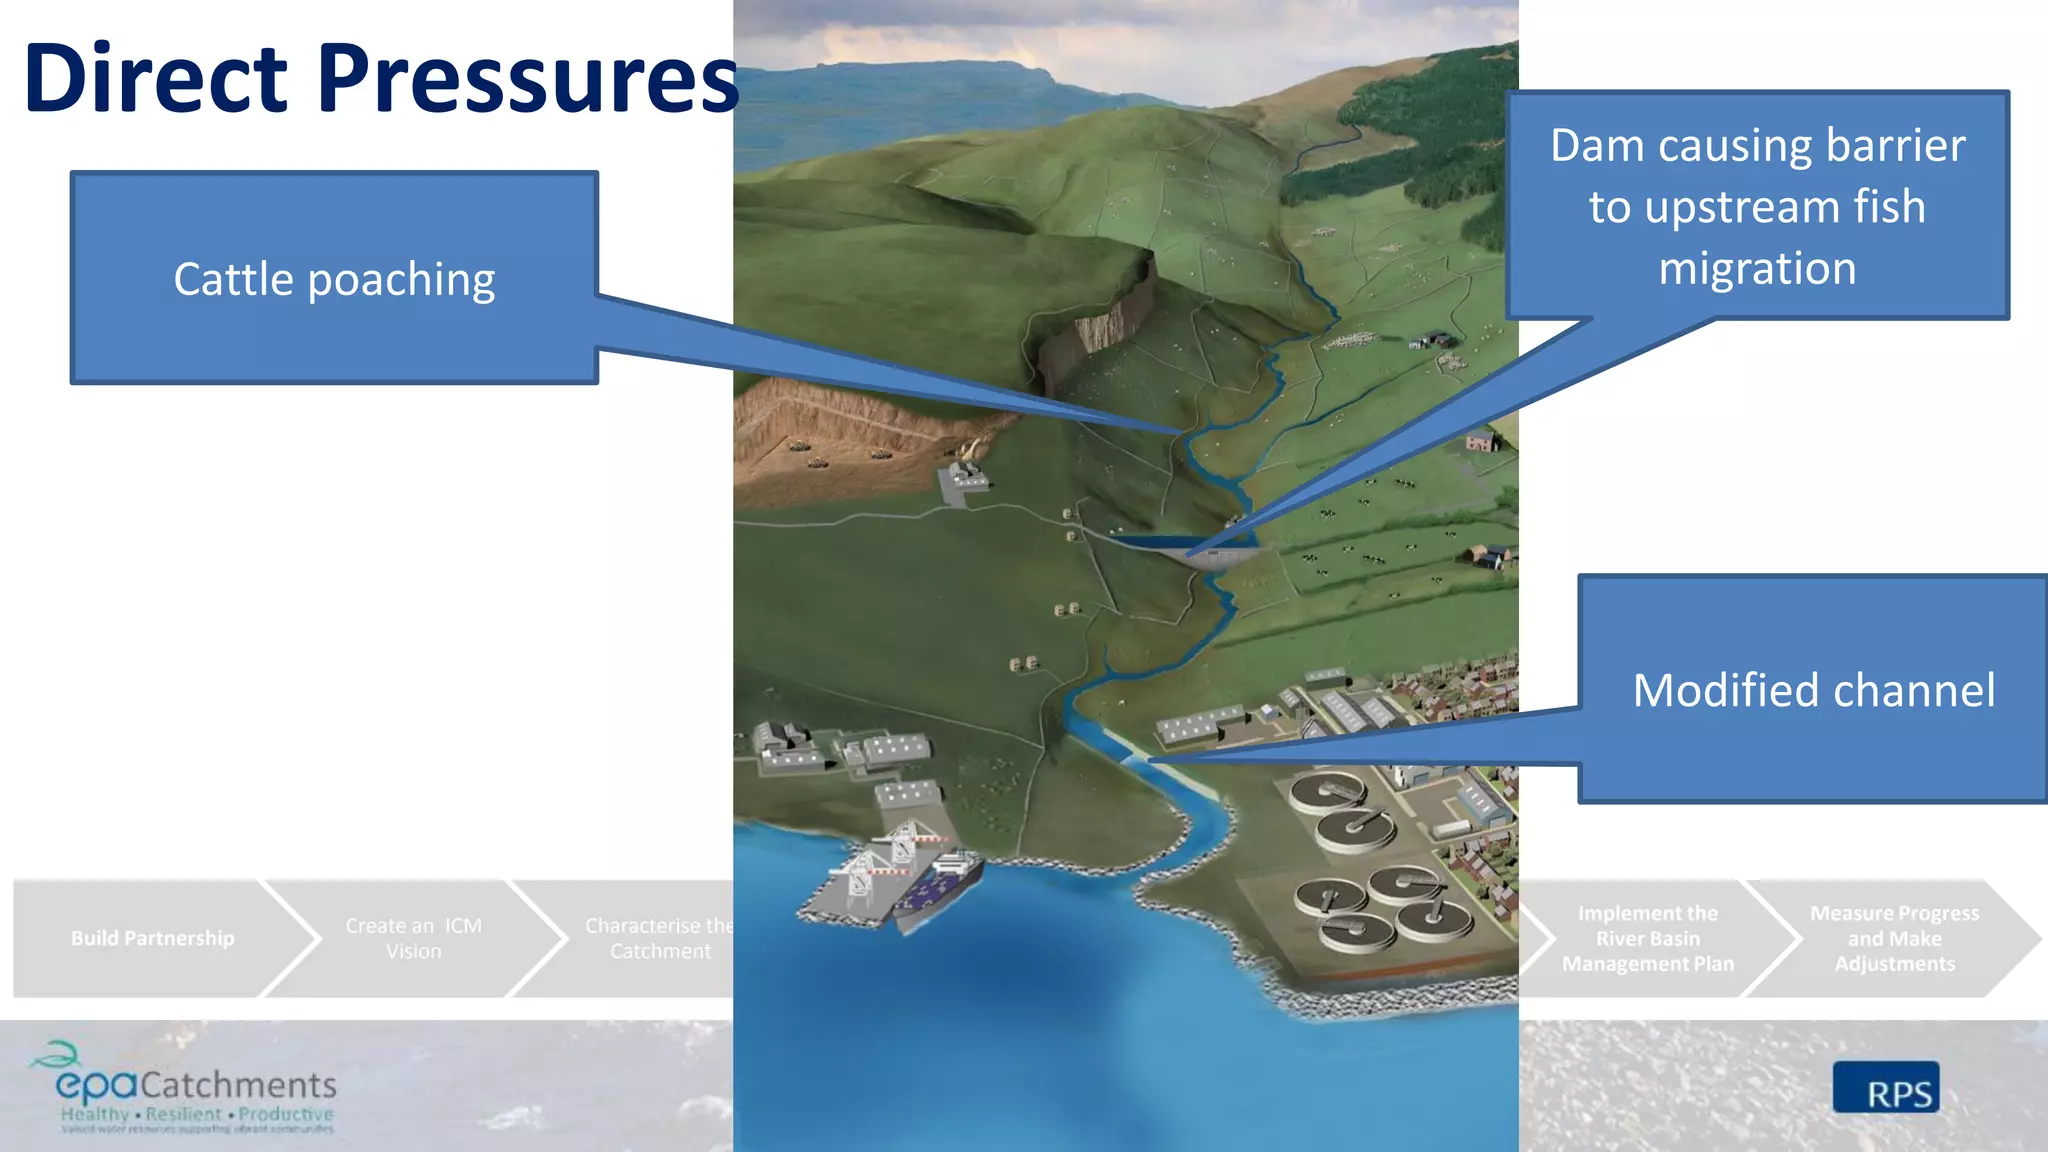
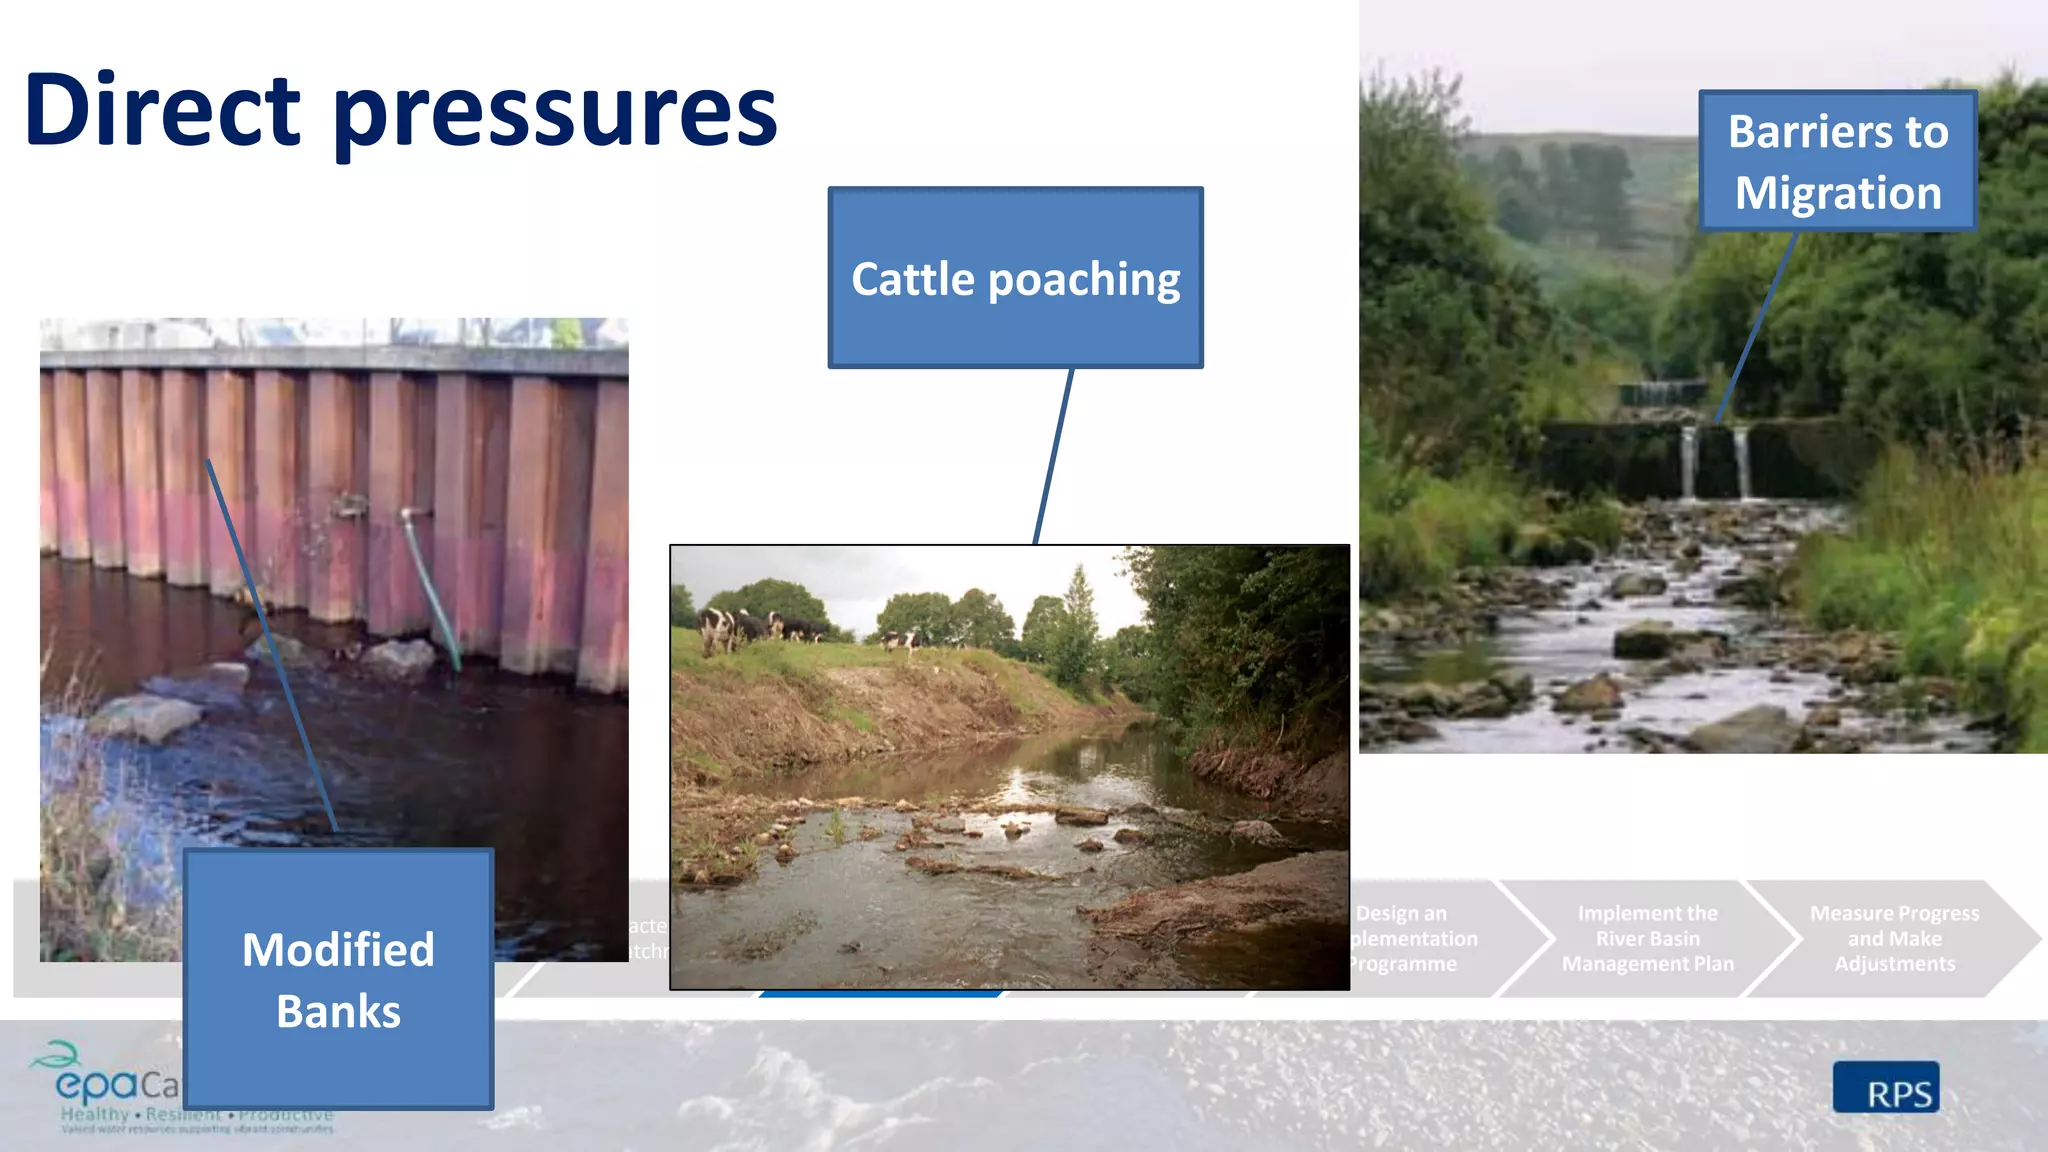
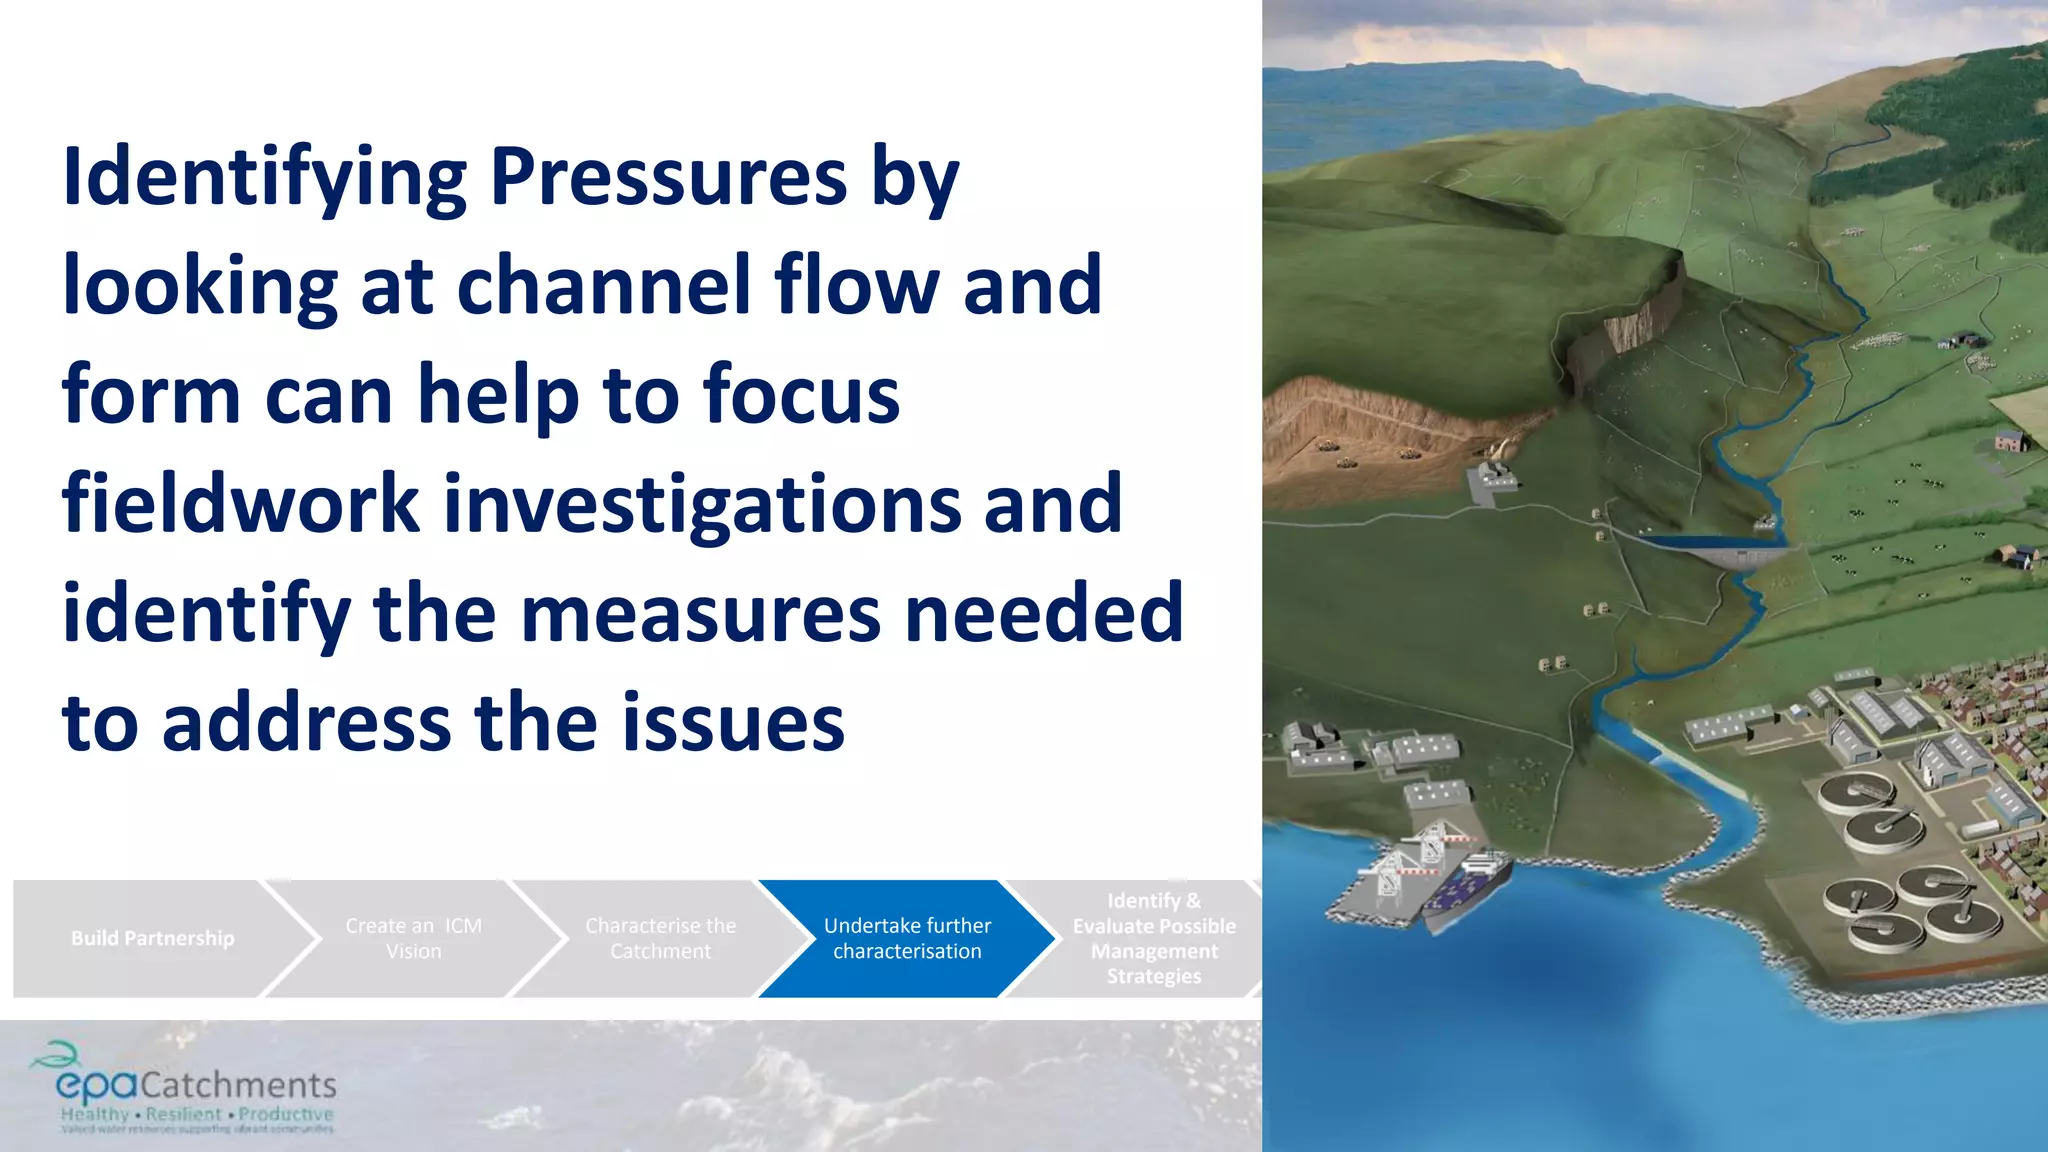
Catchment
Management
River Flow and Form
Build Partnership
Create an ICM
Vision
Characterise the
Catchment
Undertake further
characterisation
Identify &
Evaluate Possible
Management
Strategies
Design an
Implementation
Programme
Implement the
River Basin
Management Plan
Measure Progress
and Make
Adjustments
1. What Can River Flow and Form Tell Us?
2. Flow – What Data is Available?
3. The Hydrograph
4. Base Flow Index
5. What Determines Hydrograph Shape?
6. Catchment Descriptors
7. Hydrograph Examples including the Nuenna
8. Channel Form – Expectation vs what you see on the Ground
9. Recording Disturbance / Departure from Naturalness
10.Land Use (Indirect) Pressures
11.Direct Pressures
What can River Flow data tell us?
• Use in combination with nutrient concentrations to
calculate pollutant load
• Establish flow duration curves and estimate low flows for
assimilative capacity calculations
• Flood flows have power to lift and transport high
sediment loads
Build Partnership
Create an ICM
Vision
Characterise the
Catchment
Undertake further
characterisation
Identify &
Evaluate Possible
Management
Strategies
Design an
Implementation
Programme
Implement the
River Basin
Management Plan
Measure Progress
and Make
Adjustments
What can River Form tell us?
• Departure from reference condition
• Indication of pressures – a river’s form is not what you
expect to see for the type of channel and where it is in the
overall catchment
Build Partnership
Create an ICM
Vision
Characterise the
Catchment
Undertake further
characterisation
Identify &
Evaluate Possible
Management
Strategies
Design an
Implementation
Programme
Implement the
River Basin
Management Plan
Measure Progress
and Make
Adjustments
Build Partnership
Create an ICM
Vision
Characterise the
Catchment
Undertake further
characterisation
Identify &
Evaluate Possible
Management
Strategies
Design an
Implementation
Programme
Implement the
River Basin
Management Plan
Measure Progress
and Make
Adjustments
Flow – what data is available?
Hydrometric Data from Gauging Stations across Ireland – 216 with water
level and flow data that has some degree of confidence at higher flows.
• Water level is recorded
• Spot gaugings taken to
record water level and flow
• Rating relationship
developed
Build Partnership
Create an ICM
Vision
Characterise the
Catchment
Undertake further
characterisation
Identify &
Evaluate Possible
Management
Strategies
Design an
Implementation
Programme
Implement the
River Basin
Management Plan
Measure Progress
and Make
Adjustments
EPA maintain the Register of Hydrometric Stations in Ireland
EPA Hydronet website http://hydronet.epa.ie
• Download average flow
data for Local Authority
gauges
• Request continuous water
level and flow data and
annual maximum series
Flow – what data is available?
Build Partnership
Create an ICM
Vision
Characterise the
Catchment
Undertake further
characterisation
Identify &
Evaluate Possible
Management
Strategies
Design an
Implementation
Programme
Implement the
River Basin
Management Plan
Measure Progress
and Make
Adjustments
The Office of Public Works – approx 500 gauging stations with varying
data quality – www.opw.ie/hydro
• Download average flow and level data OPW
gauges
• Download annual maximum series
• Continually updated by OPW Hydrometric
Section
Flow – what data is available?
The Office of Public Works - FLOOD STUDIES UPDATE – WEB PORTAL
opw.hydronet.com
• Substantial update of the Flood Studies Report (NERC, 1975), that provided
methodologies for flood estimation in Ireland and the United Kingdom.
• Solely based on Irish Data.
Key outputs for Catchment Management:
• Review of hydrometric stations and creation of database of the 216 most reliable
in terms of flow data at higher flows.
• GIS based calculation of Physical Catchment Descriptors along every river in
Ireland – these datasets are key
Build Partnership
Create an ICM
Vision
Characterise the
Catchment
Undertake further
characterisation
Identify &
Evaluate Possible
Management
Strategies
Design an
Implementation
Programme
Implement the
River Basin
Management Plan
Measure Progress
and Make
Adjustments
Flow – what data is available?
Build Partnership
Create an ICM
Vision
Characterise the
Catchment
Undertake further
characterisation
Identify &
Evaluate Possible
Management
Strategies
Design an
Implementation
Programme
Implement the
River Basin
Management Plan
Measure Progress
and Make
Adjustments
Flow – what data is
available?
• Publicly available –
launched November 2014
• Provides links to other
hydrometric websites
• Excellent source of spatial
datasets on a national
basis
Build Partnership
Create an ICM
Vision
Characterise the
Catchment
Undertake further
characterisation
Identify &
Evaluate Possible
Management
Strategies
Design an
Implementation
Programme
Implement the
River Basin
Management Plan
Measure Progress
and Make
Adjustments
Flow – what data is
available?
Hydrometric Stations (216 )
•Annual maximum data (high flows)
•Continuous water level and flow series
Spatial Layers useful for catchment management
•Location of hydrometric stations
•Ungauged catchment descriptors (133846 locations)
•Gauged (216) and Ungauged catchment boundaries
•Rivers
•Lakes
•Hydrometric areas
•Cities and Towns
•River Basin Districts
•Townlands
•Depth Duration Frequency grid points for rainfall
All
downloadable
from the FSU
WEB Portal
Build Partnership
Create an ICM
Vision
Characterise the
Catchment
Undertake further
characterisation
Identify &
Evaluate Possible
Management
Strategies
Design an
Implementation
Programme
Implement the
River Basin
Management Plan
Measure Progress
and Make
Adjustments
Flow – what data is
available?
www.waterlevel.ie
Build Partnership
Create an ICM
Vision
Characterise the
Catchment
Undertake further
characterisation
Identify &
Evaluate Possible
Management
Strategies
Design an
Implementation
Programme
Implement the
River Basin
Management Plan
Measure Progress
and Make
Adjustments
The Hydrograph
• Hydrograph is the sum of all water discharging to
the river
• Pathways to the river:
1. Overland Flow: Surface runoff & flows in land drains
2. Interflow: seepage through soils and subsoils
3. Shallow Groundwater Flow: through weathered rock
4. Deep Groundwater Flow: Groundwater flow beneath the
water table that interacts with the surface water system
5. Discrete Fault or Conduit Flow
• Base Flow Index (BFI) = (Qi+Qg) / Q (0 to 1) (Deakin 2012)
BFI is a good
indicator of
hydrological
response
Build Partnership
Create an ICM
Vision
Characterise the
Catchment
Undertake further
characterisation
Identify &
Evaluate Possible
Management
Strategies
Design an
Implementation
Programme
Implement the
River Basin
Management Plan
Measure Progress
and Make
Adjustments
Base Flow Index
• The FSU WEB Portal can provide estimated
BFI data for all ungauged catchments
• Estimated using combination of nearby
gauge data and soil / aquifer data
• BFIsoil index is a useful summary of the
hydrological behaviour of rivers at a
catchment scale (FSU WP 5.2)
• Ratio between 0 and 1
• Lower values indicate greater contribution
from overland flow i.e. Quicker response,
higher potential for sediment transfer
0
0.5
1
1.5
2
2.5
3
3.5
4
4.5
5
02/11
/2009
04/11
/200906/11
/2009
08/11
/2009
10/11
/200912/11
/2009
14/11
/200916/11
/2009
18/11
/2009
20/11
/200922/11
/2009
24/11
/2009
26/11
/200928/11
/2009
30/11
/2009
02/12
/200904/12
/2009
06/12
/2009
08/12
/200910/12
/2009
12/12
/2009
14/12
/200916/12
/2009
25017
26007
What determines hydrograph shape?
Meteorological
Characteristics– the driver
Generally precipitation
dominates the Rising Limb
Catchment descriptors control
the response
Recession Limb is determined by
catchment characteristics
Baseflow
Gauging Station No.
Catchment Descriptors
• Shape of the drainage
basin (catchment)
• Drainage density
• Slope
Influences the time taken for water from the remote
parts of the catchment to arrive at the outlet
Area C1 Area C2
Area C1 Area C2
Catchment Descriptors
• Geology (permeable/impermeable)
• Soil type (permeable, deep, shallow etc)
• Landuse (urban, forest, agriculture)
• Presence of bogs, turloughs, lakes and reservoirs
• Artificial drainage schemes
Control surface water runoff, shape of recession limb
Part of BFIsoil
Channel and floodplain characteristics
- cross-section shape
- channel roughness
- online reservoirs
- floodplain storage
Control conveyance (in-channel flow)
Assume that only one factor changes
Amount of storm rainfall increases
Duration of storm increases
Storm changes from complete coverage of the catchment to
only partial coverage
Rate of snowmelt increases
Catchment size increases
Catchment slope changes from steep to flat
Landuse changes from rural to urban
Catchment is wet prior to the storm
Fields ploughed along the contours are ploughed across the
contours
Geology changes from clay to limestone
Flood peak
Increases
Decreases
Decreases
Increases
Increases
Decreases
Increases
Increases
Increases
Decreases
Build Partnership
Create an ICM
Vision
Characterise the
Catchment
Undertake further
characterisation
Identify &
Evaluate Possible
Management
Strategies
Design an
Implementation
Programme
Implement the
River Basin
Management Plan
Measure Progress
and Make
Adjustments
Flow(cumecs)
Time
Catchment 'X' - Reduced
Vegetation
Catchment 'X'
Reduction in Time to
Peak
Higher Peak Flow
Example:
Overgrazing
Build Partnership
Create an ICM
Vision
Characterise the
Catchment
Undertake further
characterisation
Identify &
Evaluate Possible
Management
Strategies
Design an
Implementation
Programme
Implement the
River Basin
Management Plan
Measure Progress
and Make
Adjustments
Catchment Y
Attenuation
Catchment Y No
Attenuation
Lower Peak Flow
Longer recession limb
Example:
Flow attenuation
Build Partnership
Create an ICM
Vision
Characterise the
Catchment
Undertake further
characterisation
Identify &
Evaluate Possible
Management
Strategies
Design an
Implementation
Programme
Implement the
River Basin
Management Plan
Measure Progress
and Make
Adjustments
Nuenna Catchment
AREA: 92 km2
SAAR: 859 mm
URBAN EXTENT: 0.2%
DRAINAGE DENSITY: 0.83 km/km2
SLOPE: 13.2m/km
FARL: 1
BFIsoil: 0.57
Use FSU WEB Portal
to get catchment
descriptors and
estimate:
• Index Flow (Annual
maximum - 15 m3/s)
• Flood Frequencies
• Hydrograph Shape
This can be done at
any of the 100 nodes
points shown in the
catchment
Nuenna Catchment
Build Partnership
Create an ICM
Vision
Characterise the
Catchment
Undertake further
characterisation
Identify &
Evaluate Possible
Management
Strategies
Design an
Implementation
Programme
Implement the
River Basin
Management Plan
Measure Progress
and Make
Adjustments
0.00
2.00
4.00
6.00
8.00
10.00
12.00
14.00
16.00
0.00 5.00 10.00 15.00 20.00 25.00 30.00
Flow(cumecs)
Time (Hours)
Flow (m3/s) – 2 year return period
Build Partnership
Characterise
Watershed
Set Goals and
Identify
Solutions
Design
Implementation
Program
Implement
Program
Make Progress
Make
Adjustments
Improve Plan•Largely dictated by topography
•Ireland has a relatively flat landscape surrounded by coastal hills.
•Channels vary from steep fast flowing upland narrow streams to wide, shallow
and sluggish lowland meandering rivers
Channel Form Channels and Challenges
O’Grady, 2006
Build Partnership
Create an ICM
Vision
Characterise the
Catchment
Undertake further
characterisation
Identify &
Evaluate Possible
Management
Strategies
Design an
Implementation
Programme
Implement the
River Basin
Management Plan
Measure Progress
and Make
Adjustments
Channel Forms you Expect to See
• High gradient streams with high transport capacity
• Fast turbulent flow
• Flat sheets of bedrock or large boulders and
cobbles
• May feature waterfalls and plunge pools
• Banks formed from bedrock or large boulders –
erosion resistant except from very high discharges
• Mosses, lichens, algae
Upper Reaches of the Catchment
Mid Catchment
• Moderate gradient channels
• Substrate of mostly pebble and gravels with
patches of sand
• Flow types made up of riffle sections
interspersed with pools and glides
• Bank stability dependent on erodibility of bank
material and vegetation cover
• Some macrophytes at channel margins
Build Partnership
Create an ICM
Vision
Characterise the
Catchment
Undertake further
characterisation
Identify &
Evaluate Possible
Management
Strategies
Design an
Implementation
Programme
Implement the
River Basin
Management Plan
Measure Progress
and Make
Adjustments
Channel Forms you Expect
to See
Lower Catchment
• Low to no gradient
• Smooth Flow
• Low velocities
• Fine Substrates
• Macrophytes
• Stable banks
• Mid channel islands
Channel Forms you Expect to See
Build Partnership
Create an ICM
Vision
Characterise the
Catchment
Undertake further
characterisation
Identify &
Evaluate Possible
Management
Strategies
Design an
Implementation
Programme
Implement the
River Basin
Management Plan
Measure Progress
and Make
Adjustments
Build Partnership
Create an ICM
Vision
Characterise the
Catchment
Undertake further
characterisation
Identify &
Evaluate Possible
Management
Strategies
Design an
Implementation
Programme
Implement the
River Basin
Management Plan
Measure Progress
and Make
Adjustments
Comparing Expectation with What you See on
the Ground
Expected conditions for an upper - mid
catchment river in West of Ireland
• Low BFIsoil index – mostly overland
flow, flashy response
• Stable banks
• Pebble and cobble substrate, some
large boulders
Build Partnership
Create an ICM
Vision
Characterise the
Catchment
Undertake further
characterisation
Identify &
Evaluate Possible
Management
Strategies
Design an
Implementation
Programme
Implement the
River Basin
Management Plan
Measure Progress
and Make
Adjustments
Comparing Expectation with What you See on the Ground
What is causing
this departure
from
expectations?
Unstable banks
- Excessive
Erosion
Excessive
fine sands
and silts
Build Partnership
Create an ICM
Vision
Characterise the
Catchment
Undertake further
characterisation
Identify &
Evaluate Possible
Management
Strategies
Design an
Implementation
Programme
Implement the
River Basin
Management Plan
Measure Progress
and Make
Adjustments
Comparing Expectation with What you See on the Ground
Expected conditions for a lowland
meandering river in the Midlands
• High BFIsoil index – high groundwater
contribution, slower response wide
hydrograph
• Connected to flood plain
• Low depth to width ratio
• Fine substrate
• Meanders with erosion on outside and
deposition on inside
• Mid channel islands
On Site:
• Channelised
• Straight uniform trapezoidal
channel
• Disconnected from flood plain
• High depth to width ratio
• Excessive sediment in channel
• Uniform flow
• Bare exposed banks
Comparing Expectation with What you See on the Ground
Build Partnership
Create an ICM
Vision
Characterise the
Catchment
Undertake further
characterisation
Identify &
Evaluate Possible
Management
Strategies
Design an
Implementation
Programme
Implement the
River Basin
Management Plan
Measure Progress
and Make
Adjustments
Recording Disturbance / Departure from Naturalness
• Channel form and flow types – is river on its natural course? Variety of depths and
water velocity where expected? Presence of natural features?
• Channel vegetation – vegetation in channel as expected – habitat and organic debris
• Substrate condition – depends on stream type and geology, heterogeneity of
substrate present, how embedded are coarse particles by fines, quality and
cleanliness, alterations.
WHAT PRESSURES ARE CAUSING THIS DEPARTURE FROM NATURALNESS?
Build Partnership
Create an ICM
Vision
Characterise the
Catchment
Undertake further
characterisation
Identify &
Evaluate Possible
Management
Strategies
Design an
Implementation
Programme
Implement the
River Basin
Management Plan
Measure Progress
and Make
Adjustments
Build Partnership
Create an ICM
Vision
Characterise the
Catchment
Undertake further
characterisation
Identify &
Evaluate Possible
Management
Strategies
Design an
Implementation
Programme
Implement the
River Basin
Management Plan
Measure Progress
and Make
Adjustments
Land Use (Indirect) Pressures
Source: Land Use
Activities e.g. Forestry
Grazing, peat cutting
Pathway: Overland
Flow – transfer of
excess sediment
load
Receptor: River –
excessive sediment
load impacting
ecology
Build Partnership
Create an ICM
Vision
Characterise the
Catchment
Undertake further
characterisation
Identify &
Evaluate Possible
Management
Strategies
Design an
Implementation
Programme
Implement the
River Basin
Management Plan
Measure Progress
and Make
Adjustments
Direct Pressures
Cattle poaching
Modified channel
Dam causing barrier
to upstream fish
migration
Build Partnership
Create an ICM
Vision
Characterise the
Catchment
Undertake further
characterisation
Identify &
Evaluate Possible
Management
Strategies
Design an
Implementation
Programme
Implement the
River Basin
Management Plan
Measure Progress
and Make
Adjustments
Direct pressures
Modified
Banks
Cattle poaching
Barriers to
Migration
Build Partnership
Create an ICM
Vision
Characterise the
Catchment
Undertake further
characterisation
Identify &
Evaluate Possible
Management
Strategies
Design an
Implementation
Programme
Implement the
River Basin
Management Plan
Measure Progress
and Make
Adjustments
Identifying Pressures by
looking at channel flow and
form can help to focus
fieldwork investigations and
identify the measures needed
to address the issues

8. Flow and Form

  • 1.
  • 2.
    River Flow andForm Build Partnership Create an ICM Vision Characterise the Catchment Undertake further characterisation Identify & Evaluate Possible Management Strategies Design an Implementation Programme Implement the River Basin Management Plan Measure Progress and Make Adjustments 1. What Can River Flow and Form Tell Us? 2. Flow – What Data is Available? 3. The Hydrograph 4. Base Flow Index 5. What Determines Hydrograph Shape? 6. Catchment Descriptors 7. Hydrograph Examples including the Nuenna 8. Channel Form – Expectation vs what you see on the Ground 9. Recording Disturbance / Departure from Naturalness 10.Land Use (Indirect) Pressures 11.Direct Pressures
  • 3.
    What can RiverFlow data tell us? • Use in combination with nutrient concentrations to calculate pollutant load • Establish flow duration curves and estimate low flows for assimilative capacity calculations • Flood flows have power to lift and transport high sediment loads Build Partnership Create an ICM Vision Characterise the Catchment Undertake further characterisation Identify & Evaluate Possible Management Strategies Design an Implementation Programme Implement the River Basin Management Plan Measure Progress and Make Adjustments
  • 4.
    What can RiverForm tell us? • Departure from reference condition • Indication of pressures – a river’s form is not what you expect to see for the type of channel and where it is in the overall catchment Build Partnership Create an ICM Vision Characterise the Catchment Undertake further characterisation Identify & Evaluate Possible Management Strategies Design an Implementation Programme Implement the River Basin Management Plan Measure Progress and Make Adjustments
  • 5.
    Build Partnership Create anICM Vision Characterise the Catchment Undertake further characterisation Identify & Evaluate Possible Management Strategies Design an Implementation Programme Implement the River Basin Management Plan Measure Progress and Make Adjustments Flow – what data is available? Hydrometric Data from Gauging Stations across Ireland – 216 with water level and flow data that has some degree of confidence at higher flows. • Water level is recorded • Spot gaugings taken to record water level and flow • Rating relationship developed
  • 6.
    Build Partnership Create anICM Vision Characterise the Catchment Undertake further characterisation Identify & Evaluate Possible Management Strategies Design an Implementation Programme Implement the River Basin Management Plan Measure Progress and Make Adjustments EPA maintain the Register of Hydrometric Stations in Ireland EPA Hydronet website http://hydronet.epa.ie • Download average flow data for Local Authority gauges • Request continuous water level and flow data and annual maximum series Flow – what data is available?
  • 7.
    Build Partnership Create anICM Vision Characterise the Catchment Undertake further characterisation Identify & Evaluate Possible Management Strategies Design an Implementation Programme Implement the River Basin Management Plan Measure Progress and Make Adjustments The Office of Public Works – approx 500 gauging stations with varying data quality – www.opw.ie/hydro • Download average flow and level data OPW gauges • Download annual maximum series • Continually updated by OPW Hydrometric Section Flow – what data is available?
  • 8.
    The Office ofPublic Works - FLOOD STUDIES UPDATE – WEB PORTAL opw.hydronet.com • Substantial update of the Flood Studies Report (NERC, 1975), that provided methodologies for flood estimation in Ireland and the United Kingdom. • Solely based on Irish Data. Key outputs for Catchment Management: • Review of hydrometric stations and creation of database of the 216 most reliable in terms of flow data at higher flows. • GIS based calculation of Physical Catchment Descriptors along every river in Ireland – these datasets are key Build Partnership Create an ICM Vision Characterise the Catchment Undertake further characterisation Identify & Evaluate Possible Management Strategies Design an Implementation Programme Implement the River Basin Management Plan Measure Progress and Make Adjustments Flow – what data is available?
  • 9.
    Build Partnership Create anICM Vision Characterise the Catchment Undertake further characterisation Identify & Evaluate Possible Management Strategies Design an Implementation Programme Implement the River Basin Management Plan Measure Progress and Make Adjustments Flow – what data is available? • Publicly available – launched November 2014 • Provides links to other hydrometric websites • Excellent source of spatial datasets on a national basis
  • 10.
    Build Partnership Create anICM Vision Characterise the Catchment Undertake further characterisation Identify & Evaluate Possible Management Strategies Design an Implementation Programme Implement the River Basin Management Plan Measure Progress and Make Adjustments Flow – what data is available? Hydrometric Stations (216 ) •Annual maximum data (high flows) •Continuous water level and flow series Spatial Layers useful for catchment management •Location of hydrometric stations •Ungauged catchment descriptors (133846 locations) •Gauged (216) and Ungauged catchment boundaries •Rivers •Lakes •Hydrometric areas •Cities and Towns •River Basin Districts •Townlands •Depth Duration Frequency grid points for rainfall All downloadable from the FSU WEB Portal
  • 11.
    Build Partnership Create anICM Vision Characterise the Catchment Undertake further characterisation Identify & Evaluate Possible Management Strategies Design an Implementation Programme Implement the River Basin Management Plan Measure Progress and Make Adjustments Flow – what data is available? www.waterlevel.ie
  • 12.
    Build Partnership Create anICM Vision Characterise the Catchment Undertake further characterisation Identify & Evaluate Possible Management Strategies Design an Implementation Programme Implement the River Basin Management Plan Measure Progress and Make Adjustments The Hydrograph • Hydrograph is the sum of all water discharging to the river • Pathways to the river: 1. Overland Flow: Surface runoff & flows in land drains 2. Interflow: seepage through soils and subsoils 3. Shallow Groundwater Flow: through weathered rock 4. Deep Groundwater Flow: Groundwater flow beneath the water table that interacts with the surface water system 5. Discrete Fault or Conduit Flow • Base Flow Index (BFI) = (Qi+Qg) / Q (0 to 1) (Deakin 2012) BFI is a good indicator of hydrological response
  • 13.
    Build Partnership Create anICM Vision Characterise the Catchment Undertake further characterisation Identify & Evaluate Possible Management Strategies Design an Implementation Programme Implement the River Basin Management Plan Measure Progress and Make Adjustments Base Flow Index • The FSU WEB Portal can provide estimated BFI data for all ungauged catchments • Estimated using combination of nearby gauge data and soil / aquifer data • BFIsoil index is a useful summary of the hydrological behaviour of rivers at a catchment scale (FSU WP 5.2) • Ratio between 0 and 1 • Lower values indicate greater contribution from overland flow i.e. Quicker response, higher potential for sediment transfer
  • 14.
    0 0.5 1 1.5 2 2.5 3 3.5 4 4.5 5 02/11 /2009 04/11 /200906/11 /2009 08/11 /2009 10/11 /200912/11 /2009 14/11 /200916/11 /2009 18/11 /2009 20/11 /200922/11 /2009 24/11 /2009 26/11 /200928/11 /2009 30/11 /2009 02/12 /200904/12 /2009 06/12 /2009 08/12 /200910/12 /2009 12/12 /2009 14/12 /200916/12 /2009 25017 26007 What determines hydrographshape? Meteorological Characteristics– the driver Generally precipitation dominates the Rising Limb Catchment descriptors control the response Recession Limb is determined by catchment characteristics Baseflow Gauging Station No.
  • 15.
    Catchment Descriptors • Shapeof the drainage basin (catchment) • Drainage density • Slope Influences the time taken for water from the remote parts of the catchment to arrive at the outlet Area C1 Area C2 Area C1 Area C2
  • 16.
    Catchment Descriptors • Geology(permeable/impermeable) • Soil type (permeable, deep, shallow etc) • Landuse (urban, forest, agriculture) • Presence of bogs, turloughs, lakes and reservoirs • Artificial drainage schemes Control surface water runoff, shape of recession limb Part of BFIsoil
  • 17.
    Channel and floodplaincharacteristics - cross-section shape - channel roughness - online reservoirs - floodplain storage Control conveyance (in-channel flow)
  • 18.
    Assume that onlyone factor changes Amount of storm rainfall increases Duration of storm increases Storm changes from complete coverage of the catchment to only partial coverage Rate of snowmelt increases Catchment size increases Catchment slope changes from steep to flat Landuse changes from rural to urban Catchment is wet prior to the storm Fields ploughed along the contours are ploughed across the contours Geology changes from clay to limestone Flood peak Increases Decreases Decreases Increases Increases Decreases Increases Increases Increases Decreases
  • 19.
    Build Partnership Create anICM Vision Characterise the Catchment Undertake further characterisation Identify & Evaluate Possible Management Strategies Design an Implementation Programme Implement the River Basin Management Plan Measure Progress and Make Adjustments Flow(cumecs) Time Catchment 'X' - Reduced Vegetation Catchment 'X' Reduction in Time to Peak Higher Peak Flow Example: Overgrazing
  • 20.
    Build Partnership Create anICM Vision Characterise the Catchment Undertake further characterisation Identify & Evaluate Possible Management Strategies Design an Implementation Programme Implement the River Basin Management Plan Measure Progress and Make Adjustments Catchment Y Attenuation Catchment Y No Attenuation Lower Peak Flow Longer recession limb Example: Flow attenuation
  • 21.
    Build Partnership Create anICM Vision Characterise the Catchment Undertake further characterisation Identify & Evaluate Possible Management Strategies Design an Implementation Programme Implement the River Basin Management Plan Measure Progress and Make Adjustments Nuenna Catchment AREA: 92 km2 SAAR: 859 mm URBAN EXTENT: 0.2% DRAINAGE DENSITY: 0.83 km/km2 SLOPE: 13.2m/km FARL: 1 BFIsoil: 0.57 Use FSU WEB Portal to get catchment descriptors and estimate: • Index Flow (Annual maximum - 15 m3/s) • Flood Frequencies • Hydrograph Shape This can be done at any of the 100 nodes points shown in the catchment
  • 22.
    Nuenna Catchment Build Partnership Createan ICM Vision Characterise the Catchment Undertake further characterisation Identify & Evaluate Possible Management Strategies Design an Implementation Programme Implement the River Basin Management Plan Measure Progress and Make Adjustments 0.00 2.00 4.00 6.00 8.00 10.00 12.00 14.00 16.00 0.00 5.00 10.00 15.00 20.00 25.00 30.00 Flow(cumecs) Time (Hours) Flow (m3/s) – 2 year return period
  • 23.
    Build Partnership Characterise Watershed Set Goalsand Identify Solutions Design Implementation Program Implement Program Make Progress Make Adjustments Improve Plan•Largely dictated by topography •Ireland has a relatively flat landscape surrounded by coastal hills. •Channels vary from steep fast flowing upland narrow streams to wide, shallow and sluggish lowland meandering rivers Channel Form Channels and Challenges O’Grady, 2006
  • 24.
    Build Partnership Create anICM Vision Characterise the Catchment Undertake further characterisation Identify & Evaluate Possible Management Strategies Design an Implementation Programme Implement the River Basin Management Plan Measure Progress and Make Adjustments Channel Forms you Expect to See • High gradient streams with high transport capacity • Fast turbulent flow • Flat sheets of bedrock or large boulders and cobbles • May feature waterfalls and plunge pools • Banks formed from bedrock or large boulders – erosion resistant except from very high discharges • Mosses, lichens, algae Upper Reaches of the Catchment
  • 25.
    Mid Catchment • Moderategradient channels • Substrate of mostly pebble and gravels with patches of sand • Flow types made up of riffle sections interspersed with pools and glides • Bank stability dependent on erodibility of bank material and vegetation cover • Some macrophytes at channel margins Build Partnership Create an ICM Vision Characterise the Catchment Undertake further characterisation Identify & Evaluate Possible Management Strategies Design an Implementation Programme Implement the River Basin Management Plan Measure Progress and Make Adjustments Channel Forms you Expect to See
  • 26.
    Lower Catchment • Lowto no gradient • Smooth Flow • Low velocities • Fine Substrates • Macrophytes • Stable banks • Mid channel islands Channel Forms you Expect to See Build Partnership Create an ICM Vision Characterise the Catchment Undertake further characterisation Identify & Evaluate Possible Management Strategies Design an Implementation Programme Implement the River Basin Management Plan Measure Progress and Make Adjustments
  • 27.
    Build Partnership Create anICM Vision Characterise the Catchment Undertake further characterisation Identify & Evaluate Possible Management Strategies Design an Implementation Programme Implement the River Basin Management Plan Measure Progress and Make Adjustments Comparing Expectation with What you See on the Ground Expected conditions for an upper - mid catchment river in West of Ireland • Low BFIsoil index – mostly overland flow, flashy response • Stable banks • Pebble and cobble substrate, some large boulders
  • 28.
    Build Partnership Create anICM Vision Characterise the Catchment Undertake further characterisation Identify & Evaluate Possible Management Strategies Design an Implementation Programme Implement the River Basin Management Plan Measure Progress and Make Adjustments Comparing Expectation with What you See on the Ground What is causing this departure from expectations? Unstable banks - Excessive Erosion Excessive fine sands and silts
  • 29.
    Build Partnership Create anICM Vision Characterise the Catchment Undertake further characterisation Identify & Evaluate Possible Management Strategies Design an Implementation Programme Implement the River Basin Management Plan Measure Progress and Make Adjustments Comparing Expectation with What you See on the Ground Expected conditions for a lowland meandering river in the Midlands • High BFIsoil index – high groundwater contribution, slower response wide hydrograph • Connected to flood plain • Low depth to width ratio • Fine substrate • Meanders with erosion on outside and deposition on inside • Mid channel islands
  • 30.
    On Site: • Channelised •Straight uniform trapezoidal channel • Disconnected from flood plain • High depth to width ratio • Excessive sediment in channel • Uniform flow • Bare exposed banks Comparing Expectation with What you See on the Ground Build Partnership Create an ICM Vision Characterise the Catchment Undertake further characterisation Identify & Evaluate Possible Management Strategies Design an Implementation Programme Implement the River Basin Management Plan Measure Progress and Make Adjustments
  • 31.
    Recording Disturbance /Departure from Naturalness • Channel form and flow types – is river on its natural course? Variety of depths and water velocity where expected? Presence of natural features? • Channel vegetation – vegetation in channel as expected – habitat and organic debris • Substrate condition – depends on stream type and geology, heterogeneity of substrate present, how embedded are coarse particles by fines, quality and cleanliness, alterations. WHAT PRESSURES ARE CAUSING THIS DEPARTURE FROM NATURALNESS? Build Partnership Create an ICM Vision Characterise the Catchment Undertake further characterisation Identify & Evaluate Possible Management Strategies Design an Implementation Programme Implement the River Basin Management Plan Measure Progress and Make Adjustments
  • 32.
    Build Partnership Create anICM Vision Characterise the Catchment Undertake further characterisation Identify & Evaluate Possible Management Strategies Design an Implementation Programme Implement the River Basin Management Plan Measure Progress and Make Adjustments Land Use (Indirect) Pressures Source: Land Use Activities e.g. Forestry Grazing, peat cutting Pathway: Overland Flow – transfer of excess sediment load Receptor: River – excessive sediment load impacting ecology
  • 33.
    Build Partnership Create anICM Vision Characterise the Catchment Undertake further characterisation Identify & Evaluate Possible Management Strategies Design an Implementation Programme Implement the River Basin Management Plan Measure Progress and Make Adjustments Direct Pressures Cattle poaching Modified channel Dam causing barrier to upstream fish migration
  • 34.
    Build Partnership Create anICM Vision Characterise the Catchment Undertake further characterisation Identify & Evaluate Possible Management Strategies Design an Implementation Programme Implement the River Basin Management Plan Measure Progress and Make Adjustments Direct pressures Modified Banks Cattle poaching Barriers to Migration
  • 35.
    Build Partnership Create anICM Vision Characterise the Catchment Undertake further characterisation Identify & Evaluate Possible Management Strategies Design an Implementation Programme Implement the River Basin Management Plan Measure Progress and Make Adjustments Identifying Pressures by looking at channel flow and form can help to focus fieldwork investigations and identify the measures needed to address the issues