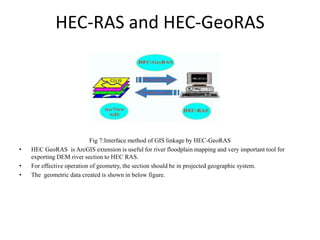
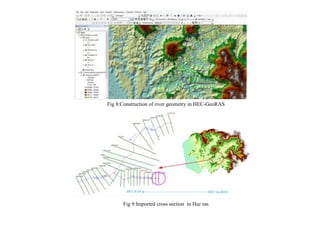
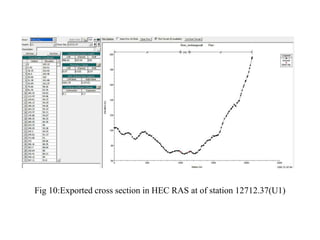
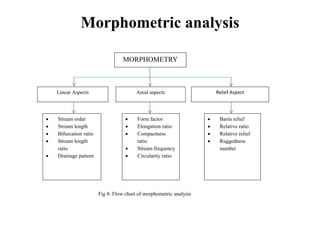
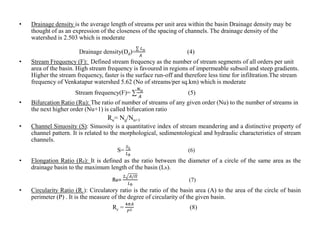
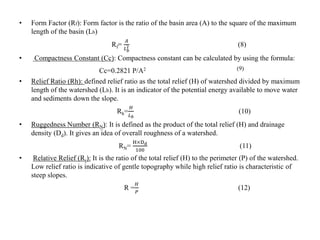
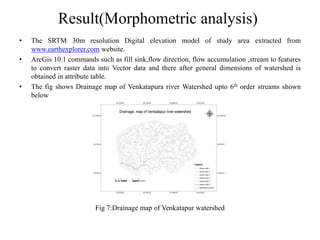
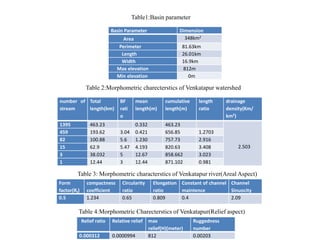
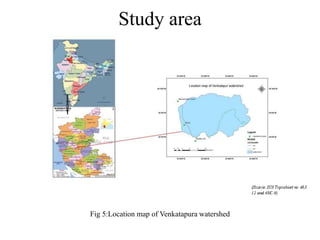
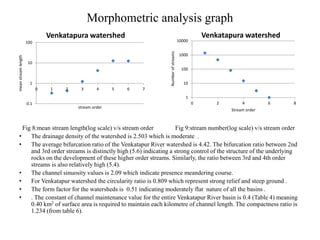
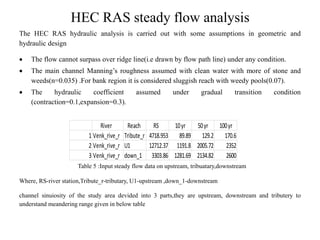
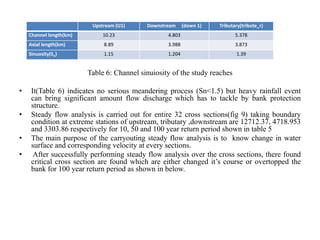
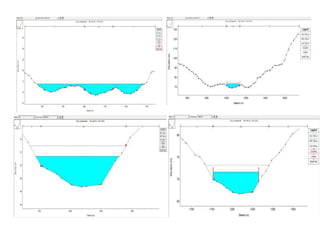
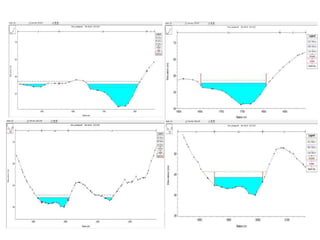
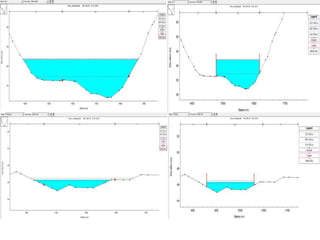
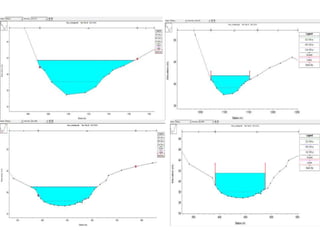
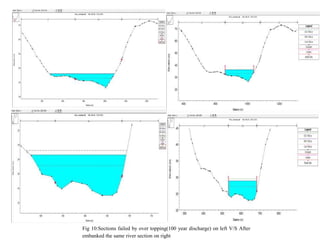
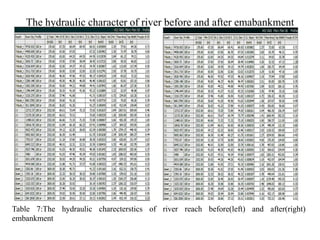
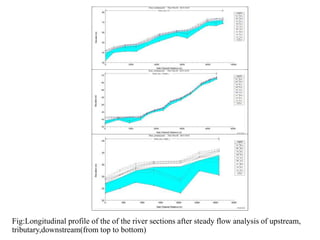
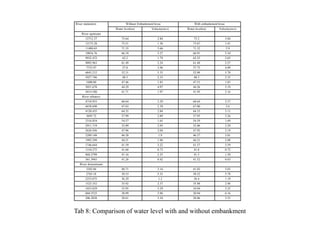
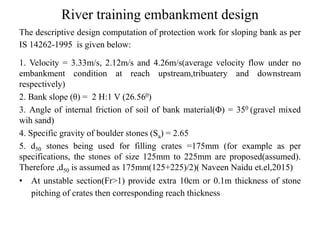
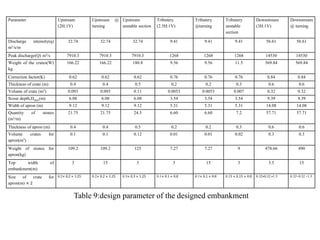
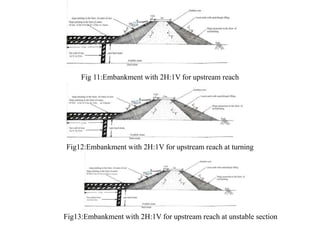
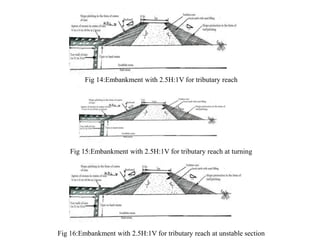
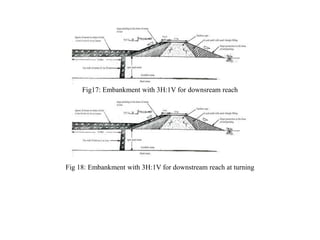
The document summarizes the objectives, methodology, and results of a study analyzing the morphometric characteristics and river training needs of the Venkatapura river watershed in India. The objectives were to understand the river's behavior, protect surrounding areas from flooding, and minimize bank erosion. Tools like ArcGIS and HEC-RAS were used to analyze watershed parameters, model steady flows, and identify critical cross-sections. Key findings included a drainage density and bifurcation ratio indicating a moderate watershed, sinuosity suggesting some meandering, and critical sections found to change course or overtop banks during 100-year flows. Preventive bank protection structures were recommended.
The document discusses different types of canals including contour canals, ridge canals, and side slope canals. It describes how canals are classified based on alignment and position. The key parts of a canal system are described including main canals, branch canals, distributaries, and water courses. Methods for fixing canal alignment and designing canal cross-sections are outlined. Different types of canal lining materials and their purposes are also summarized.
Okay, let me solve this step-by-step:
Given:
Discharge of canal (Q) = 50 cumec
Let's assume:
Bed width (B) = x meters
Depth of water (D) = y meters
Cross-sectional area (A) = B*D + 1.5D^2
Wetted perimeter (P) = B + 3.6D
Hydraulic mean depth (R) = A/P
From the economical section condition:
R = D/2
Equating the two expressions of R and solving:
(B*D + 1.5D^2) / (B + 3
This document discusses reservoir planning and design. It describes how reservoirs are created by constructing dams across rivers. Investigations including engineering surveys, geological studies, and hydrological analyses are conducted. Reservoirs have different levels like full reservoir level and minimum drawdown level. Storage zones include live, dead, and flood storage. Methods to determine reservoir capacity and yield using mass inflow and demand curves are presented. Factors affecting reservoir sedimentation and management techniques are outlined. Flow routing methods like graphical and trial and error are described to model flood waves passing through reservoirs. Spillway types including free overfall are also summarized.
The document provides information on diversion head works and their components. It can be summarized as:
1) Diversion head works are structures constructed at the head of a canal to divert river water into the canal and ensure a regulated supply of silt-free water with a minimum head.
2) Key components of diversion head works include under sluices, divide walls, fish ladders, silt exclusion devices, guide banks, and head regulators. Under sluices control silt entry and water levels. Divide walls separate flows. Fish ladders allow fish passage.
3) Site selection factors for diversion head works include suitable foundations, positioning the weir at a right angle to river flow, space for
River training structures are used to guide and direct river flow, regulate the river bed, and increase water depth. The objectives are to provide safe passage for floods, prevent river bank erosion, improve channel alignment, and efficiently transport sediment. Common structures include embankments, guide banks, groynes, cutoffs, pitched islands, and bandalling. Groynes can be impermeable or permeable, classified based on their height, functions like attracting or repelling flow, and some have special designs like T-heads or hockey shapes.
The document discusses various methods for river training including constructing levees, guide banks, and spurs. Levees are embankments running parallel to rivers that are used to contain flood waters and protect areas from flooding. Guide banks are structures built to confine river flow within a reasonable waterway when constructing bridges or other works. Spurs are embankment structures built transverse to river flow to deflect currents away from banks and prevent erosion. The appropriate river training method depends on the river type, regime, and flow characteristics.
Cross section of the canal, balancing depth and canal fslAditya Mistry
1) The document discusses the cross section of irrigation canals, including configurations for cutting, filling, and partial cutting/filling. It describes the main components of a canal cross section such as side slopes, berms, and banks.
2) Balancing depth is defined as the depth of cutting where the quantity of excavated earth equals the amount required to form the canal banks, resulting in the most economical cross section.
3) Canal FSL (Full Supply Level) refers to the normal maximum operating water level of a canal when not affected by floods, corresponding to 100% capacity.
Canals are human-made waterways that allow boats and ships to pass between bodies of water. They are also used to transport water for irrigation and other human uses. Canals are classified in several ways, including whether the water source is permanent or temporary, the type of soil boundary, the financial purpose, water discharge volume, and canal alignment. The various types of canals include permanent canals, inundation canals, irrigation canals, power canals, and side-slope canals.
Reservoir sedimentation & its controlZahinRana
This document discusses reservoir sedimentation and its control. It begins with an introduction that defines a reservoir as an enlarged natural or artificial lake or pond created by a dam to store water. It then explains that reservoirs experience sedimentation as rivers carry sediment from erosion that is deposited in the reservoir, reducing its storage capacity over time. The document outlines the types of sediment as suspended or bed load. It lists the causes of sedimentation as the nature of catchment soils, vegetation cover, topography, rainfall intensity and land cultivation. Finally, it discusses methods to control sedimentation such as proper design, sediment control structures, and sediment removal.
Energy dissipaters are needed when water is released over a spillway to prevent scouring downstream. Various devices can be used, including baffle walls, deflectors, and staggered blocks, which reduce kinetic energy by converting it to turbulence and heat. Hydraulic jumps also dissipate energy by maintaining a high water level downstream. The type of dissipater used depends on the tailwater rating curve in relation to the jump height curve and the flow conditions. Stilling basins, sloping aprons, and roller buckets are suitable for different tailwater classifications.
The document discusses methods for flood control, including controlling water levels through dams and check dams, building barriers like levees and flood walls, altering river channels by straightening or widening them, controlling land use around rivers, and using floodways. It provides details on reservoirs, levees, and floodways as specific flood control techniques. Levees are described as earthen embankments built between rivers and protected areas to restrict flood water flow, with considerations for their height and freeboard. The Mississippi River levee system is highlighted as one of the largest in the world.
This document provides an overview of reservoir planning and surveys. It discusses the different types of reservoirs and surveys conducted in reservoir planning, including reconnaissance, preliminary, and detailed surveys. Key steps in reservoir planning include engineering, hydrological, and geological surveys to identify suitable dam sites and storage capacity. Control levels like top bund level, high flood level, and full tank level are also discussed. Factors affecting silting and methods to control silting are outlined. The document provides details on various stages of reservoir planning and development.
This document provides an overview of different seepage theories used in the design of hydraulic structures. It discusses three main theories: 1) Bligh's creep theory, which assumes seepage follows the base contour of the structure; 2) Lane's weighted creep theory, which applies a weighting factor to horizontal seepage; and 3) Khosla's theory, which models seepage using streamlines and flow nets derived from the Laplace equation. The document explains how each theory can be used to calculate hydraulic gradients, uplift pressures, and ensure safety against piping and structural failure. Examples are provided to demonstrate applying the theories to calculate uplift pressures and required floor thickness at different points.
This document discusses various types of canal regulation works including canal falls, escapes, regulators, and outlets. It describes the necessity and types of canal falls, which are constructed when the natural ground slope is steeper than the designed canal bed slope. The types of falls discussed include ogee falls, stepped falls, vertical falls, rapid falls, straight glacis falls, trapezoidal notch falls, well or cylinder notch falls, Montague type falls, and Inglis or baffle falls. The document also discusses canal escapes, head regulators, cross regulators, silt control devices, and canal outlets/modules. In particular, it explains the functions and construction of head regulators and cross regulators.
The document summarizes key components of dam safety, including structural safety criteria, monitoring and maintenance programs, emergency planning, instrumentation, and common maintenance items. It describes dam components, safety criteria, surveillance systems, monitoring parameters, and instrumentation used to monitor dams, such as piezometers, surface monuments, inclinometers, and accelerographs.
The document summarizes concepts related to gradually varied flow in open channels. It discusses:
1. The assumptions and equations used in gradually varied flow analysis, including the energy equation.
2. The different types of water surface profiles that can occur depending on factors like bed slope, including mild slope, steep slope, critical slope, horizontal slope, and adverse slope profiles.
3. Methods for computing gradually varied flow profiles, including graphical integration, direct step method for prismatic channels, and standard step method for natural channels.
This document discusses canal irrigation and diversion head works. It begins by defining a canal as an artificial channel constructed to carry water from a river, tank, or reservoir to fields. Canals are classified based on their source of supply, financial output, function, and boundary surface. Unlined canals are designed using either Kennedy's Theory from 1895 or Lacey's Theory from 1939. Kennedy's Theory is based on experiments observing eddy formation and silt suspension. Lacey's Theory considers drawbacks of Kennedy's Theory and designs for regime conditions. Both theories use empirical formulae and have limitations in achieving true regime conditions and defining characteristics precisely.
Topics:
1. Types of Gravity Dam
2. Forces Acting on a Gravity Dam
3. Causes of failure of Gravity Dam
4. Elementary Profile of Gravity Dam
5. Practical Profile of Gravity Dam
6. Limiting height of Gravity Dam
7. Drainage and Inspection Galleries
The presentation has prepared as per the syllabus of Mumbai University.
Go through the presentation, if you like it then share it with your friends and classmates.
Thank you :)
Earthen dams are constructed using natural materials like clay, sand, gravel and rock. They are designed based on principles of soil mechanics. There are two main types - homogeneous and zoned. Zoned dams have an impervious core and outer shells. Components include the core, shells, rock toe, pitching, berms and drains. Stability requires the seepage line be within the downstream slope with minimum 2m cover. Common causes of failure are hydraulic (overtopping, erosion), seepage (piping through core or foundations) and structural issues like cracking. Proper design and construction can prevent these failures.
energy dissipator in hydraulic structure Kiran Jadhav
This document discusses energy dissipators, which are structures that reduce the kinetic energy of water flowing over spillways to prevent erosion. It describes two main types of energy dissipators - stilling basins and bucket dissipators. Stilling basins use either horizontal or sloping concrete aprons and hydraulic jumps to dissipate energy. Bucket dissipators include solid roller, slotted roller, and ski jump designs. The document explains how dissipator selection depends on the relationship between tailwater curve and flow depth. Appropriate dissipators maintain stable hydraulic jumps or direct flow into the air to safely dissipate kinetic energy for different tailwater conditions.
Spillway crest gates are adjustable gates used to control water flow in reservoir and river systems. They act as barriers to store additional water, allowing the height of dams to be increased and requiring more land acquisition. The main types of spillway gates are dripping shutters, stop logs, radial/tainter gates, drum gates, and vertical lift/rectangle gates. Vertical lift gates are rectangular gates that spin horizontally between grooved piers and can be raised or lowered by a hoisting mechanism to control water flow.
Khosla's theory improved upon Bligh's theory of seepage under hydraulic structures in several ways. Khosla recognized that seepage follows elliptical streamlines rather than the bottom contour as Bligh assumed. Khosla also introduced the important concept of exit gradient and specified that the exit gradient must be less than the critical value to prevent soil particles from being dislodged. While more complex, Khosla's theory provides a more accurate representation of seepage flow compared to Bligh's assumption of linear head loss.
Types- selection of the suitable site for the diversion headwork components
of diversion headwork- Causes of failure of structure on pervious foundation- Khosla’s theory- Design of concrete sloping
glacis weir.
This document provides guidelines for designing irrigation channels, including:
1. Typical canal cross-sections, side slopes, berms, freeboard, banks, and other design elements are described.
2. Methods for calculating balancing depth to minimize earthworks and borrow pits are outlined.
3. The design procedure is demonstrated through an example that involves plotting longitudinal sections, calculating discharges and losses, and using Garret's diagram to determine channel dimensions.
This document discusses basin morphometry, which involves quantitatively measuring the shape and geometry of drainage basins. It describes various linear, aerial, and relief properties that are measured, such as stream order, length, and number, drainage density, basin area and relief. These morphometric properties provide insights into surface processes, tectonic activity, and hydrological characteristics like flooding and sediment yield. Quantifying basin morphology allows comparisons between basins and improved modeling of terrain and hydrological systems.
This document discusses basin morphometry, which involves quantitatively measuring the shape and geometry of drainage basins. It describes various linear, aerial, and relief properties that are measured, such as stream order, length, and number, drainage density, basin area and relief. These morphometric properties provide insights into surface processes, basin evolution, and characteristics like flood risk and sediment yield. They can also indicate tectonic activity and help improve models for predicting stream discharge and other hydrological factors.
This document discusses various characteristics of catchments that affect surface runoff, including:
1. The area, shape, slope, and drainage patterns of a catchment determine the volume and timing of surface runoff from storms.
2. Important geometric parameters that represent catchment characteristics are the stream order, stream density, drainage density, relief, slope, length, shape, and hypsometric curve.
3. Drainage density indicates the level of drainage development and influences how quickly runoff moves from the catchment, with higher densities associated with steeper slopes and less permeable soils.
This document discusses surface runoff and stream gauging. It defines key terms like drainage basin, contour lines, stream ordering, and form factor. It describes how to delineate a basin using a topo map and assign stream orders. Factors that affect runoff include basin characteristics, climate, land use, soil and storage. Stream gauging involves measuring stage using staff gauges or recorders, and discharge using the velocity-area method by dividing the cross-section into vertical subsections.
Features:
View watershed boundary and drainage network, and contour map layers
Find area of a selected watershed
View ground profile along and across the stream path
View existing water conservation structures along with photo
Manage watershed structures
Add Water Conservation Structure
Change Status of Structure (Proposed, Under Progress, Completed)
Technology
Google Maps API
Google Elevation API
Google Fusion Tables (for polyline and polygon data)
ASP.NET, SQL Server 2008 (for point data)
This document outlines the course content for a River Engineering course. It covers 5 main topics: 1) Introduction to River Engineering which discusses catchment areas, river classifications, and morphology; 2) River Hydraulics; 3) Sediment Transport; 4) River Training and Flood Control; and 5) Preliminary Design of Bridges. The objectives are for students to understand river behavior and morphology, sediment transport, river training structures, and bridge hydraulics. Evaluation includes assignments, exams, and presentations. References for further reading are also provided.
This document discusses a study that used hypsometric analysis to understand the geomorphic development of sub-watersheds within the Chalakudy River basin in South India. Hypsometric integral values ranging from 44-62% were calculated for the five sub-watersheds using a 30m DEM. These values indicate the sub-watersheds are in a youthful to mature stage of erosion. Drainage density and other morphometric parameters were also analyzed and found to be consistent with the hypsometric integral values. The document examines how lithological characteristics influence erosion rates in the different sub-basins.
1) Basin morphometry involves the mathematical analysis of the shape and form of drainage basins. It examines various linear, aerial, and relief properties.
2) Linear properties include stream order, length, bifurcation ratio, and length ratio which provide information on drainage patterns.
3) Aerial properties like drainage density and frequency relate to the spacing and number of stream channels over the basin area.
4) Relief properties measure elevation differences within the basin, such as relief ratio, which compares total relief to basin length.
This document discusses various parameters for measuring stream morphology and hydrology, including sinuosity, meander wavelength, meander belt width, and radius of curvature. It also describes methods for measuring stream discharge using the area-velocity method, which involves dividing the cross-sectional area into increments and measuring the depth, width, and average velocity in each increment.
The document discusses morphometric analysis of drainage basins. It describes how drainage basins can be analyzed based on their linear, aerial, and relief aspects. Linear aspects include stream order, length, and bifurcation ratio. Aerial aspects include basin area, shape, and drainage density. Relief aspects examine the relationship between area, altitude, and slope. Morphometric analysis of drainage basin parameters provides insight into the physical characteristics and evolution of the landforms.
This document discusses watersheds and concepts related to watershed hydrology. It begins by defining a watershed as a drainage area that contributes runoff to an outlet point. It then discusses key characteristics of watersheds including size, shape, slope, soils and land use. The document also covers watershed delineation, functions of watersheds, types of watersheds, and hydrologic analysis parameters such as outfall and watershed boundary. Finally, it discusses runoff estimation methods including the Rational Method and provides examples of applying the Rational Method to calculate peak runoff rates.
Evaluation of morphometric parameters derived from Cartosat-1 DEM using remot...Dr Ramesh Dikpal
The quantitative analysis of drainage system is
an important aspect of characterization of watersheds.
Using watershed as a basin unit in morphometric analysis
is the most logical choice because all hydrological and
geomorphic processes occur within the watershed. The
Budigere Amanikere watershed a tributary of Dakshina
Pinakini River has been selected for case illustration.
Geoinformatics module consisting of ArcGIS 10.3v and
Cartosat-1 Digital Elevation Model (DEM) version 1 of
resolution 1 arc Sec (*32 m) data obtained from Bhuvan
is effectively used. Sheet and gully erosion are identified in
parts of the study area. Slope in the watershed indicating
moderate to least runoff and negligible soil loss condition.
Third and fourth-order sub-watershed analysis is carried
out. Mean bifurcation ratio (Rb) 3.6 specify there is no
dominant influence of geology and structures, low drainage
density (Dd) 1.12 and low stream frequency (Fs) 1.17
implies highly infiltration subsoil material and low runoff,
infiltration number (If)1.3 implies higher infiltration
capacity, coarse drainage texture (T) 3.40 shows high
permeable subsoil, length of overland flow (Lg) 0.45
indicates under very less structural disturbances, less runoff
conditions, constant of channel maintenance (C) 0.9 indicates
higher permeability of subsoil, elongation ratio (Re)
0.58, circularity ratio (Rc) 0.75 and form factor (Rf) 0.26
signifies sub-circular to more elongated basin with high
infiltration with low runoff. It was observed from the
hypsometric curves and hypsometric integral values of the
watershed along with their sub basins that the drainage
system is attaining a mature stage of geomorphic development.
Additionally, Hypsometric curve and hypsometric
integral value proves that the infiltration capacity is high as
well as runoff is low in the watershed. Thus, these mormometric
analyses can be used as an estimator of erosion
status of watersheds leading to prioritization for taking up
soil and water conservation measures.
The document discusses modeling of seawater intrusion in coastal aquifers. It provides background on seawater intrusion as a natural process driven by density differences between fresh and saltwater. It describes various numerical models that can be used to simulate variable density groundwater flow and solute transport, including SEAWAT, SUTRA and MODFLOW. As an example application, it summarizes a study that used SUTRA to model seawater intrusion and the influence of tides on the fresh water resources of Nauru Island. The study found tidal forcing significantly reduced the size of the freshwater lens.
High intensity rain and morphometri in Padang city cause at Arau. Morphometri
geomorphologi that is related to wide of, river network, stream pattern and gradien of river. The form wide
of DAS will be by stream pattern and level.This will influence to the number of rain. Make an index to
closeness of stream depict closeness of river stream at one particular DAS. Speed of river stream influenced
by storey, level steepness of river. Steepness storey, level is comparison of difference height of river
downstream and upstream. Ever greater of steepness of river stream, excelsior speed of river stream that
way on the contrary. High to lower speed of river stream influence occurence of floods, more than anything
else if when influenced by debit big. By using rainfall from year 2005 to year 2015, and use Thiessen method
got a rainfall. Use the DEM IFSAR, analysed sofware ARGIS, and with from earth map, the result got DAS
in at condition of floods gristle and sedimentation. There are band evakuasi for resident which data in
floods area.
Morphometric analysis is the quantitative analysis of various characteristics of drainage basins based on parameters such as length, area, and relief. It involves categorizing parameters into linear, areal, and relief aspects to understand the geological structure, geomorphology, and hydrology of a basin. Common morphometric parameters studied include stream order, bifurcation ratio, stream number, length ratio, drainage density, texture ratio, and relief-related indices. Analyzing these parameters helps in watershed management and identifying groundwater potential and flood risks. While morphometric analysis provides quantitative insights, over-quantification without original thoughts and difficulties in precise measurements must be kept in mind.
The ICAR Indian Institute of Water Management was established in 1988 and aims to develop improved water management technologies through research. It conducts research through five programs: rainwater management, canal water management, groundwater management, waterlogged area management, and on-farm research and technology transfer.
The document then discusses the design of creek irrigation systems. It defines tidal creeks and explains how salinity varies in creeks over tidal cycles. It also discusses factors that influence salinity changes like urbanization. The document outlines the process for designing creek irrigation systems which includes determining design discharge, selecting a cross-sectional shape based on soil type and erosion control needs, using Manning's formula to calculate dimensions, and adding freeboard
Suspended Sediment Rating Curve for Tigris River Upstream Al- Betera RegulatorIJRES Journal
This document presents a study that establishes suspended sediment rating curves for a section of the Tigris River located upstream of the Al-Betera regulator in Maysan province, Iraq. Thirty-five data points measuring river discharge and calculated suspended sediment concentration using an ADCP were collected. A power function relationship between discharge and suspended sediment concentration was determined, with high correlation. The rating curves can be used to estimate suspended sediment loads transported in the river reach and improved with additional data.
The document discusses flow characteristics over broad crested weirs and stepped weirs. It begins with definitions of broad crested weirs and their advantages. Previous studies on broad crested weirs are summarized that examined factors like rounded edges, discharge coefficients, and separation zones. The document then describes a physical model experiment conducted in a laboratory flume to study a broad crested weir and stepped weir. Numerical modeling using FLUENT software is also discussed to simulate flow over the weirs using the volume of fluid method. The objectives are to examine laboratory data and 2D numerical modeling results to compare free surface profiles.
This document contains lecture notes on open channel hydraulics. It discusses various topics including classifications of open channel flow, basic principles of hydraulics applied to open channels, flow computation formulas, gradually and rapidly varied flow, unsteady flow, sediment transport, and channel geometry. The objectives of the course are to present principles of hydraulics and apply them to problems in civil, hydraulic, and irrigation engineering. After completing the course, students should understand how to apply hydraulic principles and be able to perform uniform and non-uniform, steady and unsteady flow computations in engineering problems.
Flow over a rectangular side weir under subcritical conditionsIJARIIT
A side weir is set into the side of the main channel it is an overflow weir have been extensively used in hydraulic and
environmental engineering application. They typically are used for water level control in canal system, diverting excess water
into relief channels during floods. An example of a situation of spatially varied flow is the flow over a side weir.
Batteries -Introduction – Types of Batteries – discharging and charging of battery - characteristics of battery –battery rating- various tests on battery- – Primary battery: silver button cell- Secondary battery :Ni-Cd battery-modern battery: lithium ion battery-maintenance of batteries-choices of batteries for electric vehicle applications.
Fuel Cells: Introduction- importance and classification of fuel cells - description, principle, components, applications of fuel cells: H2-O2 fuel cell, alkaline fuel cell, molten carbonate fuel cell and direct methanol fuel cells.
artificial intelligence and data science contents.pptxGauravCar
What is artificial intelligence? Artificial intelligence is the ability of a computer or computer-controlled robot to perform tasks that are commonly associated with the intellectual processes characteristic of humans, such as the ability to reason.
› ...
Artificial intelligence (AI) | Definitio
Discover the latest insights on Data Driven Maintenance with our comprehensive webinar presentation. Learn about traditional maintenance challenges, the right approach to utilizing data, and the benefits of adopting a Data Driven Maintenance strategy. Explore real-world examples, industry best practices, and innovative solutions like FMECA and the D3M model. This presentation, led by expert Jules Oudmans, is essential for asset owners looking to optimize their maintenance processes and leverage digital technologies for improved efficiency and performance. Download now to stay ahead in the evolving maintenance landscape.
Use PyCharm for remote debugging of WSL on a Windo cf5c162d672e4e58b4dde5d797...shadow0702a
This document serves as a comprehensive step-by-step guide on how to effectively use PyCharm for remote debugging of the Windows Subsystem for Linux (WSL) on a local Windows machine. It meticulously outlines several critical steps in the process, starting with the crucial task of enabling permissions, followed by the installation and configuration of WSL.
The guide then proceeds to explain how to set up the SSH service within the WSL environment, an integral part of the process. Alongside this, it also provides detailed instructions on how to modify the inbound rules of the Windows firewall to facilitate the process, ensuring that there are no connectivity issues that could potentially hinder the debugging process.
The document further emphasizes on the importance of checking the connection between the Windows and WSL environments, providing instructions on how to ensure that the connection is optimal and ready for remote debugging.
It also offers an in-depth guide on how to configure the WSL interpreter and files within the PyCharm environment. This is essential for ensuring that the debugging process is set up correctly and that the program can be run effectively within the WSL terminal.
Additionally, the document provides guidance on how to set up breakpoints for debugging, a fundamental aspect of the debugging process which allows the developer to stop the execution of their code at certain points and inspect their program at those stages.
Finally, the document concludes by providing a link to a reference blog. This blog offers additional information and guidance on configuring the remote Python interpreter in PyCharm, providing the reader with a well-rounded understanding of the process.
Introduction- e - waste – definition - sources of e-waste– hazardous substances in e-waste - effects of e-waste on environment and human health- need for e-waste management– e-waste handling rules - waste minimization techniques for managing e-waste – recycling of e-waste - disposal treatment methods of e- waste – mechanism of extraction of precious metal from leaching solution-global Scenario of E-waste – E-waste in India- case studies.
Electric vehicle and photovoltaic advanced roles in enhancing the financial p...IJECEIAES
Climate change's impact on the planet forced the United Nations and governments to promote green energies and electric transportation. The deployments of photovoltaic (PV) and electric vehicle (EV) systems gained stronger momentum due to their numerous advantages over fossil fuel types. The advantages go beyond sustainability to reach financial support and stability. The work in this paper introduces the hybrid system between PV and EV to support industrial and commercial plants. This paper covers the theoretical framework of the proposed hybrid system including the required equation to complete the cost analysis when PV and EV are present. In addition, the proposed design diagram which sets the priorities and requirements of the system is presented. The proposed approach allows setup to advance their power stability, especially during power outages. The presented information supports researchers and plant owners to complete the necessary analysis while promoting the deployment of clean energy. The result of a case study that represents a dairy milk farmer supports the theoretical works and highlights its advanced benefits to existing plants. The short return on investment of the proposed approach supports the paper's novelty approach for the sustainable electrical system. In addition, the proposed system allows for an isolated power setup without the need for a transmission line which enhances the safety of the electrical network
Null Bangalore | Pentesters Approach to AWS IAMDivyanshu
#Abstract:
- Learn more about the real-world methods for auditing AWS IAM (Identity and Access Management) as a pentester. So let us proceed with a brief discussion of IAM as well as some typical misconfigurations and their potential exploits in order to reinforce the understanding of IAM security best practices.
- Gain actionable insights into AWS IAM policies and roles, using hands on approach.
#Prerequisites:
- Basic understanding of AWS services and architecture
- Familiarity with cloud security concepts
- Experience using the AWS Management Console or AWS CLI.
- For hands on lab create account on [killercoda.com](https://killercoda.com/cloudsecurity-scenario/)
# Scenario Covered:
- Basics of IAM in AWS
- Implementing IAM Policies with Least Privilege to Manage S3 Bucket
- Objective: Create an S3 bucket with least privilege IAM policy and validate access.
- Steps:
- Create S3 bucket.
- Attach least privilege policy to IAM user.
- Validate access.
- Exploiting IAM PassRole Misconfiguration
-Allows a user to pass a specific IAM role to an AWS service (ec2), typically used for service access delegation. Then exploit PassRole Misconfiguration granting unauthorized access to sensitive resources.
- Objective: Demonstrate how a PassRole misconfiguration can grant unauthorized access.
- Steps:
- Allow user to pass IAM role to EC2.
- Exploit misconfiguration for unauthorized access.
- Access sensitive resources.
- Exploiting IAM AssumeRole Misconfiguration with Overly Permissive Role
- An overly permissive IAM role configuration can lead to privilege escalation by creating a role with administrative privileges and allow a user to assume this role.
- Objective: Show how overly permissive IAM roles can lead to privilege escalation.
- Steps:
- Create role with administrative privileges.
- Allow user to assume the role.
- Perform administrative actions.
- Differentiation between PassRole vs AssumeRole
Try at [killercoda.com](https://killercoda.com/cloudsecurity-scenario/)
Software Engineering and Project Management - Introduction, Modeling Concepts...Prakhyath Rai
Introduction, Modeling Concepts and Class Modeling: What is Object orientation? What is OO development? OO Themes; Evidence for usefulness of OO development; OO modeling history. Modeling
as Design technique: Modeling, abstraction, The Three models. Class Modeling: Object and Class Concept, Link and associations concepts, Generalization and Inheritance, A sample class model, Navigation of class models, and UML diagrams
Building the Analysis Models: Requirement Analysis, Analysis Model Approaches, Data modeling Concepts, Object Oriented Analysis, Scenario-Based Modeling, Flow-Oriented Modeling, class Based Modeling, Creating a Behavioral Model.
International Conference on NLP, Artificial Intelligence, Machine Learning an...gerogepatton
International Conference on NLP, Artificial Intelligence, Machine Learning and Applications (NLAIM 2024) offers a premier global platform for exchanging insights and findings in the theory, methodology, and applications of NLP, Artificial Intelligence, Machine Learning, and their applications. The conference seeks substantial contributions across all key domains of NLP, Artificial Intelligence, Machine Learning, and their practical applications, aiming to foster both theoretical advancements and real-world implementations. With a focus on facilitating collaboration between researchers and practitioners from academia and industry, the conference serves as a nexus for sharing the latest developments in the field.
The CBC machine is a common diagnostic tool used by doctors to measure a patient's red blood cell count, white blood cell count and platelet count. The machine uses a small sample of the patient's blood, which is then placed into special tubes and analyzed. The results of the analysis are then displayed on a screen for the doctor to review. The CBC machine is an important tool for diagnosing various conditions, such as anemia, infection and leukemia. It can also help to monitor a patient's response to treatment.
Advanced control scheme of doubly fed induction generator for wind turbine us...IJECEIAES
This paper describes a speed control device for generating electrical energy on an electricity network based on the doubly fed induction generator (DFIG) used for wind power conversion systems. At first, a double-fed induction generator model was constructed. A control law is formulated to govern the flow of energy between the stator of a DFIG and the energy network using three types of controllers: proportional integral (PI), sliding mode controller (SMC) and second order sliding mode controller (SOSMC). Their different results in terms of power reference tracking, reaction to unexpected speed fluctuations, sensitivity to perturbations, and resilience against machine parameter alterations are compared. MATLAB/Simulink was used to conduct the simulations for the preceding study. Multiple simulations have shown very satisfying results, and the investigations demonstrate the efficacy and power-enhancing capabilities of the suggested control system.
2. Contents
• Introduction
• Erosion and scouring
• Protective measures
• Literature review
• IS code design recommendation
• Study area
• Tools and techniques used
• Morphometric analysis
• steady flow
• Result and discussion
• Conclusion
• Reference
3. INTRODUCTION
• River silting and scouring are frequant problems in
meandering course.
• The Structures like dike, groyne, Bandalling.
• To reduce the velocity,deflecting the flow away from
the bank safety,increase flow depth(Navigation)
• The comparative study needed for satisfies required
velocity/flow depth for B/C
4. Objectives of river training work
• To know the river from changing its course
• To protect flooding of settlement area by safe
passing flood discharge
• To analyse Morphometric charecterstics of the
watershed
• To minimize scouring or erosion of river bank
• To ensure effect disposal of sediment load
5. Silting and scouring process
Fig 1:Typical silting and scouring process at river bend
• Silting(deposition)
• Scouring(erosion)
7. Literature view
Name of the author Title of the paper Date of
publication
Tools and methedology
Jens Kiesel et.el Application of a
hydrological-hydraulic
modelling cascade in
lowlands for investigating
water and sediment fluxes
in catchment, channel and
reach
30 sep 2013 Simulation of water and sediment
fluxes from the catchment to the reach
scale. Using SWAT(ArcGis
extension),HEC RAS and ADH.
Naveen Naidu Maddukuri
et.el
Design of embankment
and bank protection works
for hilly rivers
June 2015 the present study the flood
embankments and bank protection
measures are designed for hilly river in
different reaches by using predicted
water levels for 100 years return
period. Predicted water levels are used
to finalize the top level of the
embankments by adding sufficient free
board in the vulnerable reaches.The
predicted water level for 100 yr
discharge HEC-RAS
Amir Hamzeh Haghiabi and
Ehsan Zaredehdasht
Evaluation of HEC-RAS
Ability in Erosion and
Sediment Transport
Forecasting
March 2012 The authors studied sedimentation
analysis in Mollasani river station(Iran)
using HEC RAS 4
Md. Mostazur Rahman MODELING FLOOD
INUNDATION OF THE
JAMUNA RIVER
March, 2015 The study is conducted for extension
of floodplain and inhundation map of
Jamuna river using Bathymetry and
HEC RAS
8. IS code design recommendation
As per IS 14262-1995, “Planning and design guideline for revetment”
• Weight of stone on horizontal bed is
W=0.023
𝑆 𝑎
(𝑆 𝑎−1)3 𝑉6 (1)
‘W’ weight of stone in kg, Sa specific gravity of stone, and ‘V’ mean velocity of water in m/s
over the vertical under reference.
• Correction factor ‘K’ for computing weight of stone on sloping face may be obtained
from the following equation:
K = 1 −
𝑠𝑖𝑛𝜃2
𝑠𝑖𝑛𝛷2 (2)
Where,
θ = angle of bank slope with horizontal, and Φ= repose of material of protection.
• Size of the stone ‘Ds’, may be determined from the following relationship:
Ds =0.124
3 𝑊
𝑆𝑠
(3)
where
W = weight of stone in kg, and SS = specific gravity of stones.
• Minimum thickness of protection layer is required to withstand the negative head created
by velocity. This may be determined by the following relationship:
T=
𝑉2
2𝑔(𝑆𝑠−1)
(4)
Where, T = thickness of protection layer in m,V=velocity in m/s
10. • Venkatapur river originating from the Western Ghats near Bhatkal and
flows in Bhatkal and Sagar taluk before reaching to Arabian sea.
• Its basin spreads (74°35 E to 74° 40’ E longitude and 140 0 to 140 10 N)
having area 348 km2 and It flows for a length of 26.4 km before joining the
Arabian Sea near Shirali .
• Hydrometerologic features are watershed has uniform rainfall pattern of
300 cm per year and 90% of the rainfall occurs in 4 months June, July,
August and September, July being the peak of the monsoon.
• Geologically, the area consists of Pre-Cambrian gneisses and granites
constituting the major parts of the basin. In the coastal plain gneisses and
granites are capped by laterite. Wherever laterite capping is not found, it is
covered by Quaternary sediments of marine /estuarine process.
• Geomorphic features along the coast such as beach ridges, wave-cut
platform, paleoriver channels, terraces in the lower part of the river,
migration of river channels and abandoned channels, shifting of river
mouths, coast-perpendicular faults and embankments leading to sediment
traps, and backwater-lagoon systems.
11. Fig 6: Digital elevation model(DEM) of SRTM 30m resolution
12. TOOLS AND TECHNIQUES
Tools and software Purpose source
SRTM 30 meter DEM data For morphometric and to take river
cross section export to HEC RAS
www.earthexplorer.com
Arc GIS 10.1v To carry out area, perimeter,stream
order, relief etc(morphometric
parameter), interpolation rainfall and
discharge
ESRI(Environmental Systems Research
Institute )
HEC RAS 5.0.3 Unsteady analysis and sediment
transport
US army corps engineer’s
13. ArcGIS 10.1V
• ArcView GIS developed by Environmental Systems Research Institute (ESRI) is a
powerful and easy tool to create and use maps, view spatial data and perform spatial
analysis. ArcView GIS is equipped with excellent graphical user interface (GUI),
which enables visualization, exploring and the analysis of spatial data.
• ArcView GIS is capable of displaying, viewing, editing vector dataset called shape
files It has also the facility to display tables, charts, layouts associated with the
shape The processing, modeling, visualization and interpretation of grid based
raster data can be performed using the spatial analyst extension.
• Arc hydro tool is used for watershed delination which include flow direction, flow
accumulation, stream to feature and other tools are used for watershed delinate upto
sixth order definition.
14. HEC-RAS and HEC-GeoRAS
Fig 7:Interface method of GIS linkage by HEC-GeoRAS
• HEC GeoRAS is ArcGIS extension is useful for river floodplain mapping and very important tool for
exporting DEM river section to HEC RAS.
• For effective operation of geometry, the section should be in projected geographic system.
• The geometric data created is shown in below figure.
15. Fig 8:Construction of river geometry in HEC-GeoRAS
Fig 9:Imported cross section in Hec ras
17. Morphometric analysis
Fig 8: Flow chart of morphometric analysis
MORPHOMETRY
Linear Aspects Areal aspects Relief Aspect
Stream order
Stream length
Bifurcation ratio
Stream length
ratio
Drainage pattern
Form factor
Elongation ratio
Compactness
ratio
Stream frequency
Circularity ratio
Basin relief
Relative ratio
Relative relief
Ruggedness
number
18. • Drainage density is the average length of streams per unit area within the basin Drainage density may be
thought of as an expression of the closeness of the spacing of channels. The drainage density of the
watershed is 2.503 which is moderate
Drainage density(Dd)=
𝐿 𝑢
𝐴
(4)
• Stream Frequency (F): Defined stream frequency as the number of stream segments of all orders per unit
area of the basin. High stream frequency is favoured in regions of impermeable subsoil and steep gradients.
Higher the stream frequency, faster is the surface run-off and therefore less time for infiltration.The stream
frequency of Venkatapur watershed 5.62 (No of streams/per sq.km) which is moderate
Stream frequency(F)= ∑
𝑁 𝑢
𝐴
(5)
• Bifurcation Ratio (Ru): The ratio of number of streams of any given order (Nu) to the number of streams in
the next higher order (Nu+1) is called bifurcation ratio
Ru= Nu/Nu+1
• Channel Sinuosity (S): Sinuosity is a quantitative index of stream meandering and a distinctive property of
channel pattern. It is related to the morphological, sedimentological and hydraulic characteristics of stream
channels.
S=
𝑆 𝐿
𝐿 𝑏
(6)
• Elongation Ratio (Re): It is defined as the ratio between the diameter of a circle of the same area as the
drainage basin to the maximum length of the basin (Lb).
Re=
2 𝐴/𝛱
𝐿 𝑏
(7)
• Circularity Ratio (Rc): Circulatory ratio is the ratio of the basin area (A) to the area of the circle of basin
perimeter (P) . It is the measure of the degree of circularity of the given basin.
Rc =
4𝜋𝐴
𝑃2 (8)
19. • Form Factor (Rf): Form factor is the ratio of the basin area (A) to the square of the maximum
length of the basin (Lb)
Rf=
𝐴
𝐿 𝑏
2 (8)
• Compactness Constant (Cc): Compactness constant can be calculated by using the formula:
Cc=0.2821 P/A2 (9)
• Relief Ratio (Rh): defined relief ratio as the total relief (H) of watershed divided by maximum
length of the watershed (Lb). It is an indicator of the potential energy available to move water
and sediments down the slope.
Rh=
𝐻
𝐿 𝑏
(10)
• Ruggedness Number (RN): It is defined as the product of the total relief (H) and drainage
density (Dd). It gives an idea of overall roughness of a watershed.
RN=
H×Dd
100
(11)
• Relative Relief (Rr): It is the ratio of the total relief (H) to the perimeter (P) of the watershed.
Low relief ratio is indicative of gentle topography while high relief ratio is characteristic of
steep slopes.
R =
𝐻
𝑃
(12)
20. Result(Morphometric analysis)
• The SRTM 30m resolution Digital elevation model of study area extracted from
www.earthexplorer.com website.
• ArcGis 10.1 commands such as fill sink,flow direction, flow accumulation ,stream to features
to convert raster data into Vector data and there after general dimensions of watershed is
obtained in attribute table.
• The fig shows Drainage map of Venkatapura river Watershed upto 6th order streams shown
below
Fig 7:Drainage map of Venkatapur watershed
21. Table1:Basin parameter
Table 2:Morphometric charecterstics of Venkatapur watershed
Basin Parameter Dimension
Area 348km2
Perimeter 81.63km
Length 26.01km
Width 16.9km
Max elevation 812m
Min elevation 0m
number of
stream
Total
length(km)
BF
rati
o
mean
length(m)
cumulative
length(m)
length
ratio
drainage
density(Km/
km2)
1395 463.23 0.332 463.23
2.503
459 193.62 3.04 0.421 656.85 1.2703
82 100.88 5.6 1.230 757.73 2.916
15 62.9 5.47 4.193 820.63 3.408
3 38.032 5 12.67 858.662 3.023
1 12.44 3 12.44 871.102 0.981
Form
factor(Rf)
compactness
coefficient
Circularity
ratio
Elongation
ratio
Constant of channel
maintence
Channel
Sinuocity
0.5 1.234 0.65 0.809 0.4 2.09
Table 3: Morphometric characterstics of Venkatapur river(Areal Aspect)
Relief ratio Relative relief max
relief(H)(meter)
Ruggedness
number
0.000312 0.0000994 812 0.00203
Table 4:Morphometric Charecterstics of Venkatapur(Relief aspect)
22. Morphometric analysis graph
Fig 8:mean stream length(log scale) v/s stream order Fig 9:stream number(log scale) v/s stream order
• The drainage density of the watershed is 2.503 which is moderate .
• The average bifurcation ratio of the Venkatapur River watershed is 4.42. The bifurcation ratio between 2nd
and 3rd order streams is distinctly high (5.6) indicating a strong control of the structure of the underlying
rocks on the development of these higher order streams. Similarly, the ratio between 3rd and 4th order
streams is also relatively high (5.4).
• The channel sinuosity values is 2.09 which indicate presence meandering course.
• For Venkatapur watershed the circularity ratio is 0.809 which represent strong relief and steep ground .
• The form factor for the watersheds is 0.51 indicating moderately flat nature of all the basins .
• . The constant of channel maintenance value for the entire Venkatapur River basin is 0.4 (Table 4) meaning
0.40 km2 of surface area is required to maintain each kilometre of channel length. The compactness ratio is
1.234 (from table 6).
1
10
100
1000
10000
0 2 4 6 8
Numberofstreams
Stream order
Venkatapura watershed
0.1
1
10
100
0 1 2 3 4 5 6 7
meanstreamlength
stream order
Venkatapura watershed
23. HEC RAS steady flow analysis
The HEC RAS hydraulic analysis is carried out with some assumptions in geometric and
hydraulic design
The flow cannot surpass over ridge line(i.e drawn by flow path line) under any condition.
The main channel Manning’s roughness assumed with clean water with more of stone and
weeds(n=0.035) .For bank region it is considered sluggish reach with weedy pools(0.07).
The hydraulic coefficient assumed under gradual transition condition
(contraction=0.1,expansion=0.3).
Table 5 :Input steady flow data on upstream, tribuatary,downstream
Where, RS-river station,Tribute_r-tributary, U1-upstream ,down_1-downstream
channel sinuiosity of the study area devided into 3 parts,they are upstream, downstream and tributery to
understand meandering range given in below table
River Reach RS 10yr 50yr 100yr
1 Venk_rive_r Tribute_r 4718.953 89.89 129.2 170.6
2 Venk_rive_r U1 12712.37 1191.8 2005.72 2352
3 Venk_rive_r down_1 3303.86 1281.69 2134.82 2600
24. Table 6: Channel sinuiosity of the study reaches
• It(Table 6) indicates no serious meandering process (Sn<1.5) but heavy rainfall event
can bring significant amount flow discharge which has to tackle by bank protection
structure.
• Steady flow analysis is carried out for entire 32 cross sections(fig 9) taking boundary
condition at extreme stations of upstream, tributary ,downstream are 12712.37, 4718.953
and 3303.86 respectively for 10, 50 and 100 year return period shown in table 5
• The main purpose of the carryouting steady flow analysis is to know change in water
surface and corresponding velocity at every sections.
• After successfully performing steady flow analysis over the cross sections, there found
critical cross section are found which are either changed it’s course or overtopped the
bank for 100 year return period as shown in below.
Upstream (U1) Downstream (down 1) Tributary(tribute_r)
Channel length(km) 10.23 4.803 5.378
Axial length(km) 8.89 3.988 3.873
Sinuosity(Sn) 1.15 1.204 1.39
25.
26.
27.
28.
29. Fig 10:Sections failed by over topping(100 year discharge) on left V/S After
embanked the same river section on right
30. The hydraulic character of river before and after emabankment
Table 7:The hydraulic charecterstics of river reach before(left) and after(right)
embankment
31. Fig:Longitudinal profile of the of the river sections after steady flow analysis of upstream,
tributary,downstream(from top to bottom)
33. River training embankment design
The descriptive design computation of protection work for sloping bank as per
IS 14262-1995 is given below:
1. Velocity = 3.33m/s, 2.12m/s and 4.26m/s(average velocity flow under no
embankment condition at reach upstream,tribuatery and downstream
respectively)
2. Bank slope (θ) = 2 H:1 V (26.560)
3. Angle of internal friction of soil of bank material(Φ) = 350 (gravel mixed
wih sand)
4. Specific gravity of boulder stones (Sa) = 2.65
5. d50 stones being used for filling crates =175mm (for example as per
specifications, the stones of size 125mm to 225mm are proposed(assumed).
Therefore ,d50 is assumed as 175mm(125+225)/2)( Naveen Naidu et.el,2015)
• At unstable section(Fr>1) provide extra 10cm or 0.1m thickness of stone
pitching of crates then corresponding reach thickness
35. Fig 11:Embankment with 2H:1V for upstream reach
Fig12:Embankment with 2H:1V for upstream reach at turning
Fig13:Embankment with 2H:1V for upstream reach at unstable section
36. Fig 14:Embankment with 2.5H:1V for tributary reach
Fig 15:Embankment with 2.5H:1V for tributary reach at turning
Fig 16:Embankment with 2.5H:1V for tributary reach at unstable section
37. Fig17: Embankment with 3H:1V for downsream reach
Fig 18: Embankment with 3H:1V for downstream reach at turning
39. Conclusion
• Construction of embankment of directly associated with socio-economic growth of
society(CWC,2013)
• It is to be observed that construction embankment increases velocity of flow for same
discharge and are taken by inerodible material(abrasive resistance) of the embankment.
• Adding sufficient free board of atleast 1-1.5m height above the HFL.
• The of the top width of embankment can be kept around 3-3.5 m and at turning 15m based on
type of land use behind the embankment.
• Dense packing of crates to achieve max density for safty against ill effect of high velocity of
water
• The time to time inspection and maintenance of embankment is required for efficient working
of the structure upto it’s design life
40. References
Bronstert A.. Bardossy , Bismuth C.,(2007) “Multi-scale modelling of land-use change and river training
effects on floods in Rhine basin”, River. Res. Applic. 23: 1102–1125 (2007),
Central water commission(CWC),India(2012), “Handbook of anti erosion,flood protection and river
training”,Delhi,july 2012, p 24-45
Chow Ven Te (1988), “Open channel hydraulics” ,2nd edition,McGrawhill book company,p 13-20
Fathema Nuzeth and Rehman Anirban (2009),”Stability of slopes”,researchgate,Journal of applied science,
pp1-5
Garg S.K. (2009), “Water resource engineering-2” ,Lakshmi publication,p 240-254
Gharbi Mohamed, Soualmia Amel, Dartus Denis, Masbernat Lucien (2016)“Floods effects on rivers
morphological changes application to the Medjerda River in Tunisia”, J. Hydrol. Hydromech., 64, 2016, 1,
56–66
H.M.Raghunath(2006),“Hydrology;Principle,analysis,design”, New age publisher, 2nd edition, p 222-232
Haghiabi Amir Hamzeh and Zaredehdasht Ehsan (2012),“Evaluation of HEC-RAS Ability in Erosion and
Sediment Transport Forecasting”,IDOSI pub, World Applied Sciences Journal 17 (11): 1490-1497, 2012
Hegde VS, Nayak SR(2015), “Evolution of Diverging Spits Across the Tropical RiverMouths, Central West
Coast of India” , Journal of coastal engineering, vol 8,issue 2,pp 2-5
Horritta M.S, Batesb P.D.,(2002), “Evaluation of 1D and 2D numerical models for predicting river flood
inundation”, Journal of Hydrology ,268 (2002), 87–99
Hoyle J.,Brooks A. and Spencer J.,(2012) “Modelling reach-scale variability in sediment mobility: An
approach for within-reach prioritization of river rehabilitation”,Willey library,River reas applic,28,609-629.
Ibrampurkar M.M. and Chachadi A.G., (2010) “Quantitative Morphometric Analysis of Mandovi River
Basin in Goa & Karnataka - Western Ghats.” pp 86-94
41. IS 14262-1995(2001), “Planning and design of revetment guidelines”,BIS, p 1-7
Mingfu Guan (2016) “Quantifying the combined effects of multiple extreme floods on
river channel geometry and on flood hazards” , Journal of Hydrology 538 (2016) 256–
268
Naidu Naveen Maddukuri, Ravali N.V.N., Vasudeo A. D. (2015), “Design of
embankments and bank protection works for hilly rivers”, Journal of Civil Engineering
and Environmental Technology, Volume 2, Number 9; April – June, 2015 pp 58-62
Nayak S.R(2012) “Geomorphic Processes in the Vicinity of the Venkatapur River
Mouth, Central West Coast of India: Implications for Estuarine Sedimentation”, Journal
coastal research,vol 26,issue 5,p 925-934
Rehaman Anirban Md(2010), “Comparative analysis of design and performance of
bank protection work at Titporol and”,Bangladesh University, pp 12-30
Rehman Mustafizur Md (2015) “Modeeling flood inhundation of the Jamuna
River”,Bangladesh University, pp17-44
Stahler A.N(1964), “Quantitative analysis of watershed Geomorphology”,Transaction
of American Geophysical Union, Vol 38,pp 913-920
US army corps of engineer’s(2010), “HEC-RAS 4.1 user manual”,(Jan 2010), p 60-89
Wolff C.G. and Harvey M.D. (2004),”San Miguel River Restoration:Geomorphology
and Hydraulic Engineering as a Basis for Design”,ASCE,Water resources,(2004),1-9