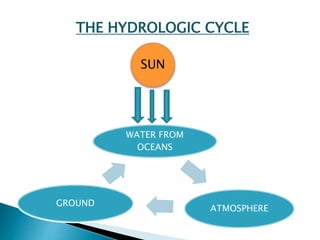
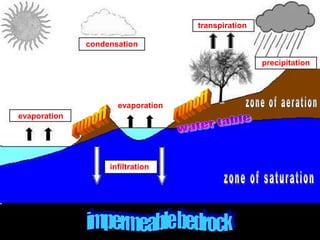
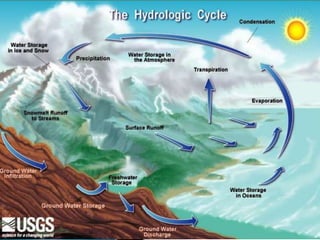
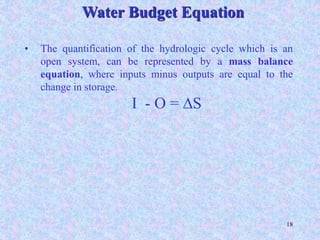
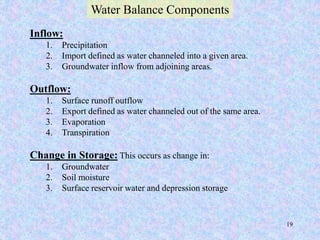
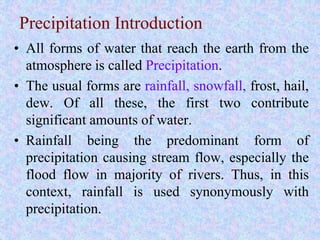
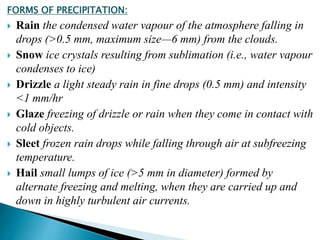
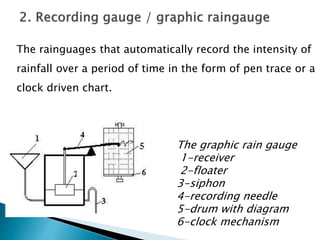
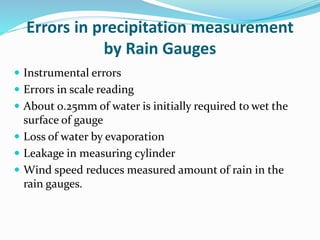
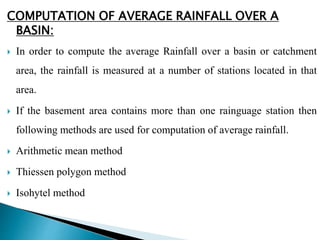
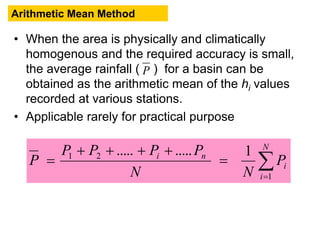
Prepared By:
Assistant Professor Ankit Patel
ME ( CPM)
INRODUCTION:
HYDROLOGY:
 Hydro – water and logos – science
 Hydrology means science of water.
 The flow of water across and through near surface environments
OR
 It is the science that deals with the occurrence, circulation and
distribution of water on the earth.
HYDROLOGY DEALS WITH:
 Estimation of water resources
 The study of processes such as precipitation, runoff,
evapotranspiration and their interaction.
 The study of problems such as floods, droughts and strategies to
combat them
BITS Edu CampusProf. Ankit Patel
ENGINEERING HYDROLOGY APPLICATOINS:
 The maximum probable flood that may occur at a given sites and its
frequency
 Ground water development
 The maximum intensity off rainfall and its intensity
 Various methods of flood forecasting and flood control
 Selection of suitable site for a dam, reservoir and hydro electric power
generation.
 The capacity of storage structures such as reservoir
BITS Edu CampusProf. Ankit Patel
WATER FROM
OCEANS
ATMOSPHERE
GROUND
SUN
THE HYDROLOGIC CYCLE
BITS Edu CampusProf. Ankit Patel
The water cycle
is also called the
cycle.
BITS Edu Campus Prof. Ankit Patel
Water that is stored
in the oceans and
lakes can
and become a gas.
BITS Edu Campus Prof. Ankit Patel
As the water
rises through the
atmosphere, it cools,
condenses and becomes
BITS Edu Campus Prof. Ankit Patel
When the water gets
heavy enough it can fall
to the ground in the form
of different types of
BITS Edu Campus Prof. Ankit Patel
If the lithosphere (ground) is
saturated, the water that
has fallen can become
and flow directly into
streams, rivers, or lakes.BITS Edu Campus Prof. Ankit Patel
If the lithosphere is not
saturated, the water will
the lithosphere and move
into the zone of
or the zone of
BITS Edu Campus Prof. Ankit Patel
The interface (boundary)
between these two zones
is called the
BITS Edu Campus Prof. Ankit Patel
The roots of plants can
reach into the zone of
soak up the water, and the
water can then re-enter the
atmosphere through the
process of
BITS Edu Campus Prof. Ankit Patel
evaporation
condensation
infiltration
transpiration
precipitation
evaporation
BITS Edu Campus Prof. Ankit Patel
BITS Edu CampusProf. Ankit Patel
THE HYDROLOGIC CYCLE:
 The hydrologic cycle is the general continuous circulation
of water from the oceans to the atmosphere, to the
ground and back to the oceans again.
 Sun is the main source of energy for hydrologic cycle.
 Let us consider the cycle begins with oceans
BITS Edu CampusProf. Ankit Patel
The various stages of hydrologic cycle are
 Evaporation
 Precipitation
 Infiltration
 Transpiration
It is a continuous process
Each path of hydrologic cycle may have one or more
of the following
 Transportation of water
 Temporary storage
 Change of state
BITS Edu CampusProf. Ankit Patel
Catchment area: The area of a land draning into a stream or a water
course at a given location is known as catchment area.
It is also called as drainage area. In usa it is known as watershead.
BITS Edu CampusProf. Ankit Patel
• The quantification of the hydrologic cycle which is an
open system, can be represented by a mass balance
equation, where inputs minus outputs are equal to the
change in storage.
I - O = DS
Water Budget Equation
BITS Edu Campus Prof. Ankit Patel
Inflow:
1. Precipitation
2. Import defined as water channeled into a given area.
3. Groundwater inflow from adjoining areas.
Outflow:
1. Surface runoff outflow
2. Export defined as water channeled out of the same area.
3. Evaporation
4. Transpiration
Change in Storage: This occurs as change in:
1. Groundwater
2. Soil moisture
3. Surface reservoir water and depression storage
Water Balance Components
BITS Edu Campus Prof. Ankit Patel
Precipitation Introduction
• All forms of water that reach the earth from the
atmosphere is called Precipitation.
• The usual forms are rainfall, snowfall, frost, hail,
dew. Of all these, the first two contribute
significant amounts of water.
• Rainfall being the predominant form of
precipitation causing stream flow, especially the
flood flow in majority of rivers. Thus, in this
context, rainfall is used synonymously with
precipitation.
BITS Edu Campus Prof. Ankit Patel
FORMS OF PRECIPITATION:
 Rain the condensed water vapour of the atmosphere falling in
drops (>0.5 mm, maximum size—6 mm) from the clouds.
 Snow ice crystals resulting from sublimation (i.e., water vapour
condenses to ice)
 Drizzle a light steady rain in fine drops (0.5 mm) and intensity
<1 mm/hr
 Glaze freezing of drizzle or rain when they come in contact with
cold objects.
 Sleet frozen rain drops while falling through air at subfreezing
temperature.
 Hail small lumps of ice (>5 mm in diameter) formed by
alternate freezing and melting, when they are carried up and
down in highly turbulent air currents.
BITS Edu CampusProf. Ankit Patel
Forms of precipitation
BITS Edu Campus Prof. Ankit Patel
TYPES OF PRECIPITATION
PRECIPITATION
CONVECTIVE OROGRAPHIC CYCLONIC
NON-FRONTALFRONTAL
WARM FRONT COLD FRONT
BITS Edu CampusProf. Ankit Patel
Types of Precipitations.
1. Cyclonic Precipitation:
It is caused by the lifiting of an air mass due to the pressure difference.
If low pressure occurs in an area, air will flow horizontally from the
surrounding area, causing the air in the low pressure to uplift.
It is divided into
1. Frontal Precipitation
2. Non Frontal Precipitation
BITS Edu CampusProf. Ankit Patel
A. Frontal Precipitation
 When two air masses due to contrasting temperatures and densities
clash with each other, condensation and precipitation occur at the
surface of contact. This surface of contact is called a ‘front’ or ‘frontal
surface’.
 If a cold air mass drives out a warm air mass’ it is called a ‘cold front’
and if a warm air mass replaces the retreating cold air mass, it is
called a ‘warm front’. On the other hand, if the two air masses are
drawn simultaneously towards a low pressure area, the front
developed is stationary and is called a ‘stationary front’. Cold front
causes intense precipitation on comparatively small areas, while the
precipitation due to warm front is less intense but is spread over a
comparatively larger area. Cold fronts move faster than warm fronts
and usually overtake them, the frontal surfaces of cold and warm air
sliding against each other
BITS Edu CampusProf. Ankit Patel
B. Non Frontal Precipitation
In case of non frontal precipitation the moist warm air mass is stationary
and the moving cold air mass meets it. Thus due to lightness of the
warm air mass there is passive ascent of warm air over cold air owing to
the active under cutting. When the lifted warm air cools down at higher
altitude precipitation occurs.
2. Convective Precipitation:
It is caused by natural rising of warmer lighter air in colder, denser
surroundings. The difference in temperature may result from unequal
heating at the surface, unequal cooling at the top of the air layer.
Generally this kind of precipitation occurs in tropics where on a hot day
the ground surface gets heated unequally causing the warmer air to lift
up as the colder air come to take its place.
BITS Edu CampusProf. Ankit Patel
3. Orographic Precipitation:
It is caused by moist air masses, which strike some natural topographic
barriers like mountains, rise up causing condensation and precipitation.
The greatest amount of precipitation falls on the windward side and the
leeward side often has very little precipitation
BITS Edu CampusProf. Ankit Patel
Causes of PrecipitationBITS Edu CampusProf. Ankit Patel
RAINFALL MEASURMENT:
 Rainfall is the main source of water used for various purpose.
 Instrument used to collect and measure the precipitation is called rain
gauge.
 Rainfall at a place can be measured by a rain guage, usually in
cm.
 Rain guage is a cylindrical vessel assembly kept in open to
collect rain.
BITS Edu CampusProf. Ankit Patel
 TYPES OF RAINGUAGE
TYPES OF RAINGUAGE
NON-RECORDING RAINGUAGE SELF RECORDING(AUTOMATIC)
SYMON’S GUAGE
STANDARD NON RECORDING
•TIPPING BUCKET
•WEIGHING TYPE
•FLOAT TYPE
BITS Edu CampusProf. Ankit Patel
1. Nonrecording Gauges:
 The nonrecording gauge used in India is Symons gauge.
 Consists of a circular collecting area of 12.7 cm diameter
connected to the funnel and the rim of the collector is set in a
horizontal plane at a height of 30.5 cm above the ground level.
BITS Edu CampusProf. Ankit Patel
 The funnel discharges the rainfall catch into a receiving vessel
which is housed in a metallic container.
 The water in the receiving vessel is measured by a graduated
measuring glass with an accuracy of 0.1 mm.
 The rainfall is measured at 8:30 a.m. and is recorded as the
rainfall of that day.
 The collecting bottle cannot hold more than 10 cm of rain and
thus in case of heavy rainfall frequent readings must be taken.
 However last reading must be taken at 8:30 a.m. and the sum
of previous readings in the past 24 hours is the rainfall of that
day.
BITS Edu CampusProf. Ankit Patel
(a) Tipping-Bucket type:
 This is a 30.5 cm size raingauge used by US Weather Bureau.
 The catch from the funnel falls onto one of a pair of small
buckets.
 These buckets are so balanced that when .25 mm of rainfall
collects in one bucket it tips and brings the other bucket in
position and the water is collected in storage can.
 The tipping actuates an electrically driven pen to plot the
intensity of rainfall with time.
 The water in storage can is measured regularly to give total
rainfall.
BITS Edu CampusProf. Ankit Patel
(b) Weighing-Bucket type
 The weighing bucket rainguage essentially consisits of a
receiver bucket supported by a spring or lever balance or any
other weighing mechanism. The movement of bucket due to
its on the clock driven recording drum.
 The rainguage produces a graph of cumulative rainfall versus
time.
BITS Edu CampusProf. Ankit Patel
(c) Float type:
 In this type of rainguage a funnel is provided at one end of the
rectangular container and a rotating recording drum is provided at
the other end.
 The working of a float type rainguage is similar to the weighing
bucket type guage.
 A funnel receives the rain water which is collected In a
rectangular container. A float is provided at the bottom of
container the float is raised as the water level rises in the container
its movement is being recorded by a pen moving on the graph
paper wrapped on the recording clock driven drum.
 It consist of syphon which starts functioning when flot rises at
some definite height and the container goes on emptying
gradually.
BITS Edu CampusProf. Ankit Patel
The graphic rain gauge
1-receiver
2-floater
3-siphon
4-recording needle
5-drum with diagram
6-clock mechanism
The rainguages that automatically record the intensity of
rainfall over a period of time in the form of pen trace or a
clock driven chart.
BITS Edu CampusProf. Ankit Patel
Errors in precipitation measurement
by Rain Gauges
 Instrumental errors
 Errors in scale reading
 About 0.25mm of water is initially required to wet the
surface of gauge
 Loss of water by evaporation
 Leakage in measuring cylinder
 Wind speed reduces measured amount of rain in the
rain gauges.
BITS Edu Campus Prof. Ankit Patel
COMPUTATION OF AVERAGE RAINFALL OVER A
BASIN:
 In order to compute the average Rainfall over a basin or catchment
area, the rainfall is measured at a number of stations located in that
area.
 If the basement area contains more than one rainguage station then
following methods are used for computation of average rainfall.
 Arithmetic mean method
 Thiessen polygon method
 Isohytel method
BITS Edu CampusProf. Ankit Patel
• When the area is physically and climatically
homogenous and the required accuracy is small,
the average rainfall ( ) for a basin can be
obtained as the arithmetic mean of the hi values
recorded at various stations.
• Applicable rarely for practical purpose
Arithmetic Mean Method




N
i
i
ni
P
NN
PPPP
P
1
21 1..........
P
BITS Edu Campus Prof. Ankit Patel
Thiessen Polygon Method:
This is the weighted mean method. The rainfall is
never uniform over the entire area of the basin or
catchment, but varies in intensity and duration
from place to place. Thus the rainfall recorded by
each rain gauge station should be weighted
according to the area, it represents. This method is
more suitable under the following conditions:
- For areas of moderate size.
- When rainfall stations are few compared to the size
of the basin.
BITS Edu CampusProf. Ankit Patel
Thiessen polygons ……….
BITS Edu Campus Prof. Ankit Patel
Thiessen polygons ……….
A1
A2
A3
A4
A5
A6
A7
A8
P1
P2
P3
P4
P5
P6
P7
P8
BITS Edu Campus Prof. Ankit Patel
 m
mm
AAA
APAPAP
P



.....
.....
21
2211





M
i
i
i
total
i
M
i
i
A
A
P
A
AP
P
1
1
Thiessen polygons ……….
Generally for M station
The ratio is called the weightage factor of station i
A
Ai
BITS Edu Campus Prof. Ankit Patel
• An isohyet is a line joining points of equal rainfall
magnitude.
Isohyetal Method
F
B
E
A
C
D
12
9.2
4.0
7.0
7.2
9.1
10.0
10.0
12
8
8
6
6
4
4
a1a1
a2
a3
a4
a5
BITS Edu Campus Prof. Ankit Patel
• P1, P2, P3, …. , Pn – the values of the isohytes
• a1, a2, a3, …., a4 – are the inter isohytes area respectively
• A – the total catchment area
• - the mean precipitation over the catchment
Isohyetal Method
P
A
PP
a
PP
a
PP
a
P
nn
n 




 





 





 



2
...
22
1
1
32
2
21
1
The isohyet method is superior to the other two methods
especially when the stations are large in number.
NOTE
BITS Edu Campus Prof. Ankit Patel
COMPARISON BETWEEN METHODS FOR
CALCULATING AVERAGE RAINFALL
 Arithmetic mean method
 Assumes uniform rainfall distribution
 Very seldom occurs
 Easiest to use but least accurate
 Thiessen polygon method
 Assumes linear variation
 Use when gages are not uniformly distributed
 Can use gages outside of watershed
 Isohyetal method
 Theoretically the most accurate
 Most time consuming method
 Can use gages outside of the watershed
BITSEduCampusProf.AnkitPatel
Test for consistency record
• Let a group of 5 to 10 base stations in the
neighbourhood of the problem station X is selected
• Arrange the data of X stn rainfall and the average of the
neighbouring stations in reverse chronological order
(from recent to old record)
• Accumulate the precipitation of station X and
the average values of the group base stations
starting from the latest record.
• Plot the against as shown on the next
figure
• A decided break in the slope of the resulting plot is
observed that indicates a change in precipitation
regime of station X, i.e inconsistency.
• Therefore, is should be corrected by the factor shon on
the next slide
  xP
  avgP  xP
  avgP
BITS Edu CampusProf. Ankit Patel
(Double mass curve techniques)
Double Mass Curve Analysis
0
0.5
1
1.5
2
2.5
3
3.5
4
4.5
5
0 0.5 1 1.5 2 2.5
Accumulated annual rainfall of neigbouring stns in 10^3 cm
accumulatedannualrainfallofXstnin10^3cm
BITS Edu CampusProf. Ankit Patel
a
c
M
M
a
c

a
c
xcx
M
M
PP 
Pcx – corrected precipitation at any time period t1 at
stationX
Px – Original recorded precp. at time period t1 at
station X
Mc – corrected slope of the double mass curve
Ma – original slope of the mass curve
BITS Edu CampusProf. Ankit Patel
A rainfall at a palce can be completely described if its intensity,
duration and frequency are known. The intensity of rain is the
rain at which it is falling. The duration is the time for which
rainfall falling with the given intensity. Frequency is the
number of times rainfall falls.
A few commonly used methods are
 Mass curve of rainfall
 Hyetograph
BITS Edu CampusProf. Ankit Patel
Mass curve of rainfall
0
10
20
30
40
50
60
0 20 40 60 80 100 120
Time, hour
accumulatedprecipitation,mm
Mass Curve of Rainfall:
The total accumulated precipitation is plotted against time
BITS Edu CampusProf. Ankit Patel
Hyetograph of a storm
0
0.1
0.2
0.3
0.4
0.5
0 – 8 8 – 16 16 – 24 24 – 32 32 – 40 40 – 48
Time, hours
Intensity,cm/hr
Hyetograph
-A hyetograph is a graphical representation of the relationship
between the rainfall intensity and time
BITS Edu CampusProf. Ankit Patel
 Evaporation is a process by which water is converted
into gaseous state and is returned to the atmosphere as
Vapour.
 It is the process by which water in the liquid form
transforms into vapour through the transfer of energy.
 When water is converted from solid state to vapour
state without passing through liquid state then it is
called Sublimition.
 Due to evaporation loss of water in the form of vapour
from soil, snow, lakes, rivers, seas, reservoirs.
EVAPORATION
BITS Edu CampusProf. Ankit Patel
• Rate of evaporation dependent on
• Rate of evaporation increase with increase of temperature as
well as increase in wind velocity, but decrease with the increase
in humidity as well as with increase of dissolved salts in water.
• Further as open area of water and soil is more evaporation also
more and vice versa.
BITS Edu CampusProf. Ankit Patel
 John dalton was first scientist to describe the
process of evaporation scientifically.
Evaporation rate varies directly with difference
of vapour pressure between air and water.
E= C (ew – ea)
where,
E= rate of evaporation (mm/day)
ew &ea=vapour pressure in water and in air.
C = constant
This equation is called john dalton’s law of
evaporation.
Dalton’s law of Evaporation
BITS Edu CampusProf. Ankit Patel
i. The vapour pressure at the water surface and air above
ii. Air and water temperatures
iii. Wind speed
iv. Atmospheric pressure
v. Quality of water
vi. Size of water body
vii. Depth of water in the water body
viii. Humidity
ix. Radiation
Factor affecting evaporation
BITS Edu CampusProf. Ankit Patel
1. Empirical formulae
2. Water budget method
3. Energy budget method
4. Mass transfer method
5. Actual observations
6. Pan observations
Measurement of Evaporation
BITS Edu CampusProf. Ankit Patel
 Transpiration is the process by which water leaves the
water body of a living plants and reaches the
atmosphere as water vapour. The water is taken up by
the plant root system and escape through the leaves.
 The soil water used by crops is through the process of
evaporation. This loss of water in combined form of
evaporation and transpiration is called
EVAPOTRANSPIRATION (ET). Water use by
evapotranspiration is known as consumptive use of
crops.
 Evapotranspiration of water by a crop is the depth of
water consumed by evaporation and transpiration during
crop growth.
EVAPOTRANSPIRATION
BITS Edu CampusProf. Ankit Patel
 When consumptive use of crop is known, the water use
of large unit can be calculated.
 Consumptive use of for each crop is can be determined
which gives water requirement of crop. The value of
consumptive use of water varies from crop to crop and
also for the same crop it varies with time as well as
place.
 Detailed study of evapotranspiration is essential in in
the design of reservoir, irrigation canals, water balance
on earth surface and projects relating to water.
BITS Edu CampusProf. Ankit Patel
 Factors affecting evapotranspiration are same that
affect evaporation and transpiration. Some of the factor
are as follows.
1. Metrological factors : potential evapotranspiration is
controlled essentially in metrological factor.
Evapotranspiration increase as temperature, sunshine,
and wind velocity increase but decrease as the
humidity decrease.
2. Plant and soil factors:
 Evapotranspiration is less if adjoining land is
cropped because air becomes cool and more humid.
Factor affecting Evapotranspiration
BITS Edu CampusProf. Ankit Patel
1) Direct measurement of consumptive use of water:
a) Tank or lysimeter method
b) Field experimental plots
c)soil moisture studies
d)Integration method
e)Inflow and outflow method
2) Use of Empirical Formulae :
a) Blaney – Criddle equation
b) Thornthwaite equation
c) Christiansen equation
Measurement of Evapotranspiration or
Consumptive use of water
BITS Edu CampusProf. Ankit Patel
 INFILTRATION:
 Water entering the soil at the ground surface is called infiltration. It
replenishes the soil moisture deficiency and the excess moves
downward by the force of gravity called deep seepage or
 percolation and builds up the ground water table. The maximum rate
at which the soil in any given condition is capable of absorbing water
is called its infiltration capacity (fp).
 Infiltration (f) often begins at a high rate (20 to 25 cm/hr) and
decreases to a fairly steady state rate (fc) as the rain continues, called
the ultimate fp (= 1.25 to 2.0 cm/hr) (Fig. 3.6). The infiltration rate (f)
at any time t is given by Horton’s equation.
BITS Edu CampusProf. Ankit Patel
 The infiltration takes place at capacity rates only when the
intensity of rainfall equals or exceeds fp; i.e., f = fp when i ≥ fp;
but when i < fp, f < fp and the actual infiltration rates are
approximately equal to the rainfall rates.
 The infiltration depends upon the intensity and duration of
rainfall, weather (temperature), soil characteristics, vegetal
cover, land use, initial soil moisture content (initial wet- ness),
entrapped air and depth of the ground water table. The vegetal
cover provides protection against rain drop impact and helps to
increase infiltration.
BITS Edu CampusProf. Ankit Patel
 The downward flow of water from the land surface into
the soil medium is called infiltration.
 The part of precipitation that is not available as surface
runoff is referred as precipitation loss or abstraction.
Infiltration is a dominant abstraction.
 Infiltration first replenishes the soil moisture deficiency,
the excess water moves downward by force of gravity.
This downward movement under gravity is called
percolation (seepage).
 The rate at with water enters the ground surface and
then flow downwards is known as infiltration rate.
INFILTRATION
BITS Edu CampusProf. Ankit Patel
 Infiltration rate is higher in the beginning because it has
to meet the requirement of dry soil. It attains steady
constant value as passage of time.
 Infiltration rate is used for computation of water loss
due to infiltration for the determination of surface
runoff.
 Unit of infiltration rate is mm/hour.
 Maximum rate at which soil in any given condition is
capable of absorbing water is called its infiltration
capacity(f).
 Infiltration has great influence on rainfall, runoff,
transpiration of plants and evaporation from soil
surface.
 Infiltration is responsible for subsurface flow and
ground water flow. BITS Edu CampusProf. Ankit Patel
1. Soil moisture
2. Intensity of rainfall
3. Temperature
4. Duration of the rainfall
5. Texture of soil
6. Vegetal cover
7. Condition of soil surface
8. Compaction of soil
9. Depth of surface detention
Factor affecting Infiltration
BITS Edu CampusProf. Ankit Patel
 Infiltration capacity of soil does not remain constant, it
decrease with an increase of duration of rainfall.
 In hydrological computations for computing surface
runoff and flood discharge, use an average constant
value of infiltration rate called infiltration index.
Infiltration Indices
BITS Edu CampusProf. Ankit Patel
 Figure is superimposition of a rainfall hyetograph and
infiltration rate curve appropriate to the soil of
catchment.
 The area of hyetograph above infiltration curve
represent the surface runoff and that of below
represent the infiltration.
 If the rainfall intensity is always greater than the
infiltration rate, results are satisfactory, but if rainfall
fluctuate above and below the problems becomes
complicated. In this case is assumed to be
constant(average infiltration) throughout the rainfall
time.
 Infiltration indices are extremely useful for the analysis
of major floods when the soil is wet and infiltration rate
becomes constant.
BITS Edu CampusProf. Ankit Patel
1. Ø-index (phi-index)
2. W-index (dablu-index)
3. Wmin.-index.
Types of infiltration indices
BITS Edu CampusProf. Ankit Patel
(i) φ-index—The φ-index is defined as that rate of rainfall above which
the rainfall volume equals the runoff volume. The φ-index is relatively
simple and all losses due to infiltration, interception and depression
storage (i.e., storage in pits and ponds) are accounted
for; hence,
φ-index = P-Q
Where p = Precipitation
Q= Surface runoff
provided i > φ throughout the storm. The bar graph showing the time
distribution of rainfall, storm loss and rainfall excess (net rain or storm
runoff) is called a hyetograph, Fig. 3.12. Thus, the φ- index divides the
rainfall into net rain and storm loss.
BITS Edu CampusProf. Ankit Patel
(ii) W-index—The W-index is the average infiltration rate during the
time rainfall intensity exceeds the infiltration capacity rate, i.e.,
BITS Edu CampusProf. Ankit Patel
The W-index attempts to allow for depression storage, short rainless
periods during a storm and eliminates all rain periods during which i <
fp. Thus, the W-index is essentially equal to the φ-index minus the
average rate of retention by interception and depression storage,
i.e., W < φ.
(iii) Wmin-index—In this method, an average infiltration loss is
assumed throughout the storm, for the period i > f.
BITS Edu CampusProf. Ankit Patel
Measurement Of Infiltration
(1) Flooding type – simple and double ring type infiltrometers (as shown in
below
Figure) and (2) Rainfall simulator.
BITS Edu CampusProf. Ankit Patel
 The ring infiltrometer is a simple device used to measure
the infiltration capacity of a soil. An open cylindrical ring
is forced a few centimeters into the soil and filled with
water. By measuring the rate at which the level of ponded
water decreases, one can obtain an estimate of the
infiltration capacity as a function of time. In simple/single
ring infiltrometer infiltrated water spreads out in outer
adjoining area leading to over-estimation.
 In double ring type the outer ring provides water jacket to
the infiltrating water from the inner ring and hence
prevents the spreading out of the infiltrating water from
the inner ring. The water depths in both rings are kept the
same during the observation period. Because of high
spatial variability, several measurements must be taken to
get a reasonable estimate of the infiltration capacity of a
soil.
BITS Edu CampusProf. Ankit Patel
Thank You
BITS Edu CampusProf. Ankit Patel

Module 1 introduction

  • 1.
    Prepared By: Assistant ProfessorAnkit Patel ME ( CPM)
  • 2.
    INRODUCTION: HYDROLOGY:  Hydro –water and logos – science  Hydrology means science of water.  The flow of water across and through near surface environments OR  It is the science that deals with the occurrence, circulation and distribution of water on the earth. HYDROLOGY DEALS WITH:  Estimation of water resources  The study of processes such as precipitation, runoff, evapotranspiration and their interaction.  The study of problems such as floods, droughts and strategies to combat them BITS Edu CampusProf. Ankit Patel
  • 3.
    ENGINEERING HYDROLOGY APPLICATOINS: The maximum probable flood that may occur at a given sites and its frequency  Ground water development  The maximum intensity off rainfall and its intensity  Various methods of flood forecasting and flood control  Selection of suitable site for a dam, reservoir and hydro electric power generation.  The capacity of storage structures such as reservoir BITS Edu CampusProf. Ankit Patel
  • 4.
    WATER FROM OCEANS ATMOSPHERE GROUND SUN THE HYDROLOGICCYCLE BITS Edu CampusProf. Ankit Patel
  • 5.
    The water cycle isalso called the cycle. BITS Edu Campus Prof. Ankit Patel
  • 6.
    Water that isstored in the oceans and lakes can and become a gas. BITS Edu Campus Prof. Ankit Patel
  • 7.
    As the water risesthrough the atmosphere, it cools, condenses and becomes BITS Edu Campus Prof. Ankit Patel
  • 8.
    When the watergets heavy enough it can fall to the ground in the form of different types of BITS Edu Campus Prof. Ankit Patel
  • 9.
    If the lithosphere(ground) is saturated, the water that has fallen can become and flow directly into streams, rivers, or lakes.BITS Edu Campus Prof. Ankit Patel
  • 10.
    If the lithosphereis not saturated, the water will the lithosphere and move into the zone of or the zone of BITS Edu Campus Prof. Ankit Patel
  • 11.
    The interface (boundary) betweenthese two zones is called the BITS Edu Campus Prof. Ankit Patel
  • 12.
    The roots ofplants can reach into the zone of soak up the water, and the water can then re-enter the atmosphere through the process of BITS Edu Campus Prof. Ankit Patel
  • 13.
  • 14.
  • 15.
    THE HYDROLOGIC CYCLE: The hydrologic cycle is the general continuous circulation of water from the oceans to the atmosphere, to the ground and back to the oceans again.  Sun is the main source of energy for hydrologic cycle.  Let us consider the cycle begins with oceans BITS Edu CampusProf. Ankit Patel
  • 16.
    The various stagesof hydrologic cycle are  Evaporation  Precipitation  Infiltration  Transpiration It is a continuous process Each path of hydrologic cycle may have one or more of the following  Transportation of water  Temporary storage  Change of state BITS Edu CampusProf. Ankit Patel
  • 17.
    Catchment area: Thearea of a land draning into a stream or a water course at a given location is known as catchment area. It is also called as drainage area. In usa it is known as watershead. BITS Edu CampusProf. Ankit Patel
  • 18.
    • The quantificationof the hydrologic cycle which is an open system, can be represented by a mass balance equation, where inputs minus outputs are equal to the change in storage. I - O = DS Water Budget Equation BITS Edu Campus Prof. Ankit Patel
  • 19.
    Inflow: 1. Precipitation 2. Importdefined as water channeled into a given area. 3. Groundwater inflow from adjoining areas. Outflow: 1. Surface runoff outflow 2. Export defined as water channeled out of the same area. 3. Evaporation 4. Transpiration Change in Storage: This occurs as change in: 1. Groundwater 2. Soil moisture 3. Surface reservoir water and depression storage Water Balance Components BITS Edu Campus Prof. Ankit Patel
  • 20.
    Precipitation Introduction • Allforms of water that reach the earth from the atmosphere is called Precipitation. • The usual forms are rainfall, snowfall, frost, hail, dew. Of all these, the first two contribute significant amounts of water. • Rainfall being the predominant form of precipitation causing stream flow, especially the flood flow in majority of rivers. Thus, in this context, rainfall is used synonymously with precipitation. BITS Edu Campus Prof. Ankit Patel
  • 21.
    FORMS OF PRECIPITATION: Rain the condensed water vapour of the atmosphere falling in drops (>0.5 mm, maximum size—6 mm) from the clouds.  Snow ice crystals resulting from sublimation (i.e., water vapour condenses to ice)  Drizzle a light steady rain in fine drops (0.5 mm) and intensity <1 mm/hr  Glaze freezing of drizzle or rain when they come in contact with cold objects.  Sleet frozen rain drops while falling through air at subfreezing temperature.  Hail small lumps of ice (>5 mm in diameter) formed by alternate freezing and melting, when they are carried up and down in highly turbulent air currents. BITS Edu CampusProf. Ankit Patel
  • 22.
    Forms of precipitation BITSEdu Campus Prof. Ankit Patel
  • 23.
    TYPES OF PRECIPITATION PRECIPITATION CONVECTIVEOROGRAPHIC CYCLONIC NON-FRONTALFRONTAL WARM FRONT COLD FRONT BITS Edu CampusProf. Ankit Patel
  • 24.
    Types of Precipitations. 1.Cyclonic Precipitation: It is caused by the lifiting of an air mass due to the pressure difference. If low pressure occurs in an area, air will flow horizontally from the surrounding area, causing the air in the low pressure to uplift. It is divided into 1. Frontal Precipitation 2. Non Frontal Precipitation BITS Edu CampusProf. Ankit Patel
  • 25.
    A. Frontal Precipitation When two air masses due to contrasting temperatures and densities clash with each other, condensation and precipitation occur at the surface of contact. This surface of contact is called a ‘front’ or ‘frontal surface’.  If a cold air mass drives out a warm air mass’ it is called a ‘cold front’ and if a warm air mass replaces the retreating cold air mass, it is called a ‘warm front’. On the other hand, if the two air masses are drawn simultaneously towards a low pressure area, the front developed is stationary and is called a ‘stationary front’. Cold front causes intense precipitation on comparatively small areas, while the precipitation due to warm front is less intense but is spread over a comparatively larger area. Cold fronts move faster than warm fronts and usually overtake them, the frontal surfaces of cold and warm air sliding against each other BITS Edu CampusProf. Ankit Patel
  • 26.
    B. Non FrontalPrecipitation In case of non frontal precipitation the moist warm air mass is stationary and the moving cold air mass meets it. Thus due to lightness of the warm air mass there is passive ascent of warm air over cold air owing to the active under cutting. When the lifted warm air cools down at higher altitude precipitation occurs. 2. Convective Precipitation: It is caused by natural rising of warmer lighter air in colder, denser surroundings. The difference in temperature may result from unequal heating at the surface, unequal cooling at the top of the air layer. Generally this kind of precipitation occurs in tropics where on a hot day the ground surface gets heated unequally causing the warmer air to lift up as the colder air come to take its place. BITS Edu CampusProf. Ankit Patel
  • 27.
    3. Orographic Precipitation: Itis caused by moist air masses, which strike some natural topographic barriers like mountains, rise up causing condensation and precipitation. The greatest amount of precipitation falls on the windward side and the leeward side often has very little precipitation BITS Edu CampusProf. Ankit Patel
  • 28.
    Causes of PrecipitationBITSEdu CampusProf. Ankit Patel
  • 29.
    RAINFALL MEASURMENT:  Rainfallis the main source of water used for various purpose.  Instrument used to collect and measure the precipitation is called rain gauge.  Rainfall at a place can be measured by a rain guage, usually in cm.  Rain guage is a cylindrical vessel assembly kept in open to collect rain. BITS Edu CampusProf. Ankit Patel
  • 30.
     TYPES OFRAINGUAGE TYPES OF RAINGUAGE NON-RECORDING RAINGUAGE SELF RECORDING(AUTOMATIC) SYMON’S GUAGE STANDARD NON RECORDING •TIPPING BUCKET •WEIGHING TYPE •FLOAT TYPE BITS Edu CampusProf. Ankit Patel
  • 31.
    1. Nonrecording Gauges: The nonrecording gauge used in India is Symons gauge.  Consists of a circular collecting area of 12.7 cm diameter connected to the funnel and the rim of the collector is set in a horizontal plane at a height of 30.5 cm above the ground level. BITS Edu CampusProf. Ankit Patel
  • 32.
     The funneldischarges the rainfall catch into a receiving vessel which is housed in a metallic container.  The water in the receiving vessel is measured by a graduated measuring glass with an accuracy of 0.1 mm.  The rainfall is measured at 8:30 a.m. and is recorded as the rainfall of that day.  The collecting bottle cannot hold more than 10 cm of rain and thus in case of heavy rainfall frequent readings must be taken.  However last reading must be taken at 8:30 a.m. and the sum of previous readings in the past 24 hours is the rainfall of that day. BITS Edu CampusProf. Ankit Patel
  • 33.
    (a) Tipping-Bucket type: This is a 30.5 cm size raingauge used by US Weather Bureau.  The catch from the funnel falls onto one of a pair of small buckets.  These buckets are so balanced that when .25 mm of rainfall collects in one bucket it tips and brings the other bucket in position and the water is collected in storage can.  The tipping actuates an electrically driven pen to plot the intensity of rainfall with time.  The water in storage can is measured regularly to give total rainfall. BITS Edu CampusProf. Ankit Patel
  • 34.
  • 35.
    (b) Weighing-Bucket type The weighing bucket rainguage essentially consisits of a receiver bucket supported by a spring or lever balance or any other weighing mechanism. The movement of bucket due to its on the clock driven recording drum.  The rainguage produces a graph of cumulative rainfall versus time. BITS Edu CampusProf. Ankit Patel
  • 36.
  • 37.
    (c) Float type: In this type of rainguage a funnel is provided at one end of the rectangular container and a rotating recording drum is provided at the other end.  The working of a float type rainguage is similar to the weighing bucket type guage.  A funnel receives the rain water which is collected In a rectangular container. A float is provided at the bottom of container the float is raised as the water level rises in the container its movement is being recorded by a pen moving on the graph paper wrapped on the recording clock driven drum.  It consist of syphon which starts functioning when flot rises at some definite height and the container goes on emptying gradually. BITS Edu CampusProf. Ankit Patel
  • 38.
    The graphic raingauge 1-receiver 2-floater 3-siphon 4-recording needle 5-drum with diagram 6-clock mechanism The rainguages that automatically record the intensity of rainfall over a period of time in the form of pen trace or a clock driven chart. BITS Edu CampusProf. Ankit Patel
  • 39.
    Errors in precipitationmeasurement by Rain Gauges  Instrumental errors  Errors in scale reading  About 0.25mm of water is initially required to wet the surface of gauge  Loss of water by evaporation  Leakage in measuring cylinder  Wind speed reduces measured amount of rain in the rain gauges. BITS Edu Campus Prof. Ankit Patel
  • 40.
    COMPUTATION OF AVERAGERAINFALL OVER A BASIN:  In order to compute the average Rainfall over a basin or catchment area, the rainfall is measured at a number of stations located in that area.  If the basement area contains more than one rainguage station then following methods are used for computation of average rainfall.  Arithmetic mean method  Thiessen polygon method  Isohytel method BITS Edu CampusProf. Ankit Patel
  • 41.
    • When thearea is physically and climatically homogenous and the required accuracy is small, the average rainfall ( ) for a basin can be obtained as the arithmetic mean of the hi values recorded at various stations. • Applicable rarely for practical purpose Arithmetic Mean Method     N i i ni P NN PPPP P 1 21 1.......... P BITS Edu Campus Prof. Ankit Patel
  • 42.
    Thiessen Polygon Method: Thisis the weighted mean method. The rainfall is never uniform over the entire area of the basin or catchment, but varies in intensity and duration from place to place. Thus the rainfall recorded by each rain gauge station should be weighted according to the area, it represents. This method is more suitable under the following conditions: - For areas of moderate size. - When rainfall stations are few compared to the size of the basin. BITS Edu CampusProf. Ankit Patel
  • 43.
    Thiessen polygons ………. BITSEdu Campus Prof. Ankit Patel
  • 44.
  • 45.
     m mm AAA APAPAP P    ..... ..... 21 2211      M i i i total i M i i A A P A AP P 1 1 Thiessen polygons………. Generally for M station The ratio is called the weightage factor of station i A Ai BITS Edu Campus Prof. Ankit Patel
  • 46.
    • An isohyetis a line joining points of equal rainfall magnitude. Isohyetal Method F B E A C D 12 9.2 4.0 7.0 7.2 9.1 10.0 10.0 12 8 8 6 6 4 4 a1a1 a2 a3 a4 a5 BITS Edu Campus Prof. Ankit Patel
  • 47.
    • P1, P2,P3, …. , Pn – the values of the isohytes • a1, a2, a3, …., a4 – are the inter isohytes area respectively • A – the total catchment area • - the mean precipitation over the catchment Isohyetal Method P A PP a PP a PP a P nn n                         2 ... 22 1 1 32 2 21 1 The isohyet method is superior to the other two methods especially when the stations are large in number. NOTE BITS Edu Campus Prof. Ankit Patel
  • 48.
    COMPARISON BETWEEN METHODSFOR CALCULATING AVERAGE RAINFALL  Arithmetic mean method  Assumes uniform rainfall distribution  Very seldom occurs  Easiest to use but least accurate  Thiessen polygon method  Assumes linear variation  Use when gages are not uniformly distributed  Can use gages outside of watershed  Isohyetal method  Theoretically the most accurate  Most time consuming method  Can use gages outside of the watershed BITSEduCampusProf.AnkitPatel
  • 49.
    Test for consistencyrecord • Let a group of 5 to 10 base stations in the neighbourhood of the problem station X is selected • Arrange the data of X stn rainfall and the average of the neighbouring stations in reverse chronological order (from recent to old record) • Accumulate the precipitation of station X and the average values of the group base stations starting from the latest record. • Plot the against as shown on the next figure • A decided break in the slope of the resulting plot is observed that indicates a change in precipitation regime of station X, i.e inconsistency. • Therefore, is should be corrected by the factor shon on the next slide   xP   avgP  xP   avgP BITS Edu CampusProf. Ankit Patel
  • 50.
    (Double mass curvetechniques) Double Mass Curve Analysis 0 0.5 1 1.5 2 2.5 3 3.5 4 4.5 5 0 0.5 1 1.5 2 2.5 Accumulated annual rainfall of neigbouring stns in 10^3 cm accumulatedannualrainfallofXstnin10^3cm BITS Edu CampusProf. Ankit Patel
  • 51.
    a c M M a c  a c xcx M M PP  Pcx –corrected precipitation at any time period t1 at stationX Px – Original recorded precp. at time period t1 at station X Mc – corrected slope of the double mass curve Ma – original slope of the mass curve BITS Edu CampusProf. Ankit Patel
  • 52.
    A rainfall ata palce can be completely described if its intensity, duration and frequency are known. The intensity of rain is the rain at which it is falling. The duration is the time for which rainfall falling with the given intensity. Frequency is the number of times rainfall falls. A few commonly used methods are  Mass curve of rainfall  Hyetograph BITS Edu CampusProf. Ankit Patel
  • 53.
    Mass curve ofrainfall 0 10 20 30 40 50 60 0 20 40 60 80 100 120 Time, hour accumulatedprecipitation,mm Mass Curve of Rainfall: The total accumulated precipitation is plotted against time BITS Edu CampusProf. Ankit Patel
  • 54.
    Hyetograph of astorm 0 0.1 0.2 0.3 0.4 0.5 0 – 8 8 – 16 16 – 24 24 – 32 32 – 40 40 – 48 Time, hours Intensity,cm/hr Hyetograph -A hyetograph is a graphical representation of the relationship between the rainfall intensity and time BITS Edu CampusProf. Ankit Patel
  • 55.
  • 56.
     Evaporation isa process by which water is converted into gaseous state and is returned to the atmosphere as Vapour.  It is the process by which water in the liquid form transforms into vapour through the transfer of energy.  When water is converted from solid state to vapour state without passing through liquid state then it is called Sublimition.  Due to evaporation loss of water in the form of vapour from soil, snow, lakes, rivers, seas, reservoirs. EVAPORATION BITS Edu CampusProf. Ankit Patel
  • 57.
    • Rate ofevaporation dependent on • Rate of evaporation increase with increase of temperature as well as increase in wind velocity, but decrease with the increase in humidity as well as with increase of dissolved salts in water. • Further as open area of water and soil is more evaporation also more and vice versa. BITS Edu CampusProf. Ankit Patel
  • 58.
     John daltonwas first scientist to describe the process of evaporation scientifically. Evaporation rate varies directly with difference of vapour pressure between air and water. E= C (ew – ea) where, E= rate of evaporation (mm/day) ew &ea=vapour pressure in water and in air. C = constant This equation is called john dalton’s law of evaporation. Dalton’s law of Evaporation BITS Edu CampusProf. Ankit Patel
  • 59.
    i. The vapourpressure at the water surface and air above ii. Air and water temperatures iii. Wind speed iv. Atmospheric pressure v. Quality of water vi. Size of water body vii. Depth of water in the water body viii. Humidity ix. Radiation Factor affecting evaporation BITS Edu CampusProf. Ankit Patel
  • 60.
    1. Empirical formulae 2.Water budget method 3. Energy budget method 4. Mass transfer method 5. Actual observations 6. Pan observations Measurement of Evaporation BITS Edu CampusProf. Ankit Patel
  • 61.
     Transpiration isthe process by which water leaves the water body of a living plants and reaches the atmosphere as water vapour. The water is taken up by the plant root system and escape through the leaves.  The soil water used by crops is through the process of evaporation. This loss of water in combined form of evaporation and transpiration is called EVAPOTRANSPIRATION (ET). Water use by evapotranspiration is known as consumptive use of crops.  Evapotranspiration of water by a crop is the depth of water consumed by evaporation and transpiration during crop growth. EVAPOTRANSPIRATION BITS Edu CampusProf. Ankit Patel
  • 62.
     When consumptiveuse of crop is known, the water use of large unit can be calculated.  Consumptive use of for each crop is can be determined which gives water requirement of crop. The value of consumptive use of water varies from crop to crop and also for the same crop it varies with time as well as place.  Detailed study of evapotranspiration is essential in in the design of reservoir, irrigation canals, water balance on earth surface and projects relating to water. BITS Edu CampusProf. Ankit Patel
  • 63.
     Factors affectingevapotranspiration are same that affect evaporation and transpiration. Some of the factor are as follows. 1. Metrological factors : potential evapotranspiration is controlled essentially in metrological factor. Evapotranspiration increase as temperature, sunshine, and wind velocity increase but decrease as the humidity decrease. 2. Plant and soil factors:  Evapotranspiration is less if adjoining land is cropped because air becomes cool and more humid. Factor affecting Evapotranspiration BITS Edu CampusProf. Ankit Patel
  • 64.
    1) Direct measurementof consumptive use of water: a) Tank or lysimeter method b) Field experimental plots c)soil moisture studies d)Integration method e)Inflow and outflow method 2) Use of Empirical Formulae : a) Blaney – Criddle equation b) Thornthwaite equation c) Christiansen equation Measurement of Evapotranspiration or Consumptive use of water BITS Edu CampusProf. Ankit Patel
  • 65.
     INFILTRATION:  Waterentering the soil at the ground surface is called infiltration. It replenishes the soil moisture deficiency and the excess moves downward by the force of gravity called deep seepage or  percolation and builds up the ground water table. The maximum rate at which the soil in any given condition is capable of absorbing water is called its infiltration capacity (fp).  Infiltration (f) often begins at a high rate (20 to 25 cm/hr) and decreases to a fairly steady state rate (fc) as the rain continues, called the ultimate fp (= 1.25 to 2.0 cm/hr) (Fig. 3.6). The infiltration rate (f) at any time t is given by Horton’s equation. BITS Edu CampusProf. Ankit Patel
  • 66.
  • 67.
  • 68.
     The infiltrationtakes place at capacity rates only when the intensity of rainfall equals or exceeds fp; i.e., f = fp when i ≥ fp; but when i < fp, f < fp and the actual infiltration rates are approximately equal to the rainfall rates.  The infiltration depends upon the intensity and duration of rainfall, weather (temperature), soil characteristics, vegetal cover, land use, initial soil moisture content (initial wet- ness), entrapped air and depth of the ground water table. The vegetal cover provides protection against rain drop impact and helps to increase infiltration. BITS Edu CampusProf. Ankit Patel
  • 69.
     The downwardflow of water from the land surface into the soil medium is called infiltration.  The part of precipitation that is not available as surface runoff is referred as precipitation loss or abstraction. Infiltration is a dominant abstraction.  Infiltration first replenishes the soil moisture deficiency, the excess water moves downward by force of gravity. This downward movement under gravity is called percolation (seepage).  The rate at with water enters the ground surface and then flow downwards is known as infiltration rate. INFILTRATION BITS Edu CampusProf. Ankit Patel
  • 70.
     Infiltration rateis higher in the beginning because it has to meet the requirement of dry soil. It attains steady constant value as passage of time.  Infiltration rate is used for computation of water loss due to infiltration for the determination of surface runoff.  Unit of infiltration rate is mm/hour.  Maximum rate at which soil in any given condition is capable of absorbing water is called its infiltration capacity(f).  Infiltration has great influence on rainfall, runoff, transpiration of plants and evaporation from soil surface.  Infiltration is responsible for subsurface flow and ground water flow. BITS Edu CampusProf. Ankit Patel
  • 71.
    1. Soil moisture 2.Intensity of rainfall 3. Temperature 4. Duration of the rainfall 5. Texture of soil 6. Vegetal cover 7. Condition of soil surface 8. Compaction of soil 9. Depth of surface detention Factor affecting Infiltration BITS Edu CampusProf. Ankit Patel
  • 72.
     Infiltration capacityof soil does not remain constant, it decrease with an increase of duration of rainfall.  In hydrological computations for computing surface runoff and flood discharge, use an average constant value of infiltration rate called infiltration index. Infiltration Indices BITS Edu CampusProf. Ankit Patel
  • 73.
     Figure issuperimposition of a rainfall hyetograph and infiltration rate curve appropriate to the soil of catchment.  The area of hyetograph above infiltration curve represent the surface runoff and that of below represent the infiltration.  If the rainfall intensity is always greater than the infiltration rate, results are satisfactory, but if rainfall fluctuate above and below the problems becomes complicated. In this case is assumed to be constant(average infiltration) throughout the rainfall time.  Infiltration indices are extremely useful for the analysis of major floods when the soil is wet and infiltration rate becomes constant. BITS Edu CampusProf. Ankit Patel
  • 74.
    1. Ø-index (phi-index) 2.W-index (dablu-index) 3. Wmin.-index. Types of infiltration indices BITS Edu CampusProf. Ankit Patel
  • 75.
    (i) φ-index—The φ-indexis defined as that rate of rainfall above which the rainfall volume equals the runoff volume. The φ-index is relatively simple and all losses due to infiltration, interception and depression storage (i.e., storage in pits and ponds) are accounted for; hence, φ-index = P-Q Where p = Precipitation Q= Surface runoff provided i > φ throughout the storm. The bar graph showing the time distribution of rainfall, storm loss and rainfall excess (net rain or storm runoff) is called a hyetograph, Fig. 3.12. Thus, the φ- index divides the rainfall into net rain and storm loss. BITS Edu CampusProf. Ankit Patel
  • 76.
  • 77.
    (ii) W-index—The W-indexis the average infiltration rate during the time rainfall intensity exceeds the infiltration capacity rate, i.e., BITS Edu CampusProf. Ankit Patel
  • 78.
    The W-index attemptsto allow for depression storage, short rainless periods during a storm and eliminates all rain periods during which i < fp. Thus, the W-index is essentially equal to the φ-index minus the average rate of retention by interception and depression storage, i.e., W < φ. (iii) Wmin-index—In this method, an average infiltration loss is assumed throughout the storm, for the period i > f. BITS Edu CampusProf. Ankit Patel
  • 79.
    Measurement Of Infiltration (1)Flooding type – simple and double ring type infiltrometers (as shown in below Figure) and (2) Rainfall simulator. BITS Edu CampusProf. Ankit Patel
  • 80.
     The ringinfiltrometer is a simple device used to measure the infiltration capacity of a soil. An open cylindrical ring is forced a few centimeters into the soil and filled with water. By measuring the rate at which the level of ponded water decreases, one can obtain an estimate of the infiltration capacity as a function of time. In simple/single ring infiltrometer infiltrated water spreads out in outer adjoining area leading to over-estimation.  In double ring type the outer ring provides water jacket to the infiltrating water from the inner ring and hence prevents the spreading out of the infiltrating water from the inner ring. The water depths in both rings are kept the same during the observation period. Because of high spatial variability, several measurements must be taken to get a reasonable estimate of the infiltration capacity of a soil. BITS Edu CampusProf. Ankit Patel
  • 81.
  • 82.
    Thank You BITS EduCampusProf. Ankit Patel