Downloaded 126 times
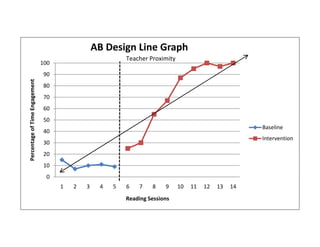
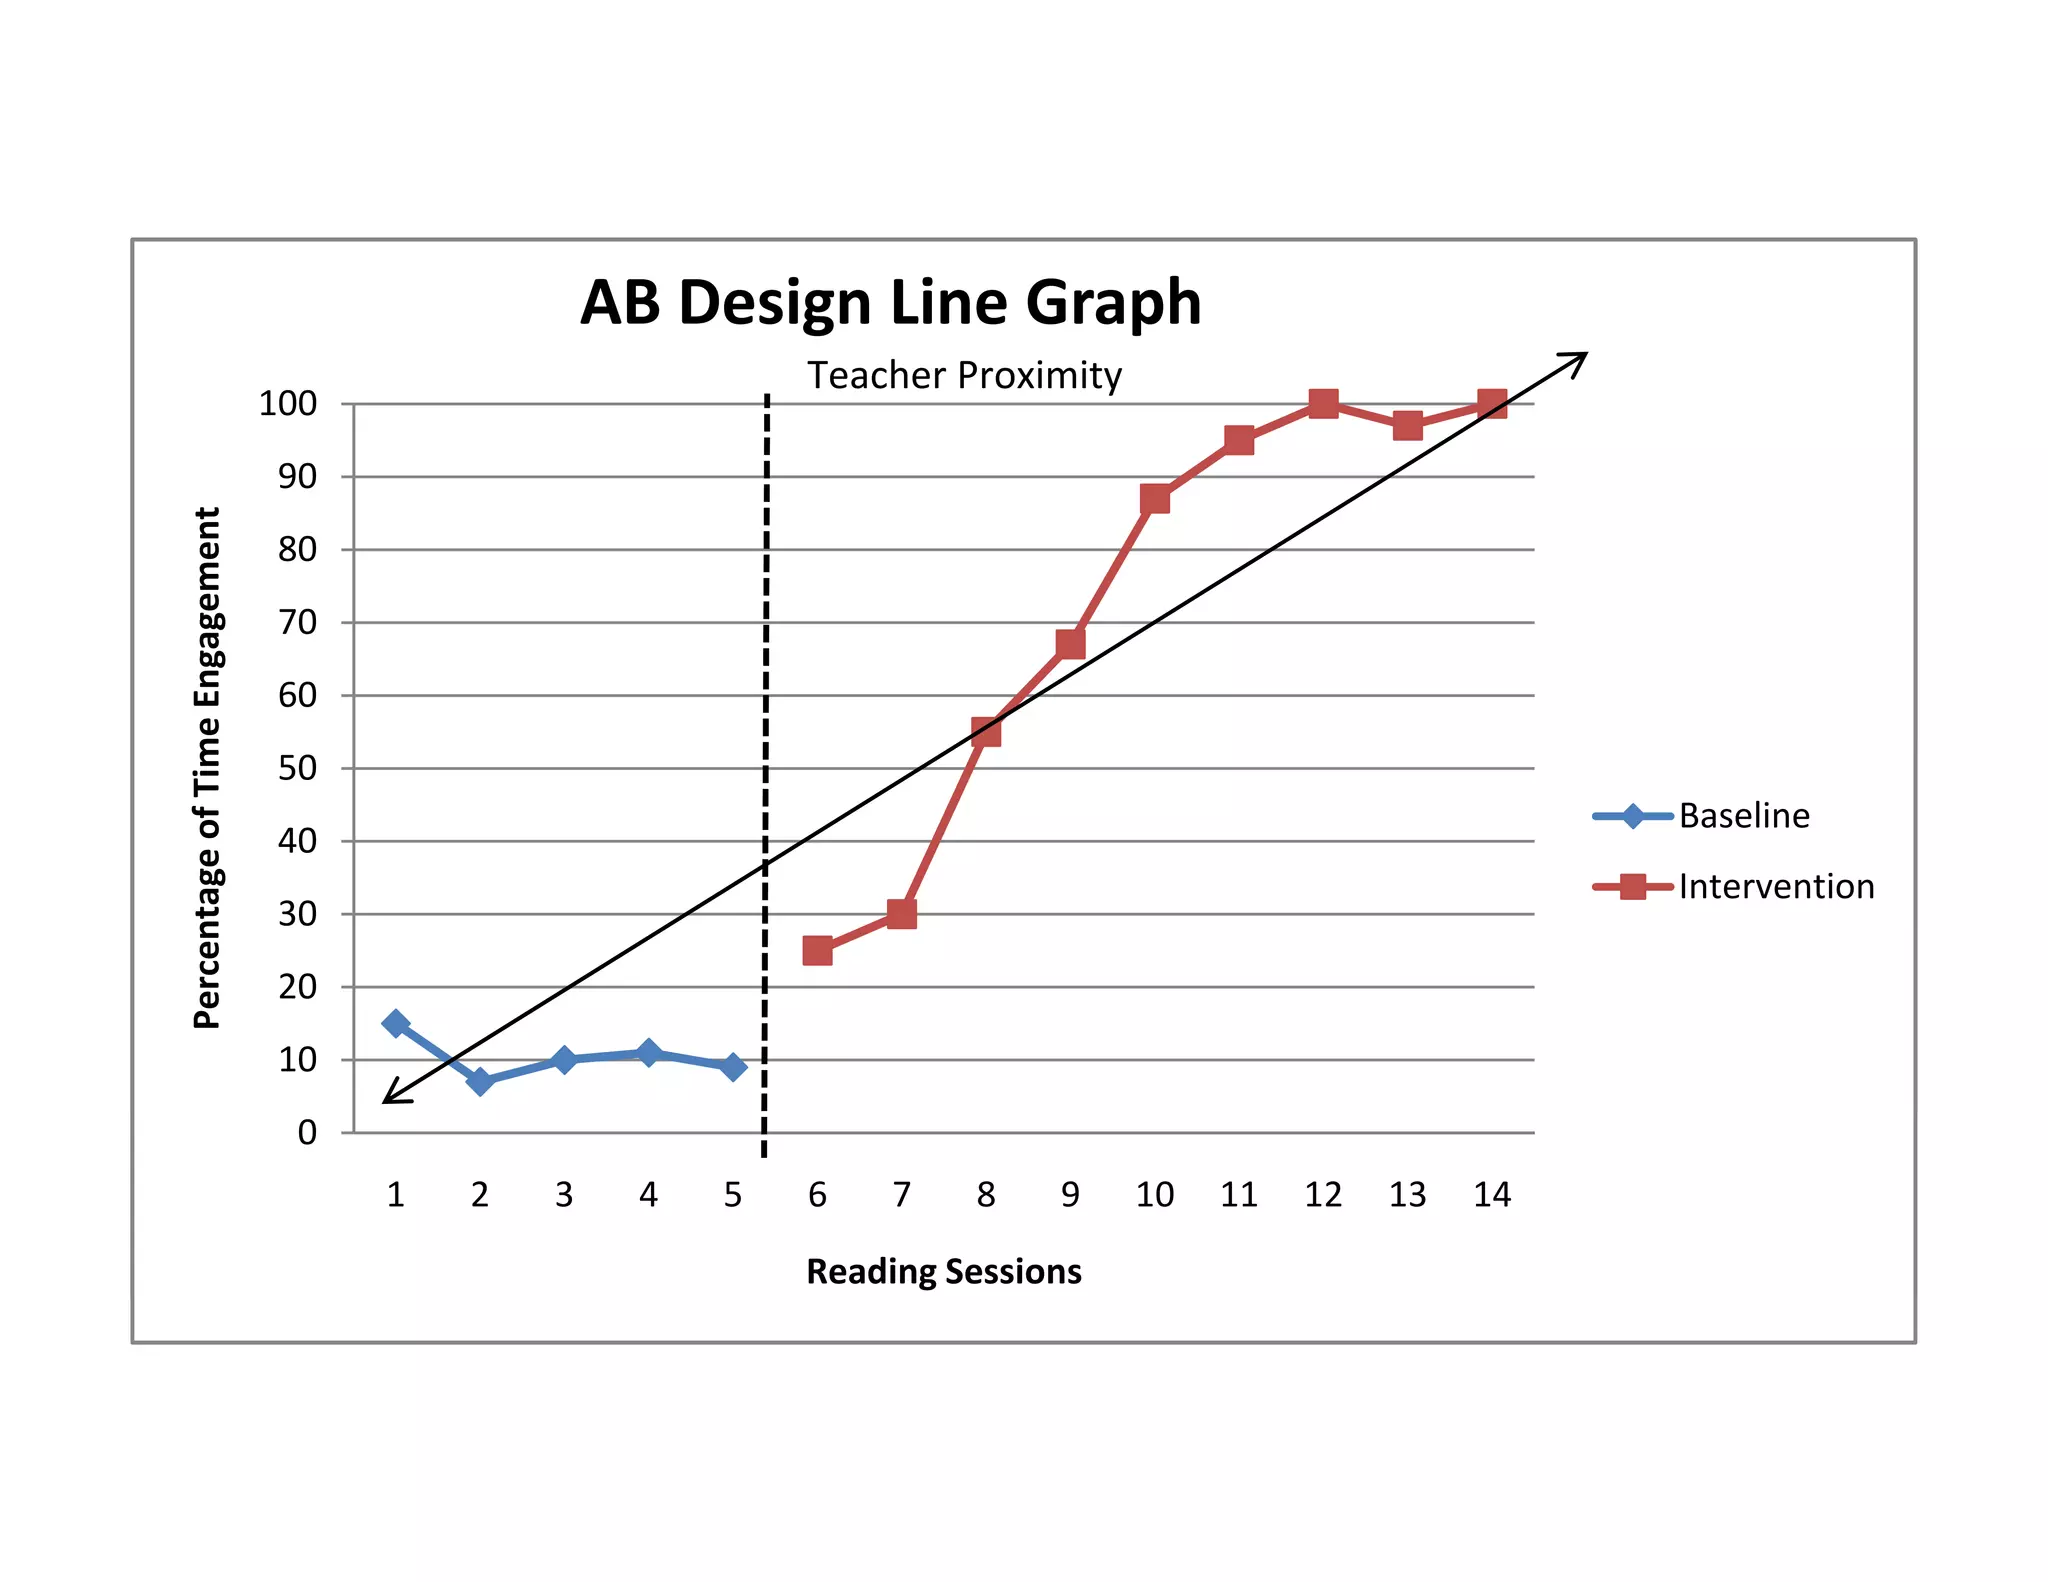
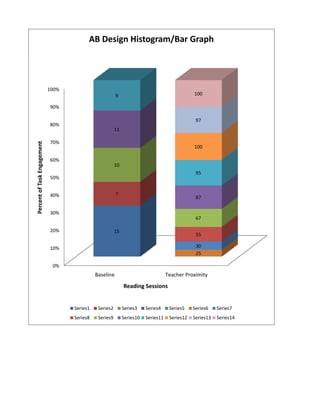
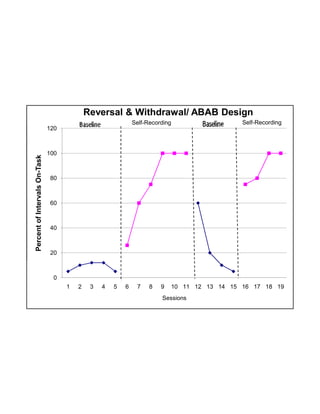
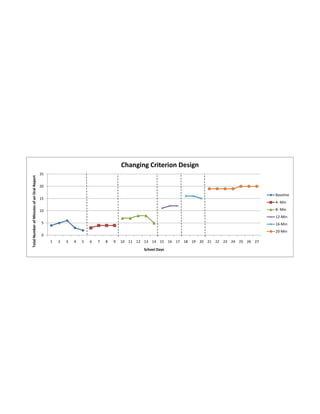
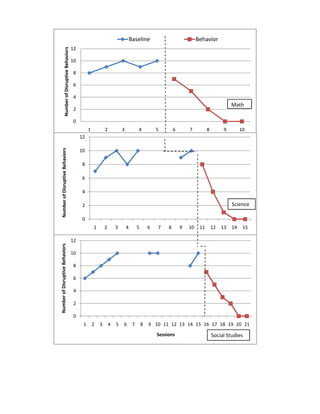
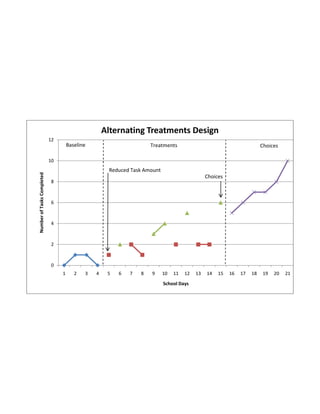
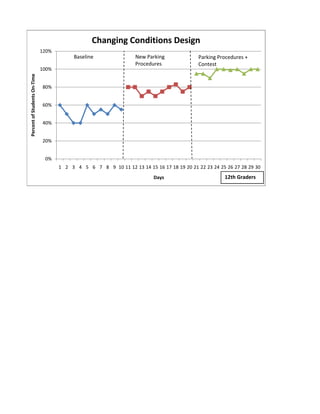

1) The document contains graphs and visual depictions of data from several single-subject experimental designs that were used to evaluate the impact of behavioral interventions on student engagement, disruptive behaviors, and other outcomes. 2) The graphs show data on the effects of interventions like increased teacher proximity, self-monitoring, reduced task amounts, new parking procedures, and contests on variables like student engagement, time on task, disruptive behaviors, and being on-time to school. 3) The designs include AB, ABC, and multielement/alternating treatments designs to evaluate baseline and intervention conditions across academic subjects, time periods, and participant groups.


![Raymond cattell [autosaved]](https://cdn.slidesharecdn.com/ss_thumbnails/raymondcattellautosaved-190113045031-thumbnail.jpg?width=640&height=640&fit=bounds)