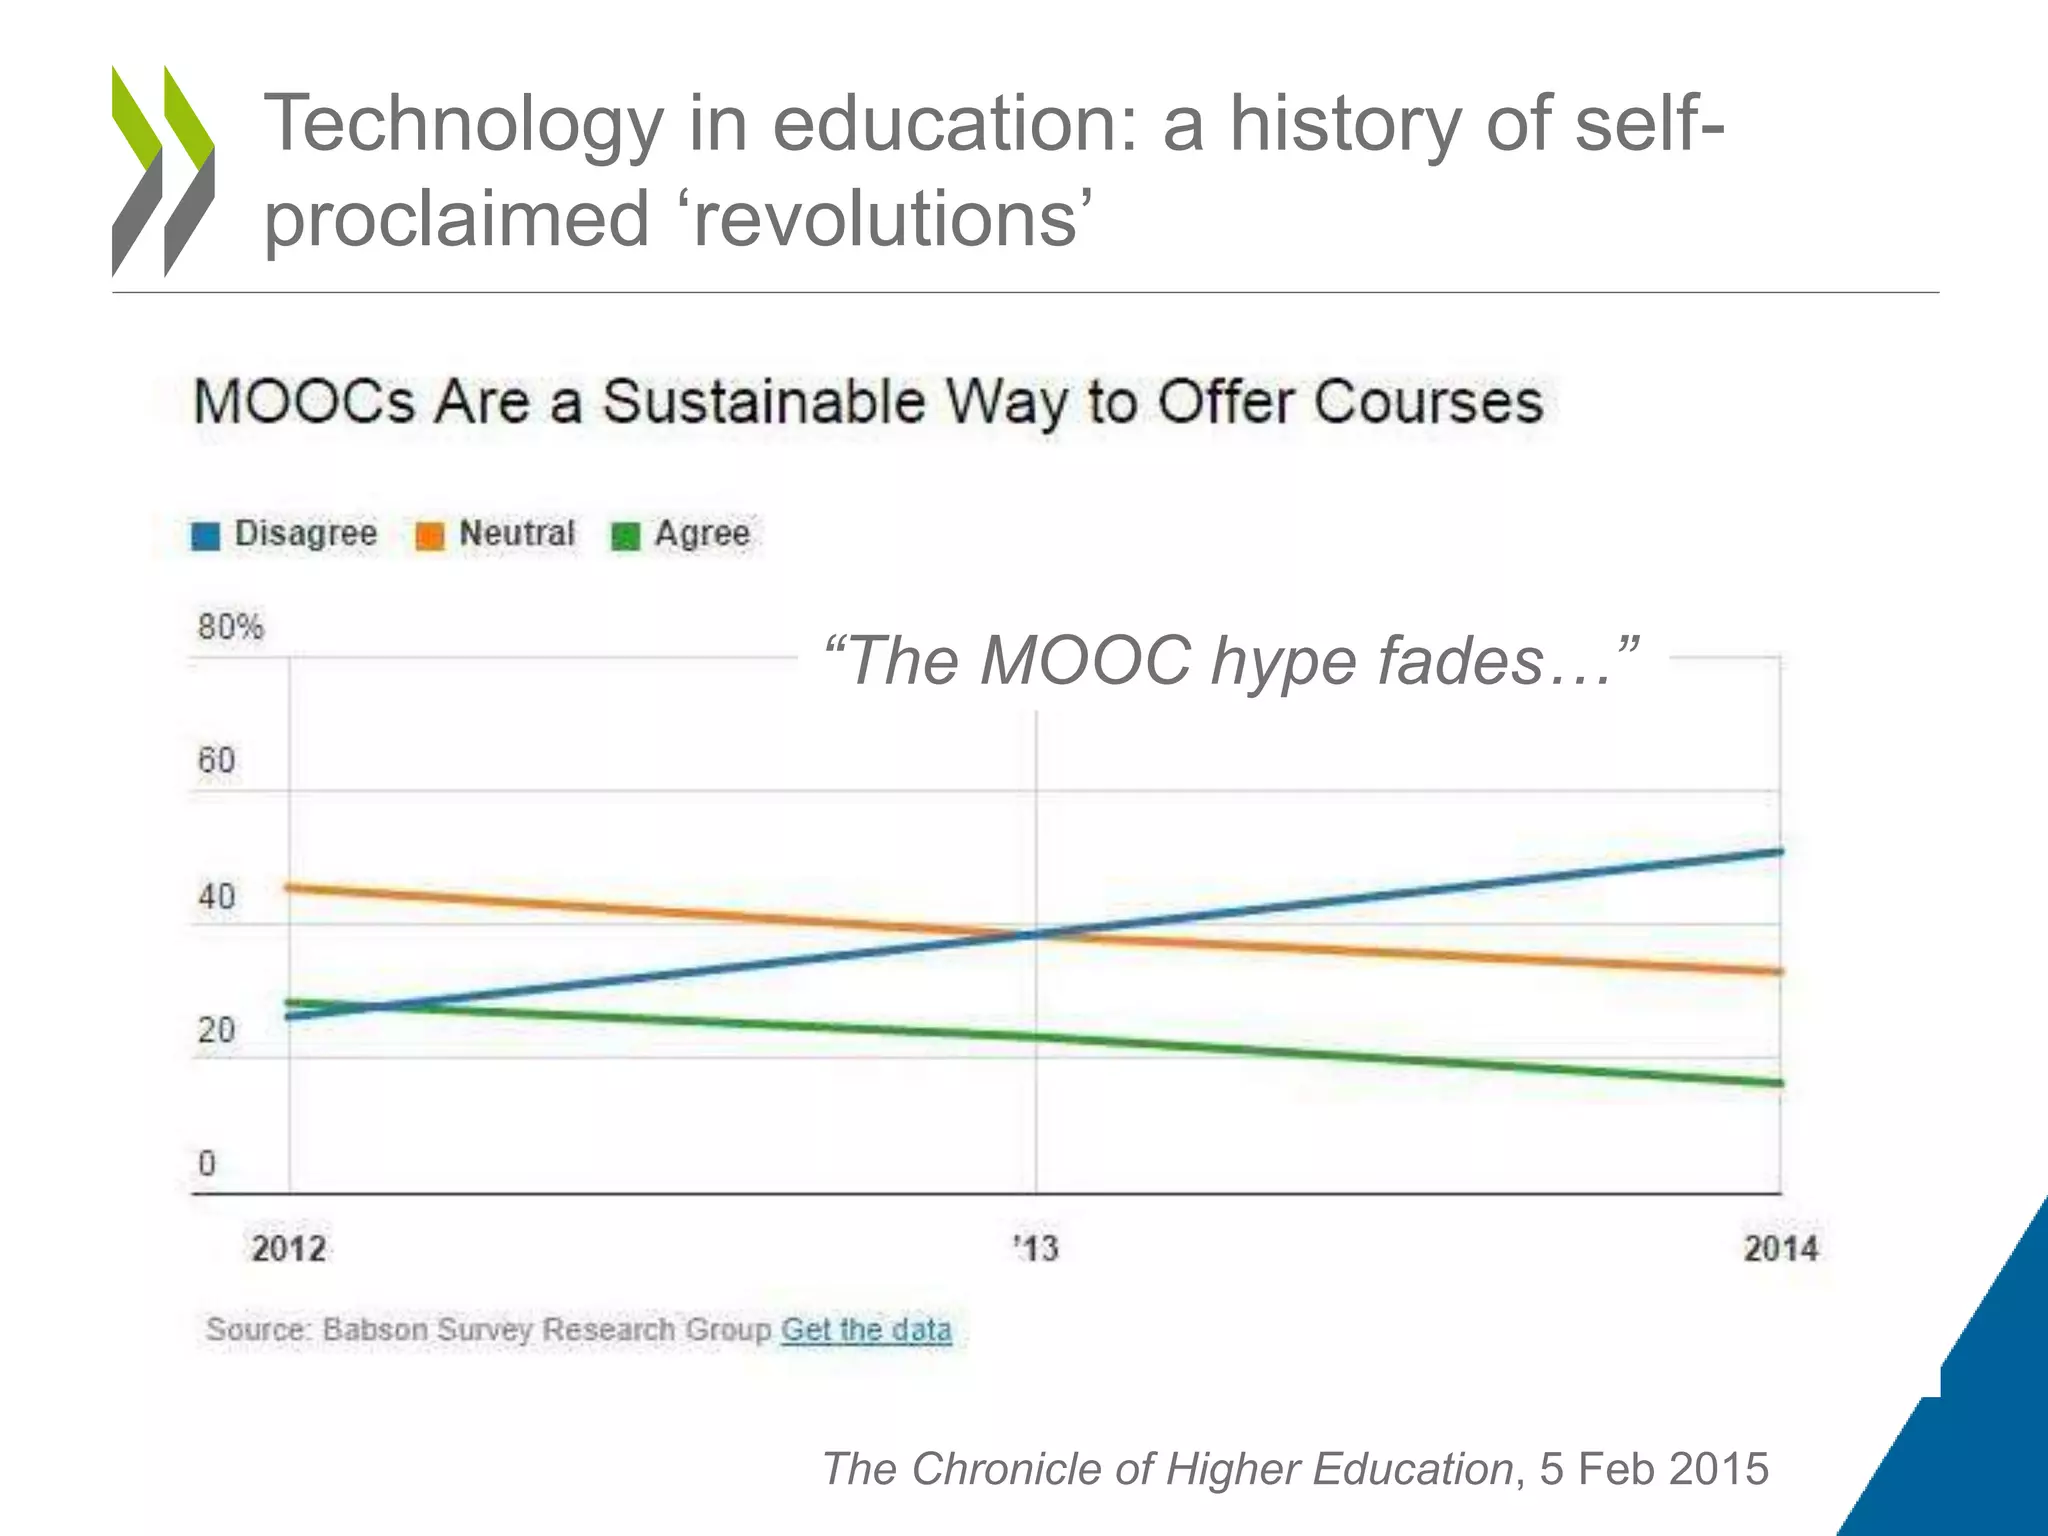
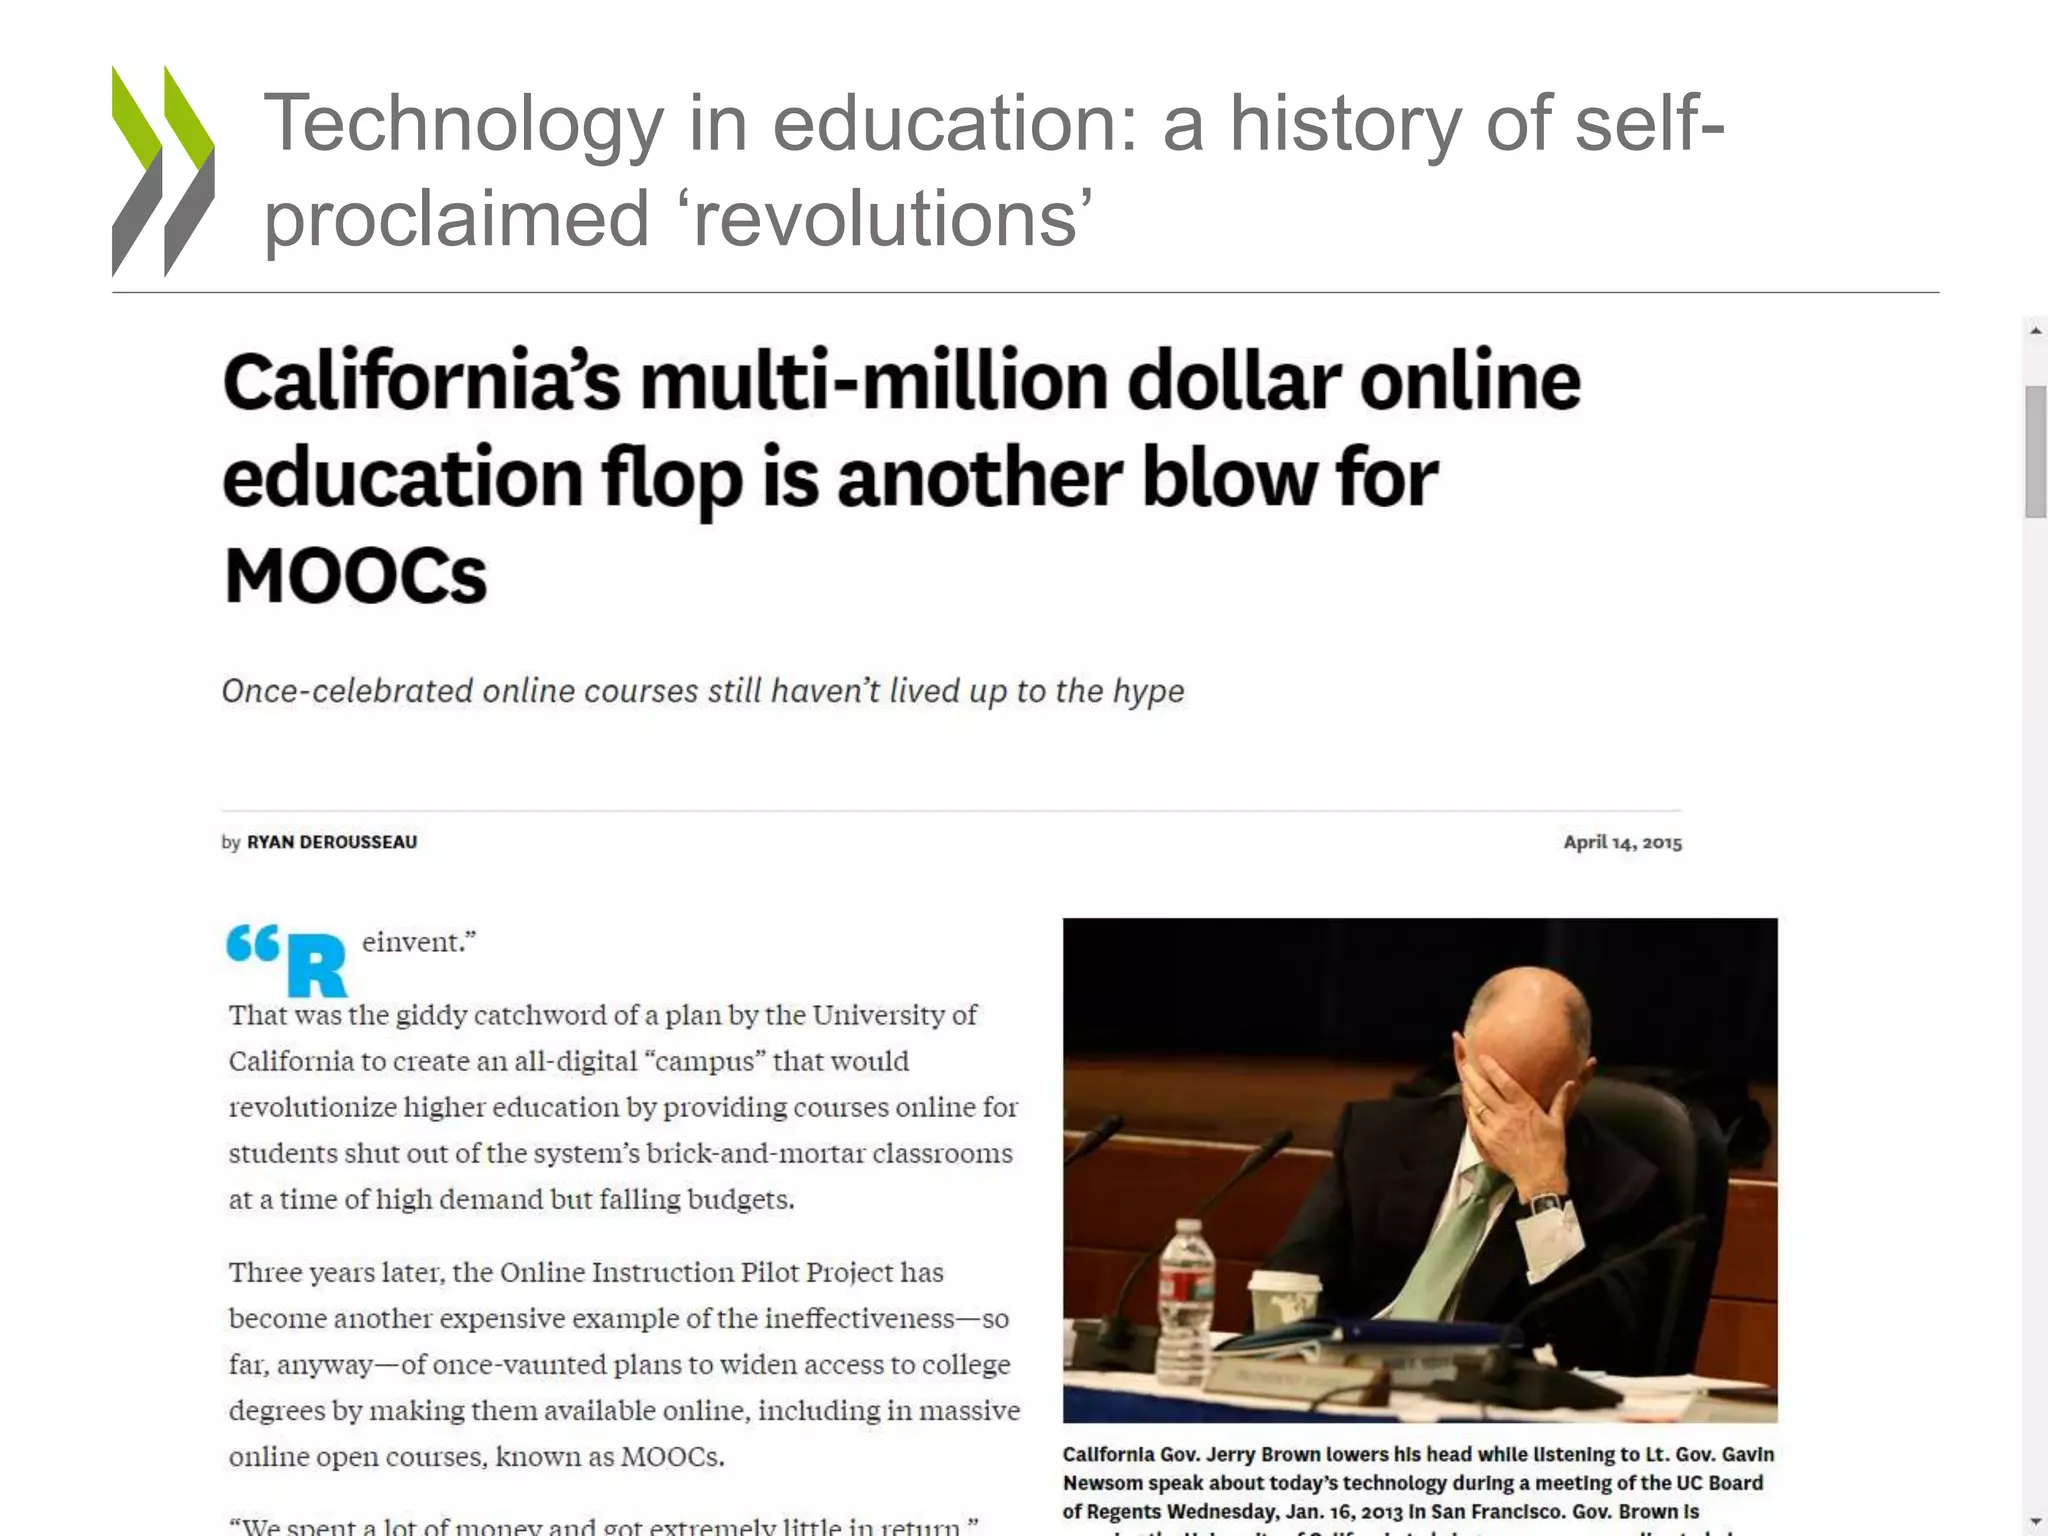
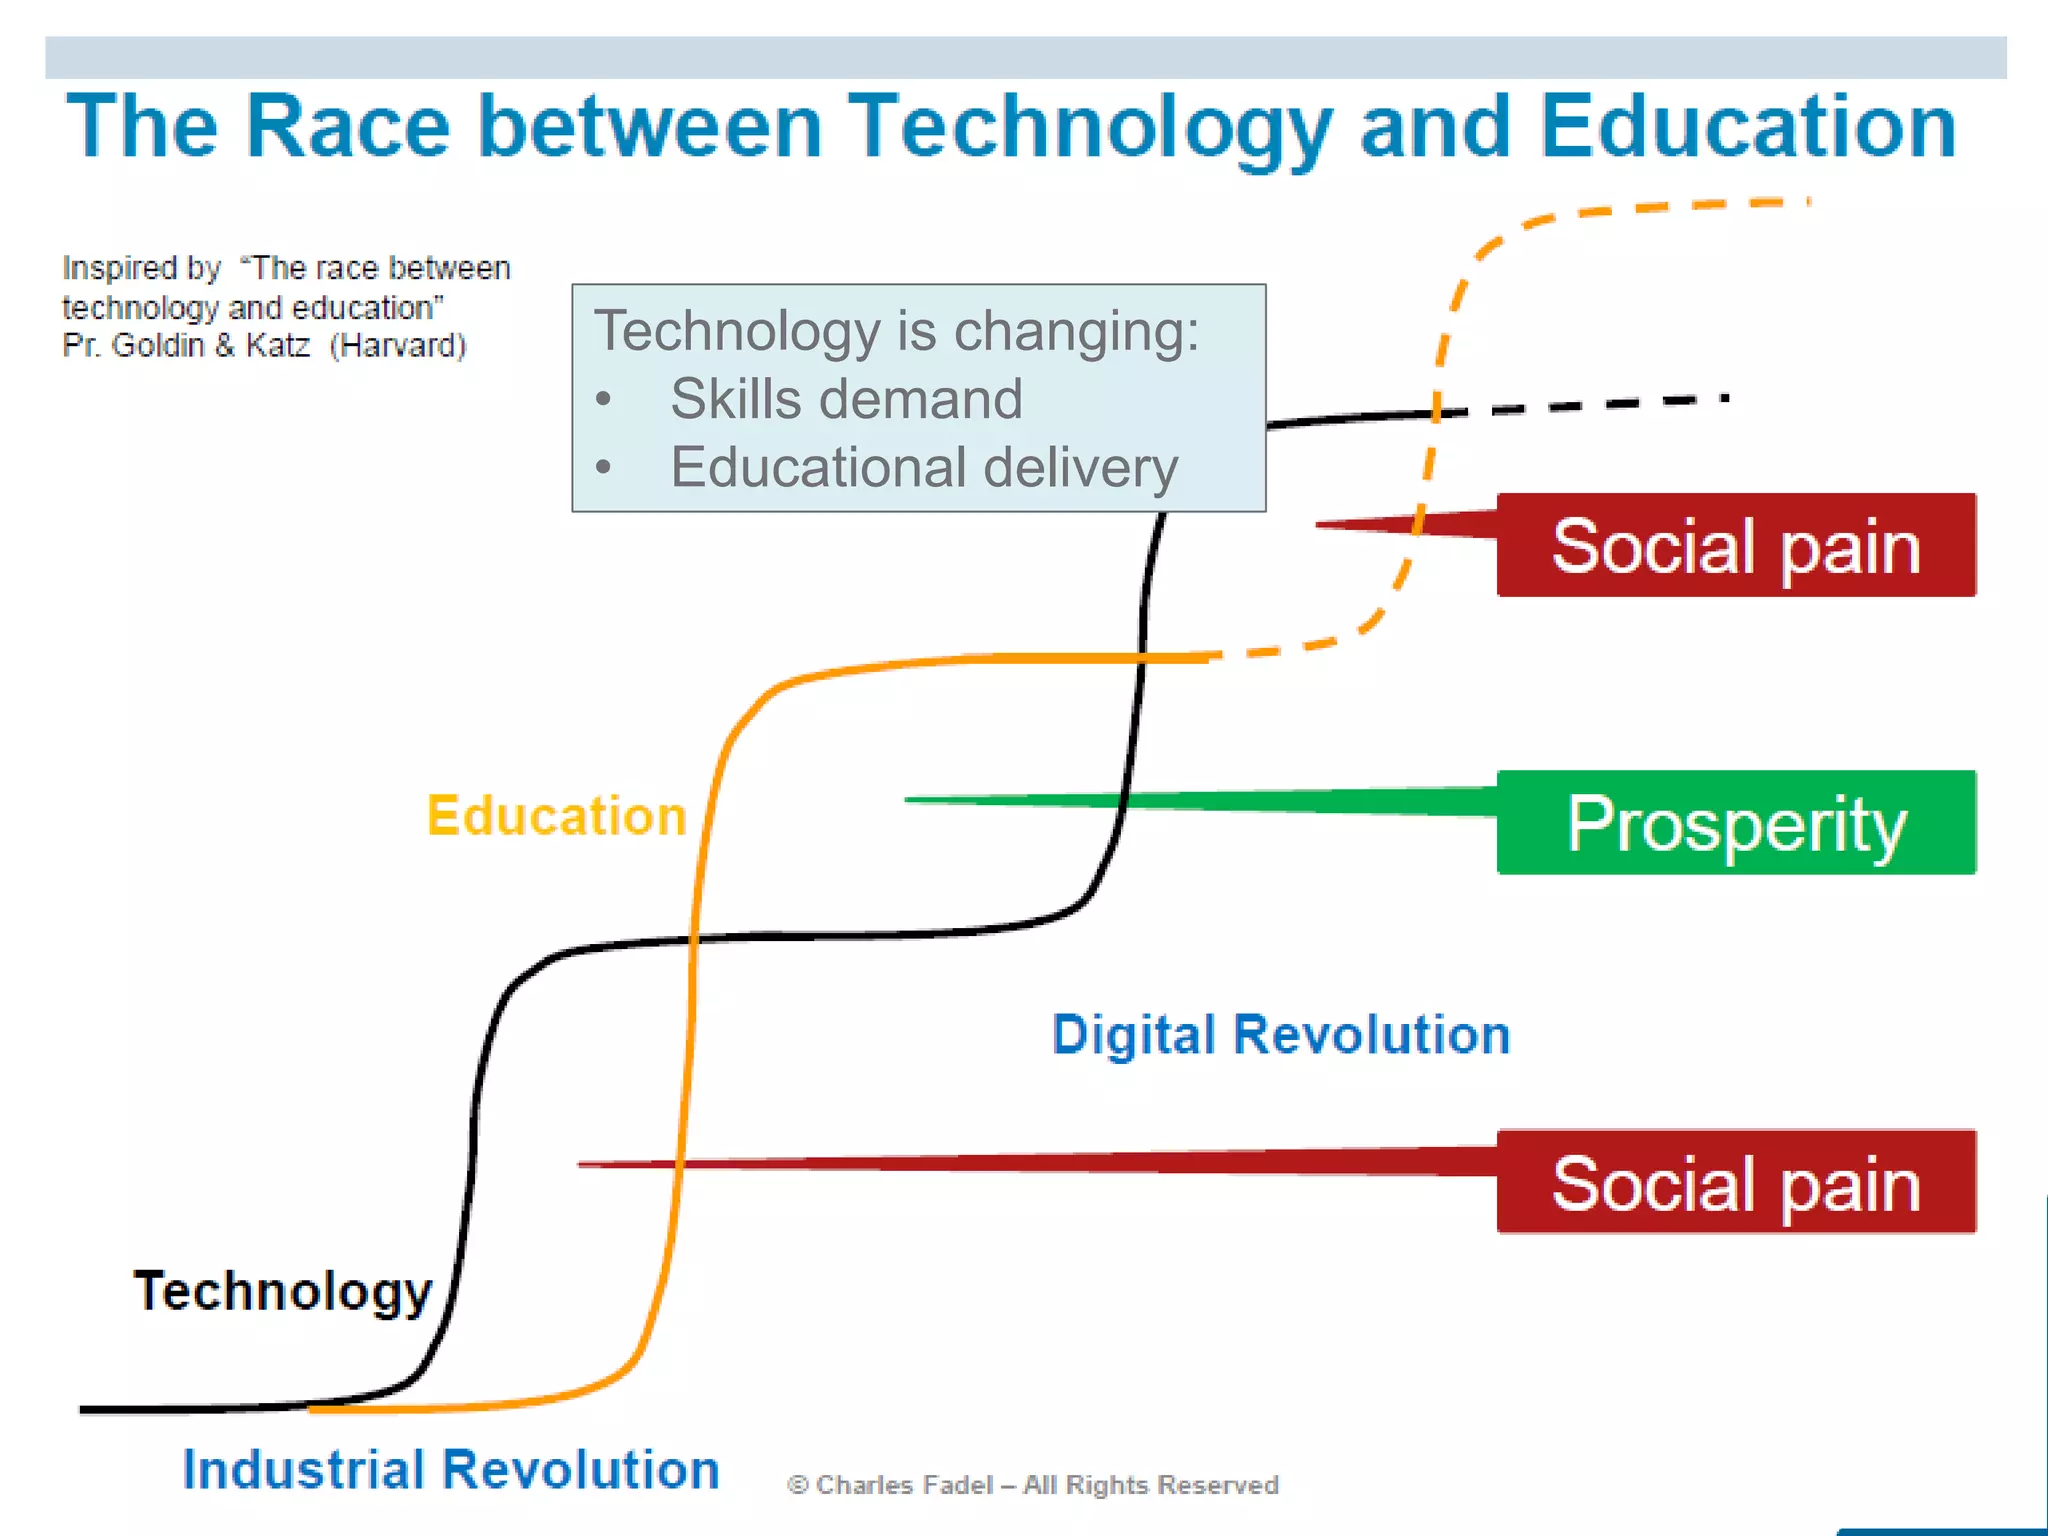
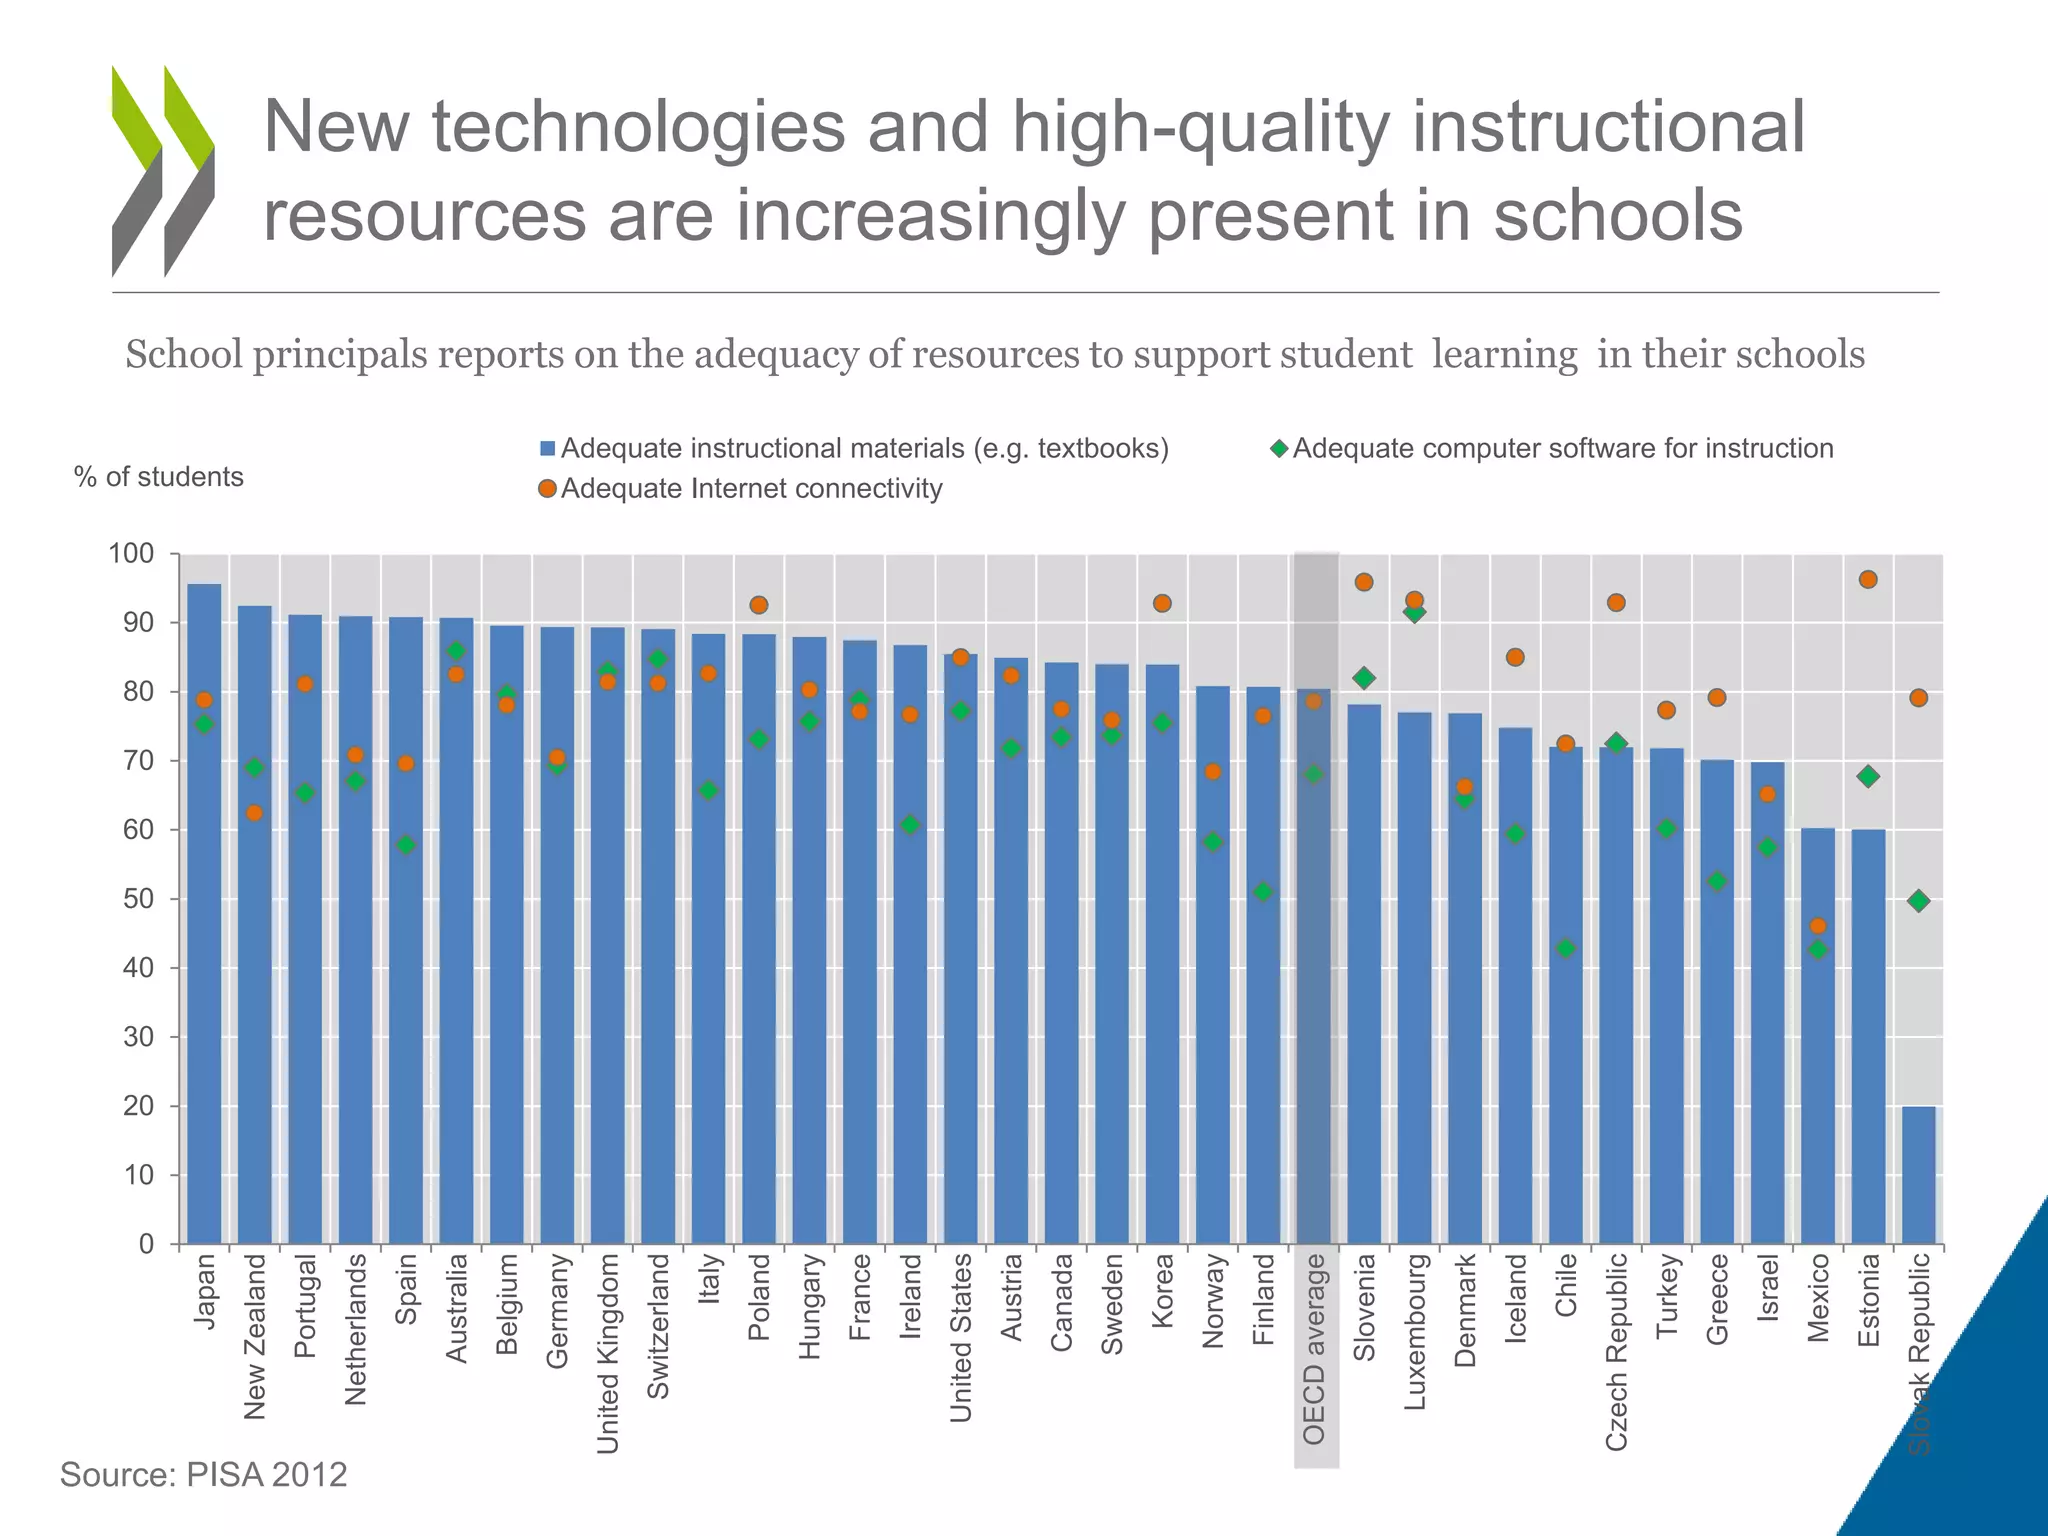
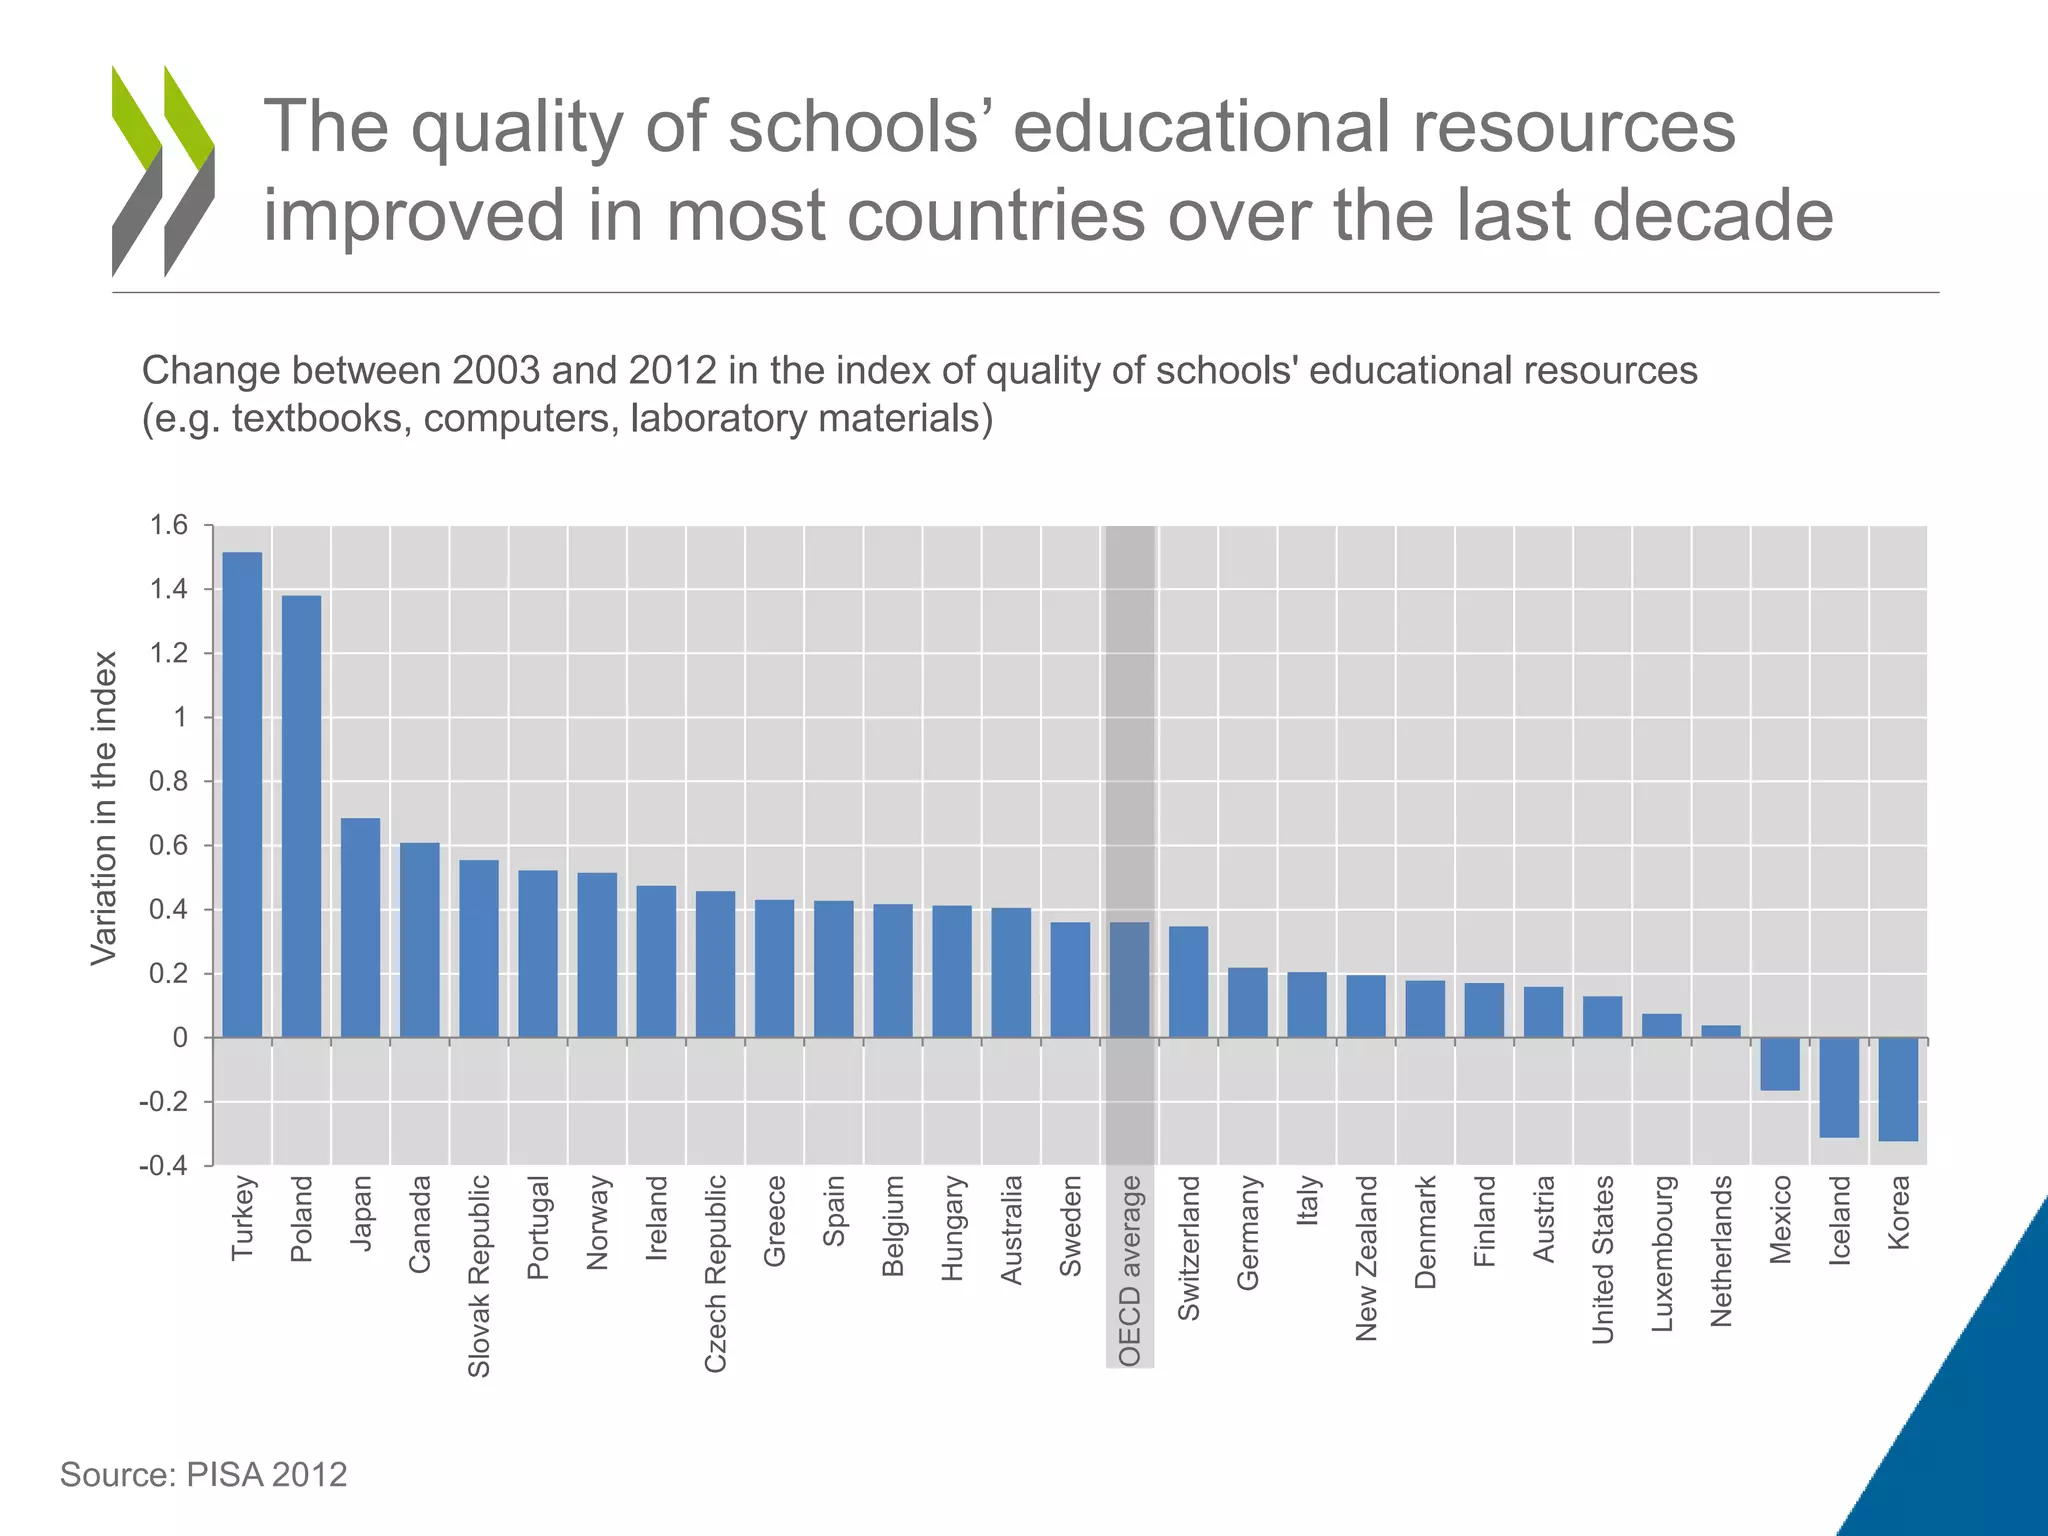
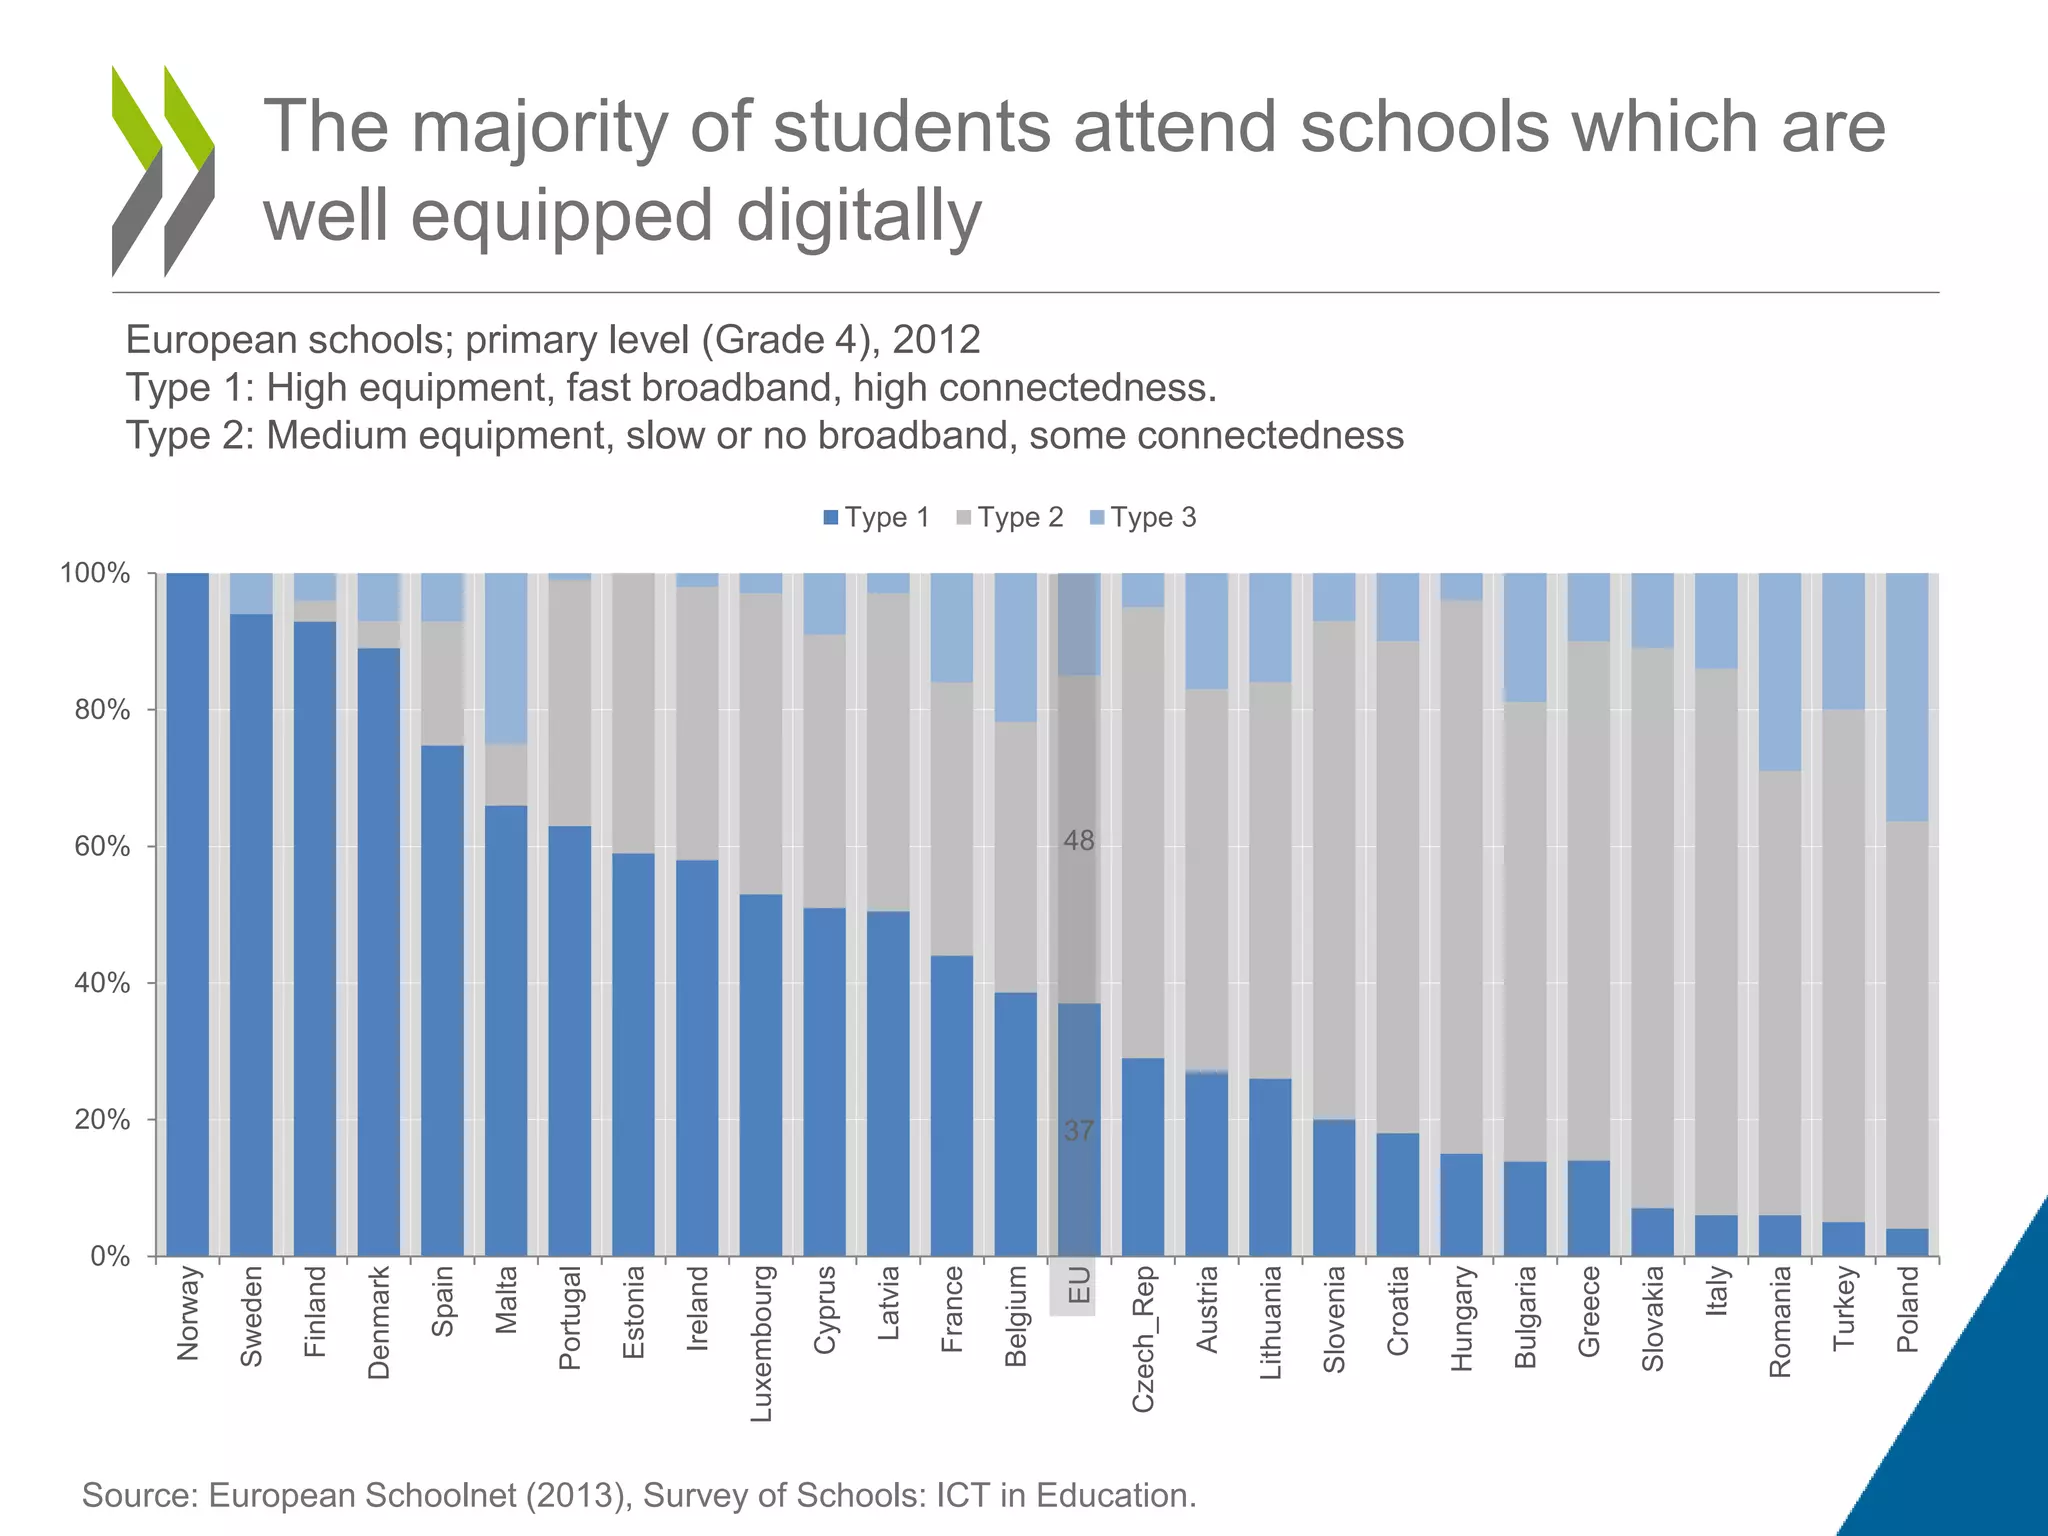
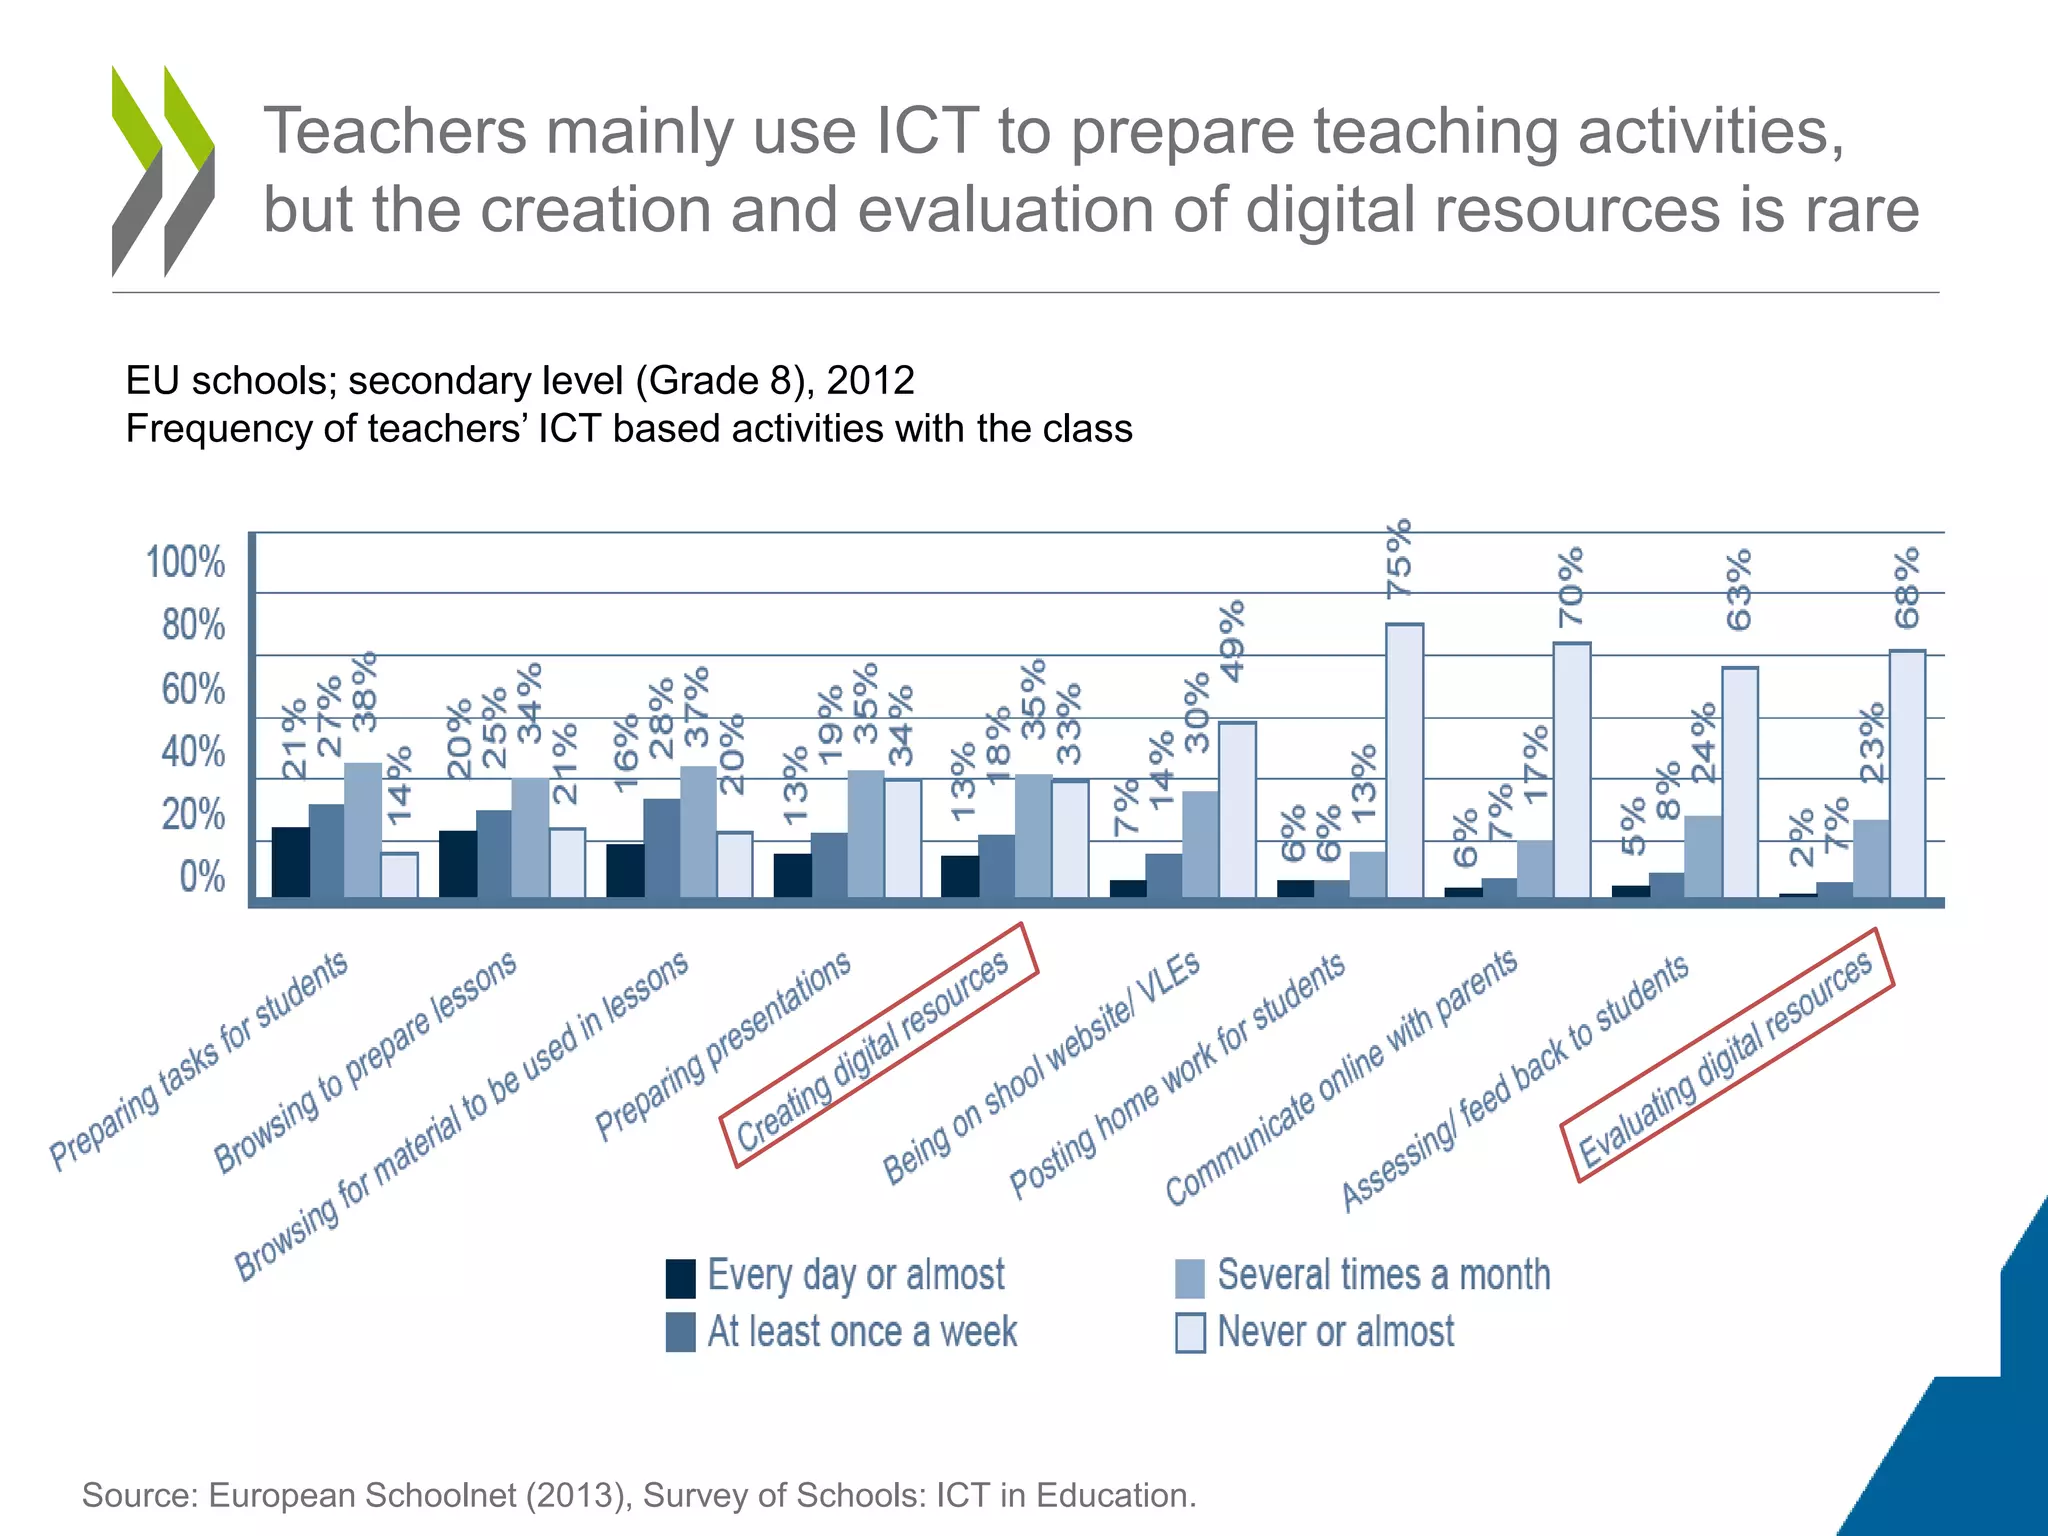
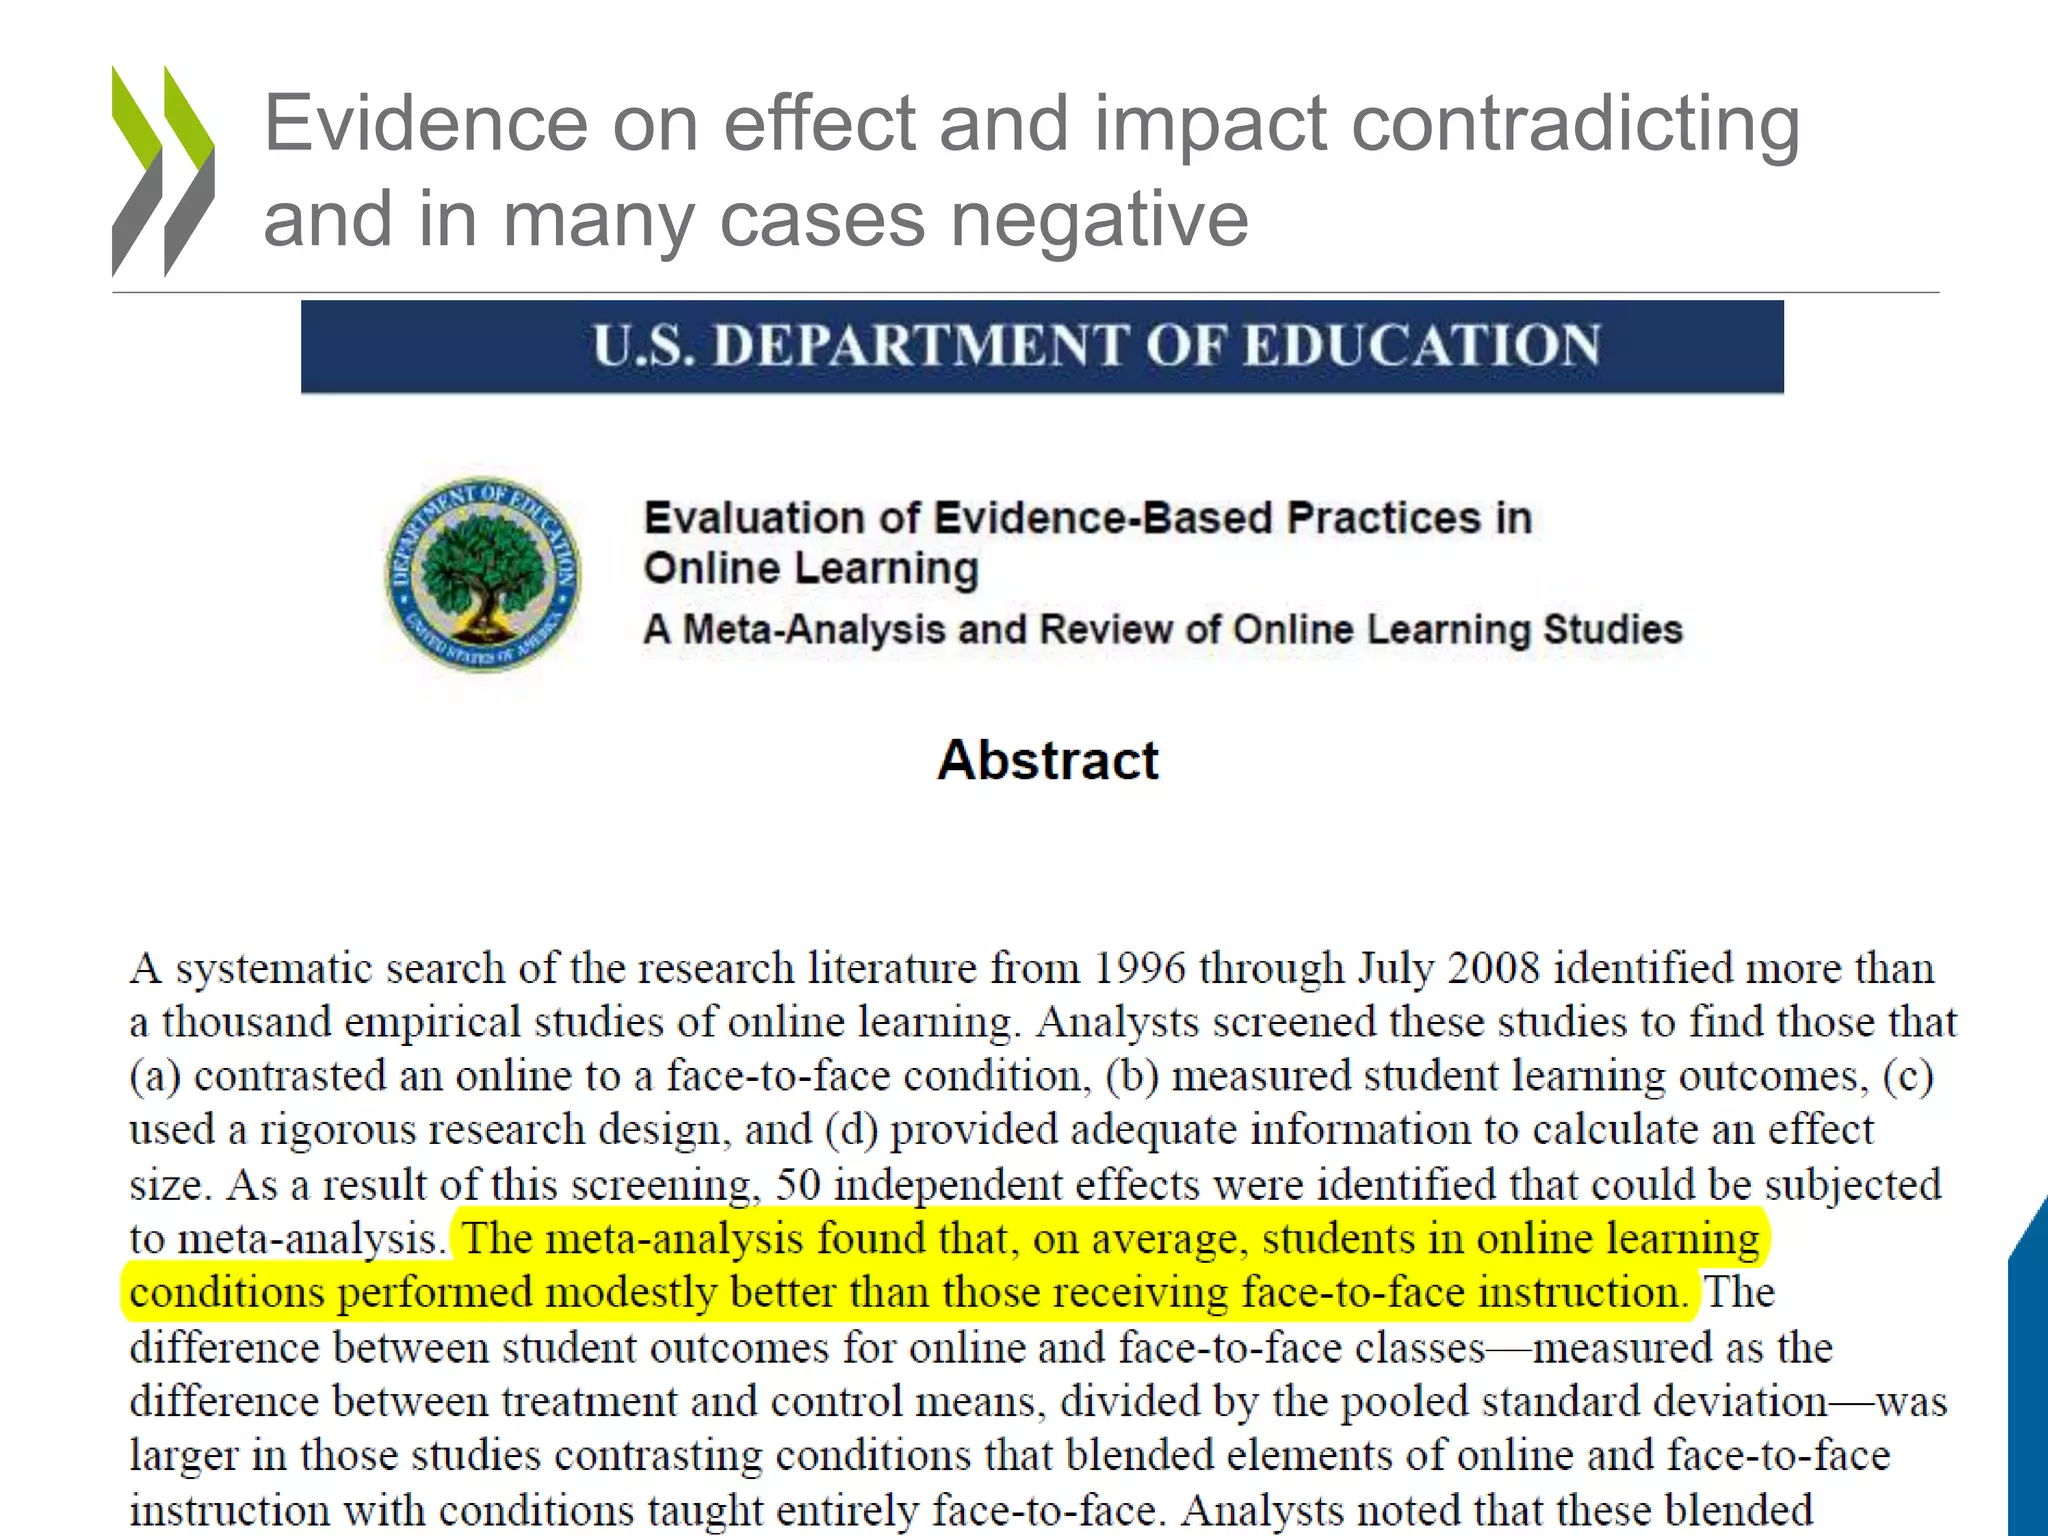
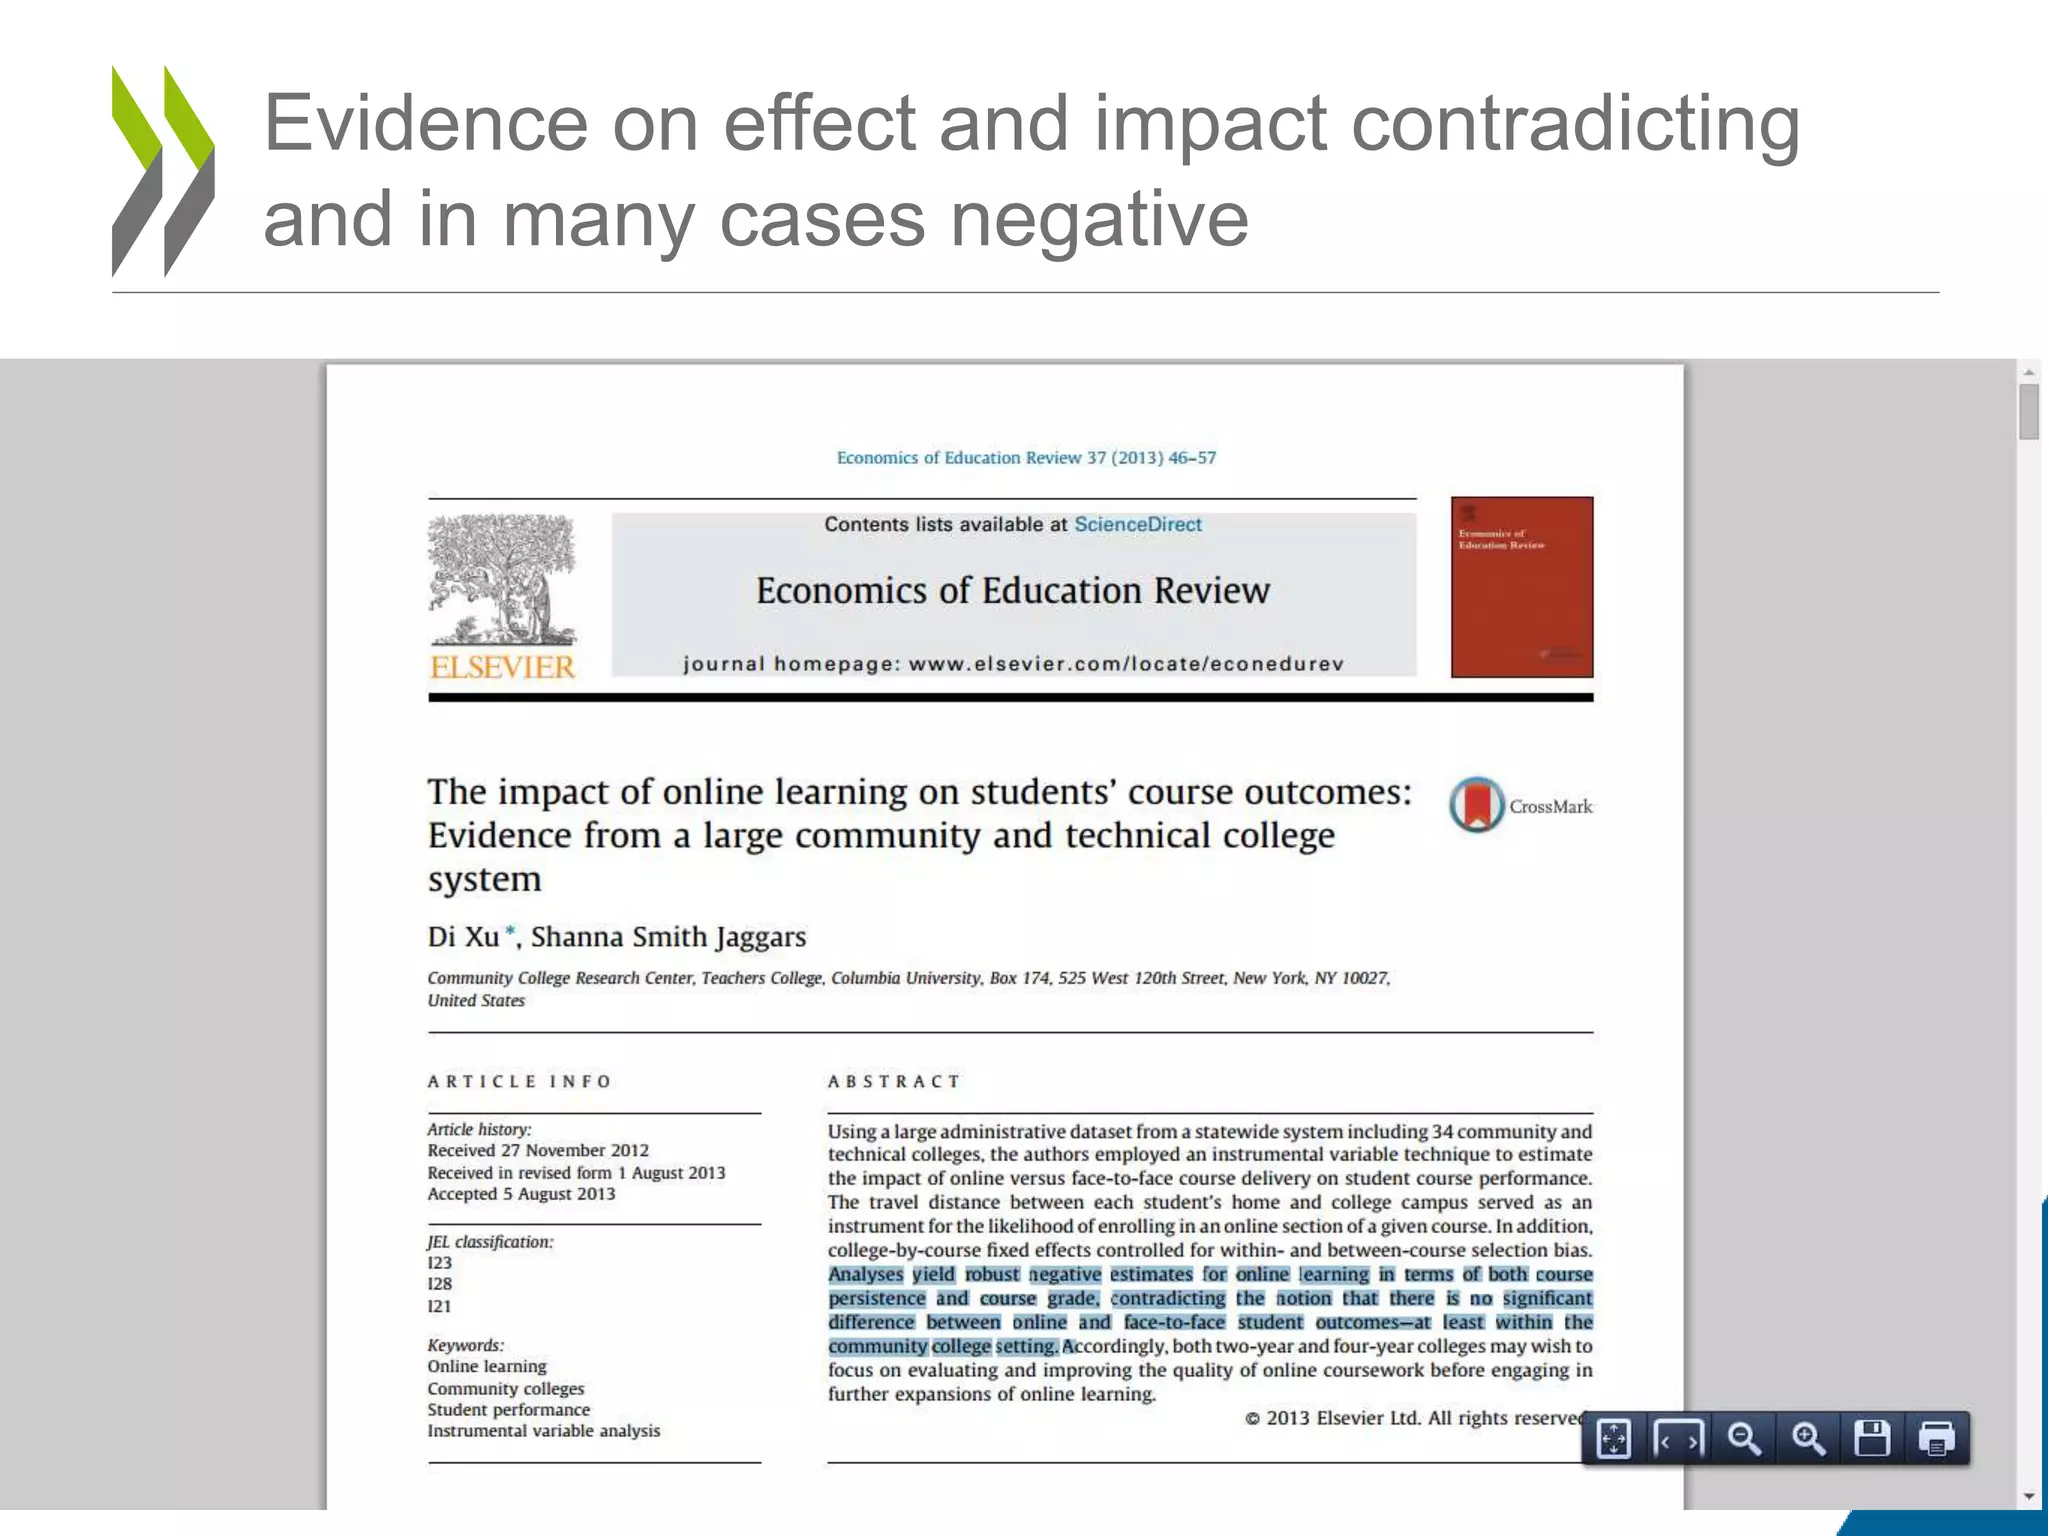
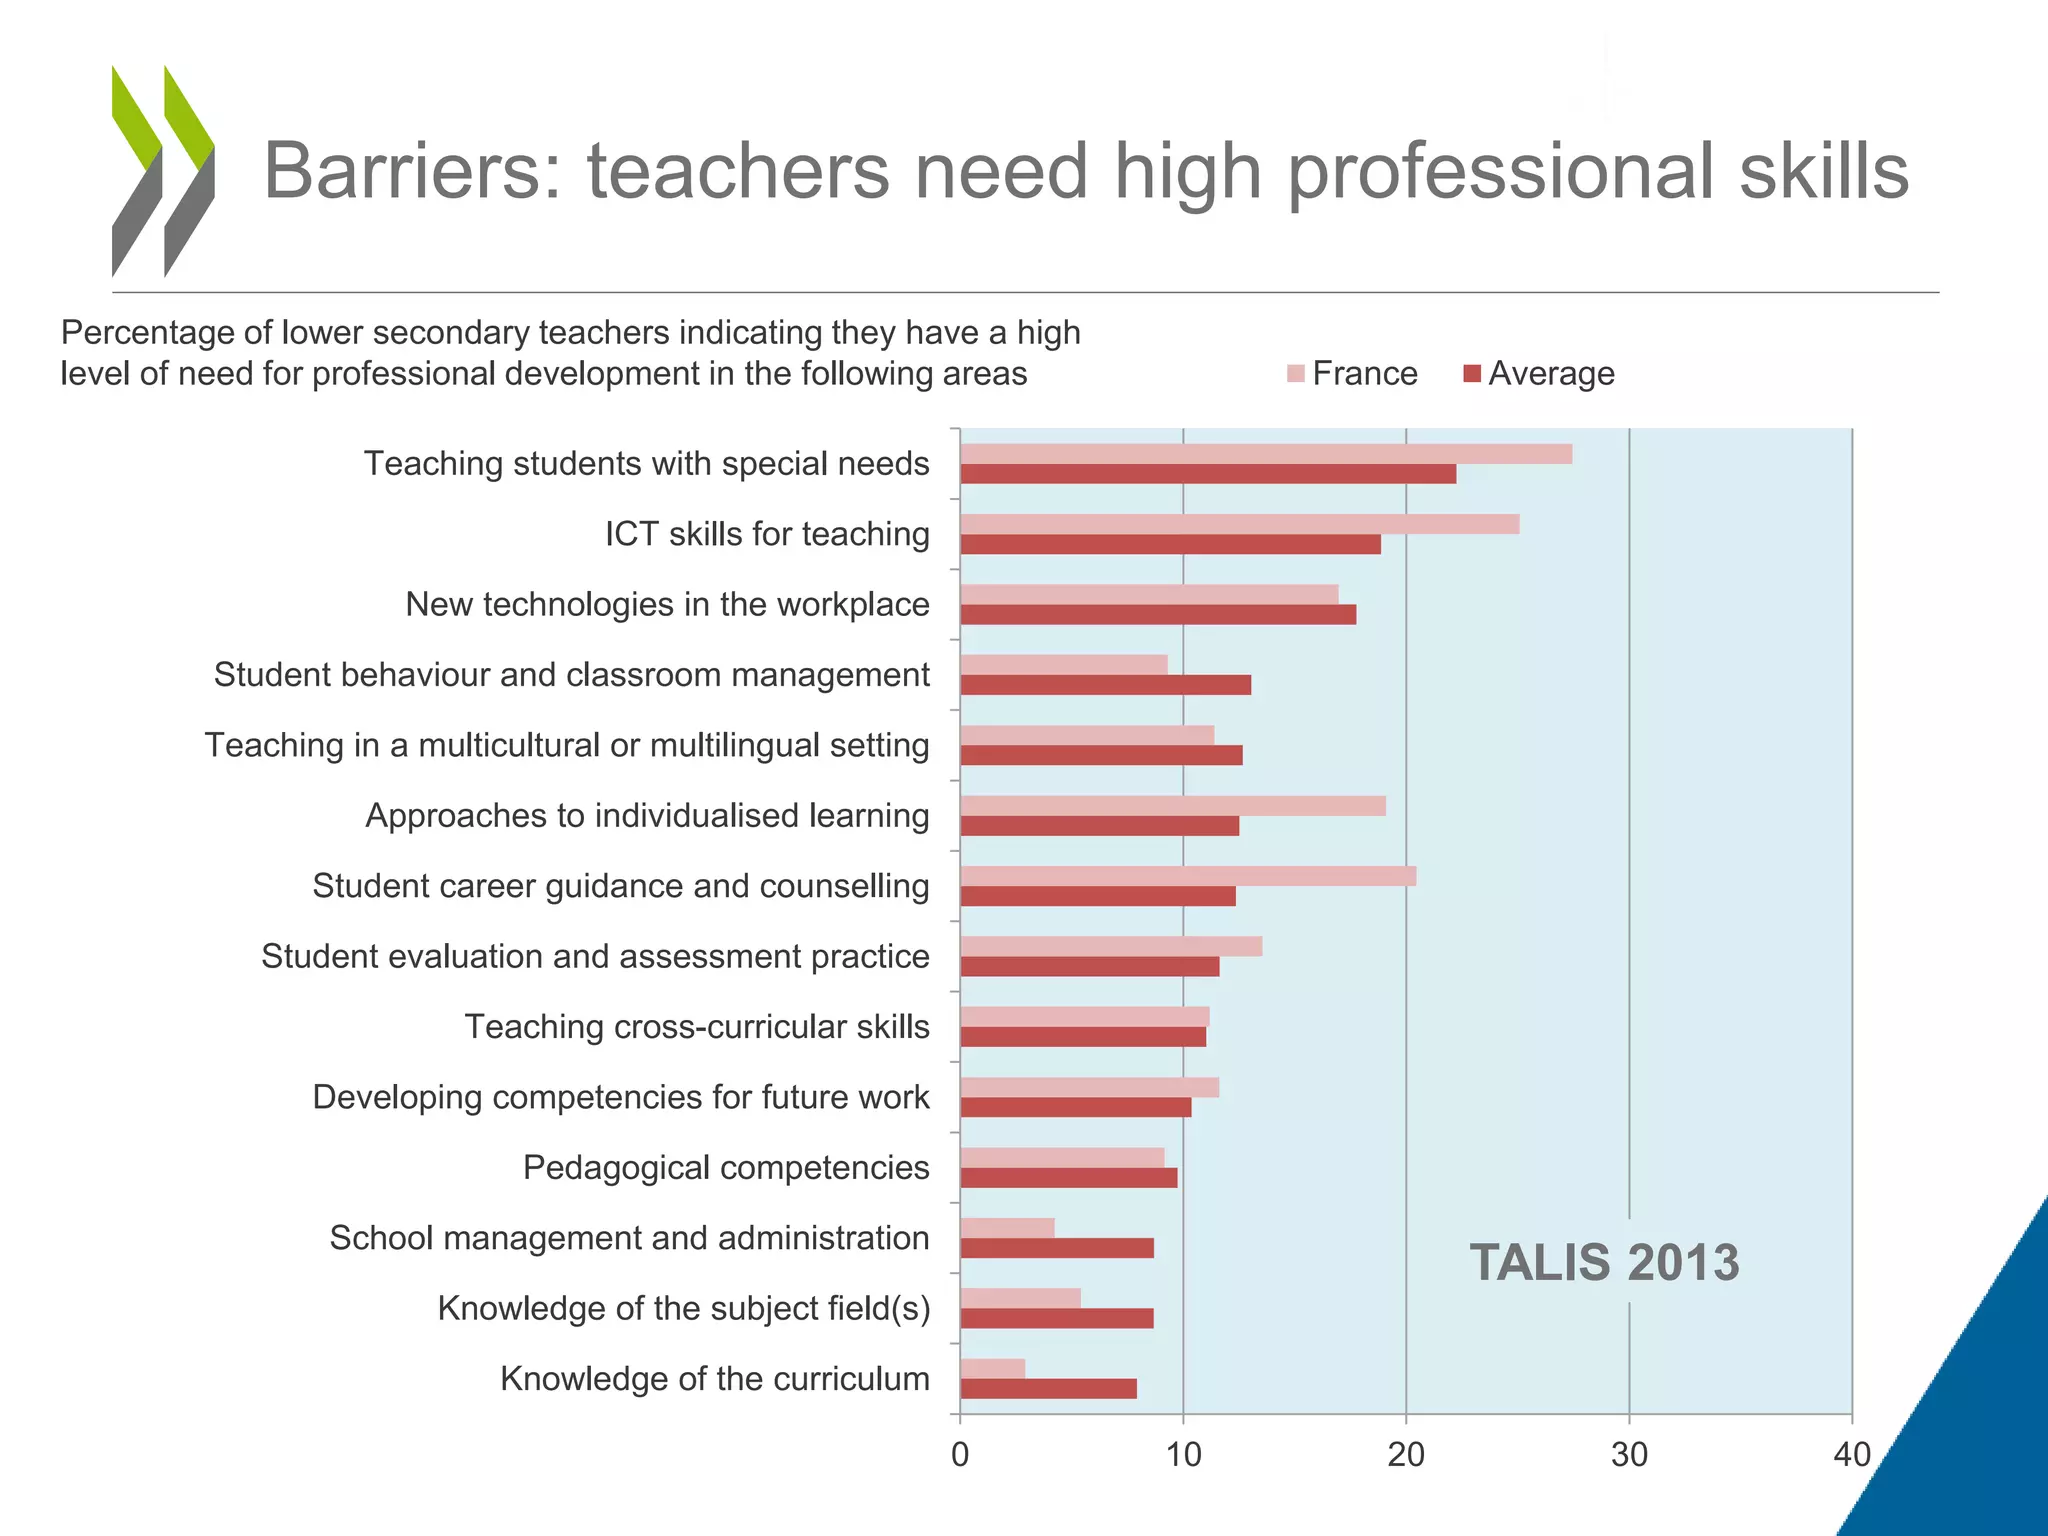
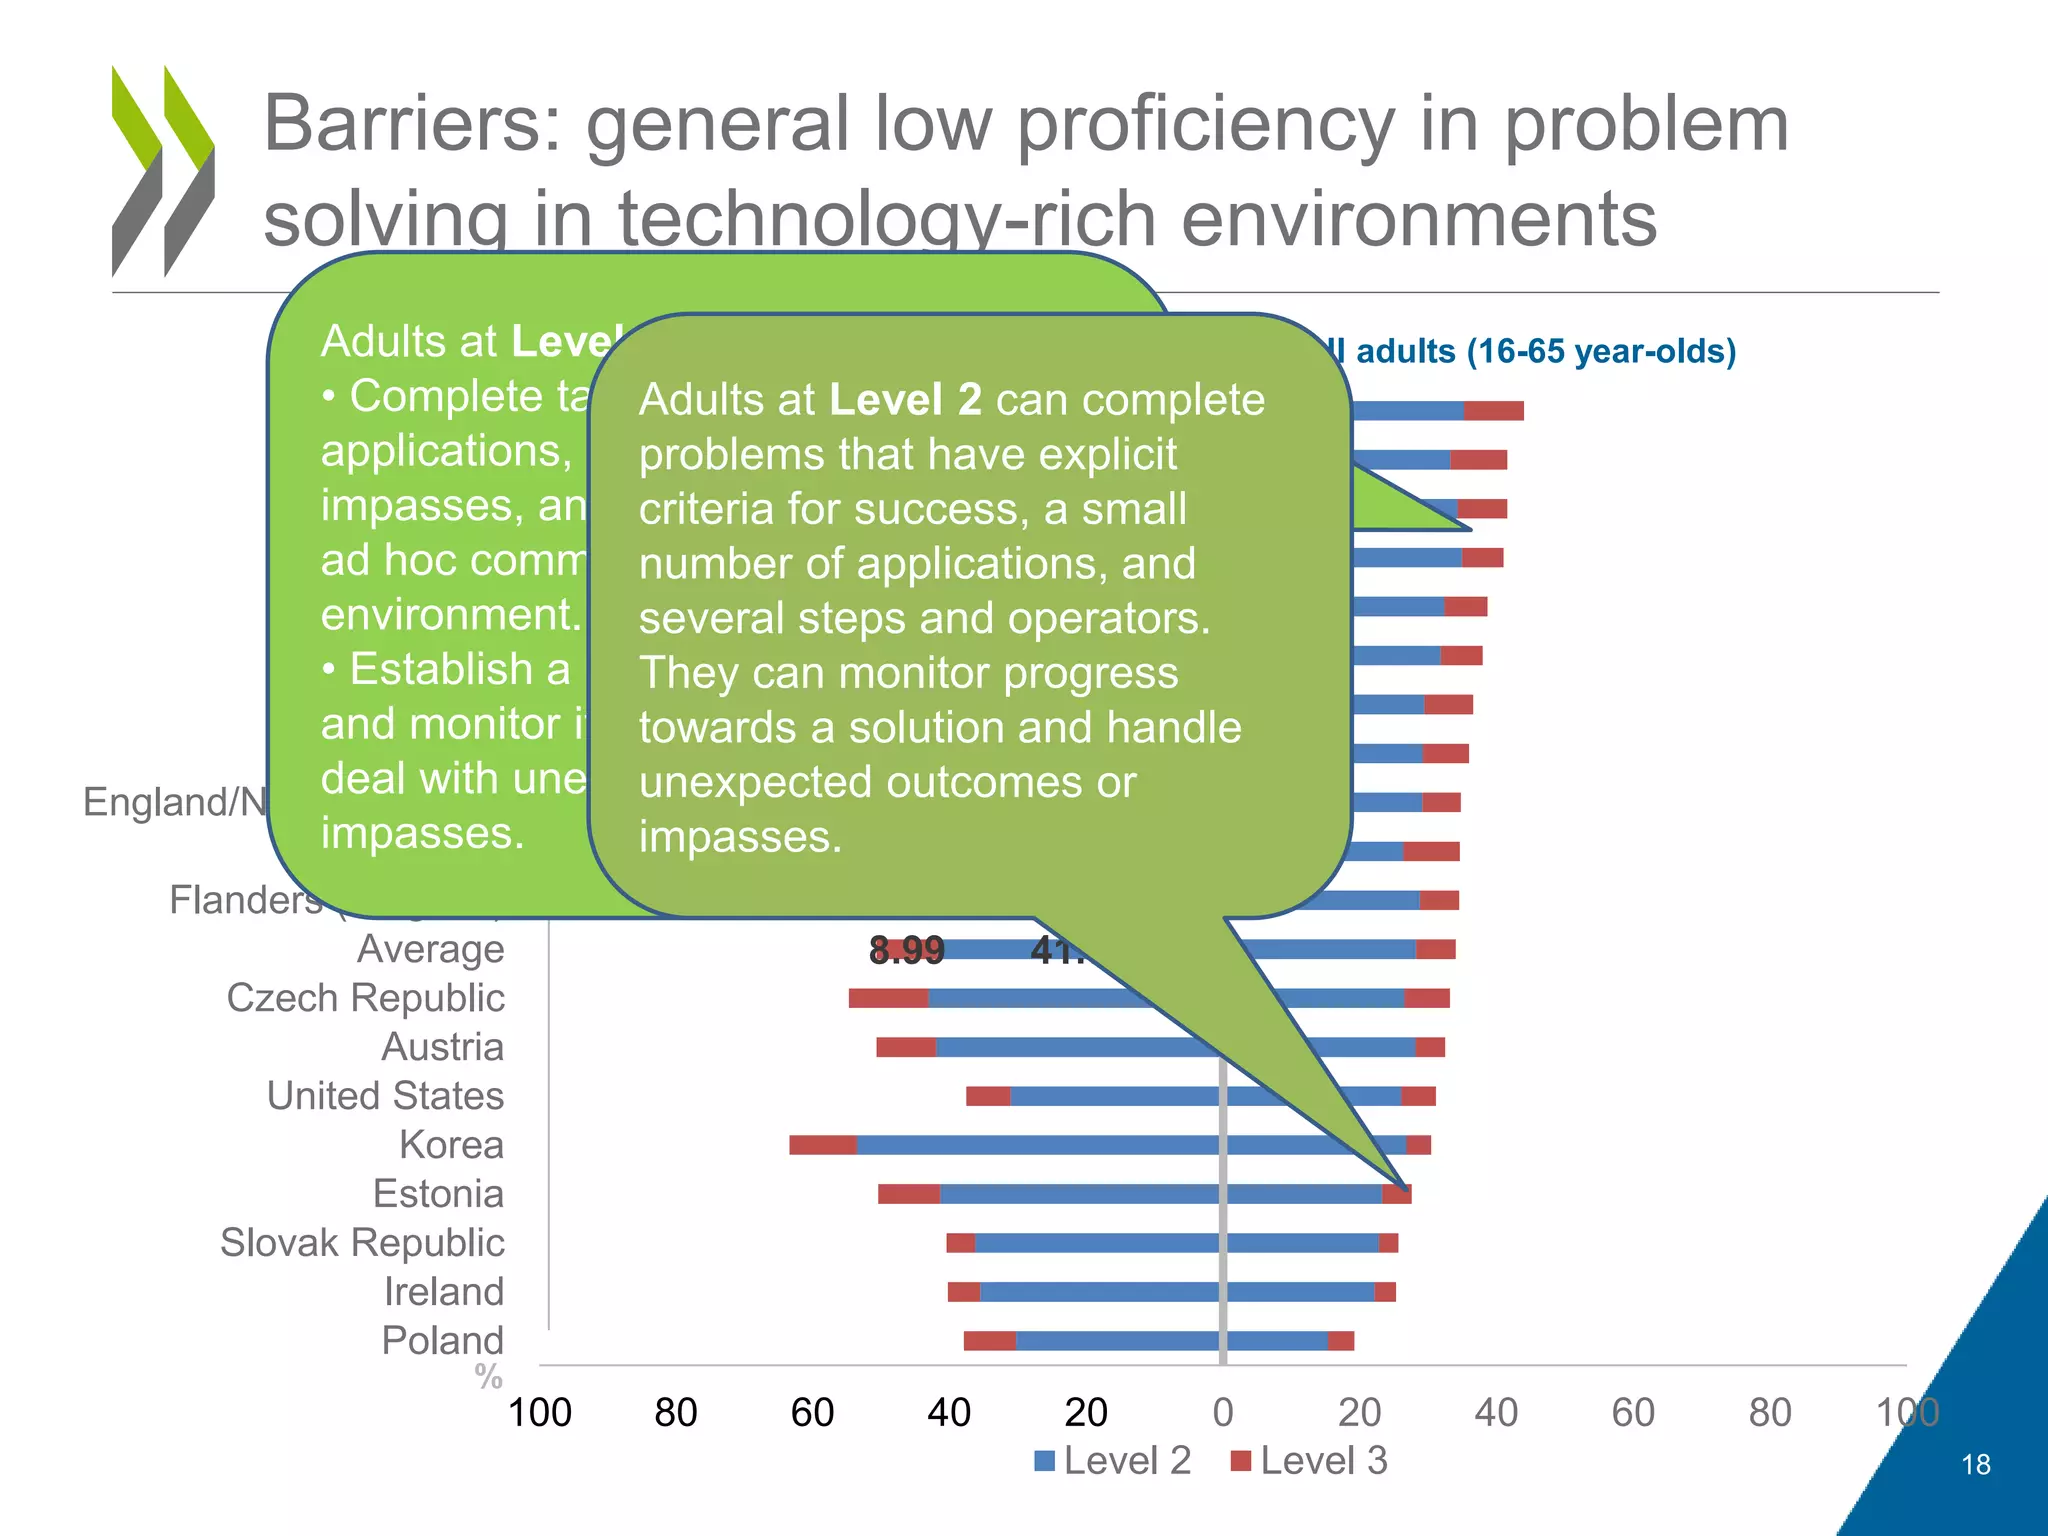
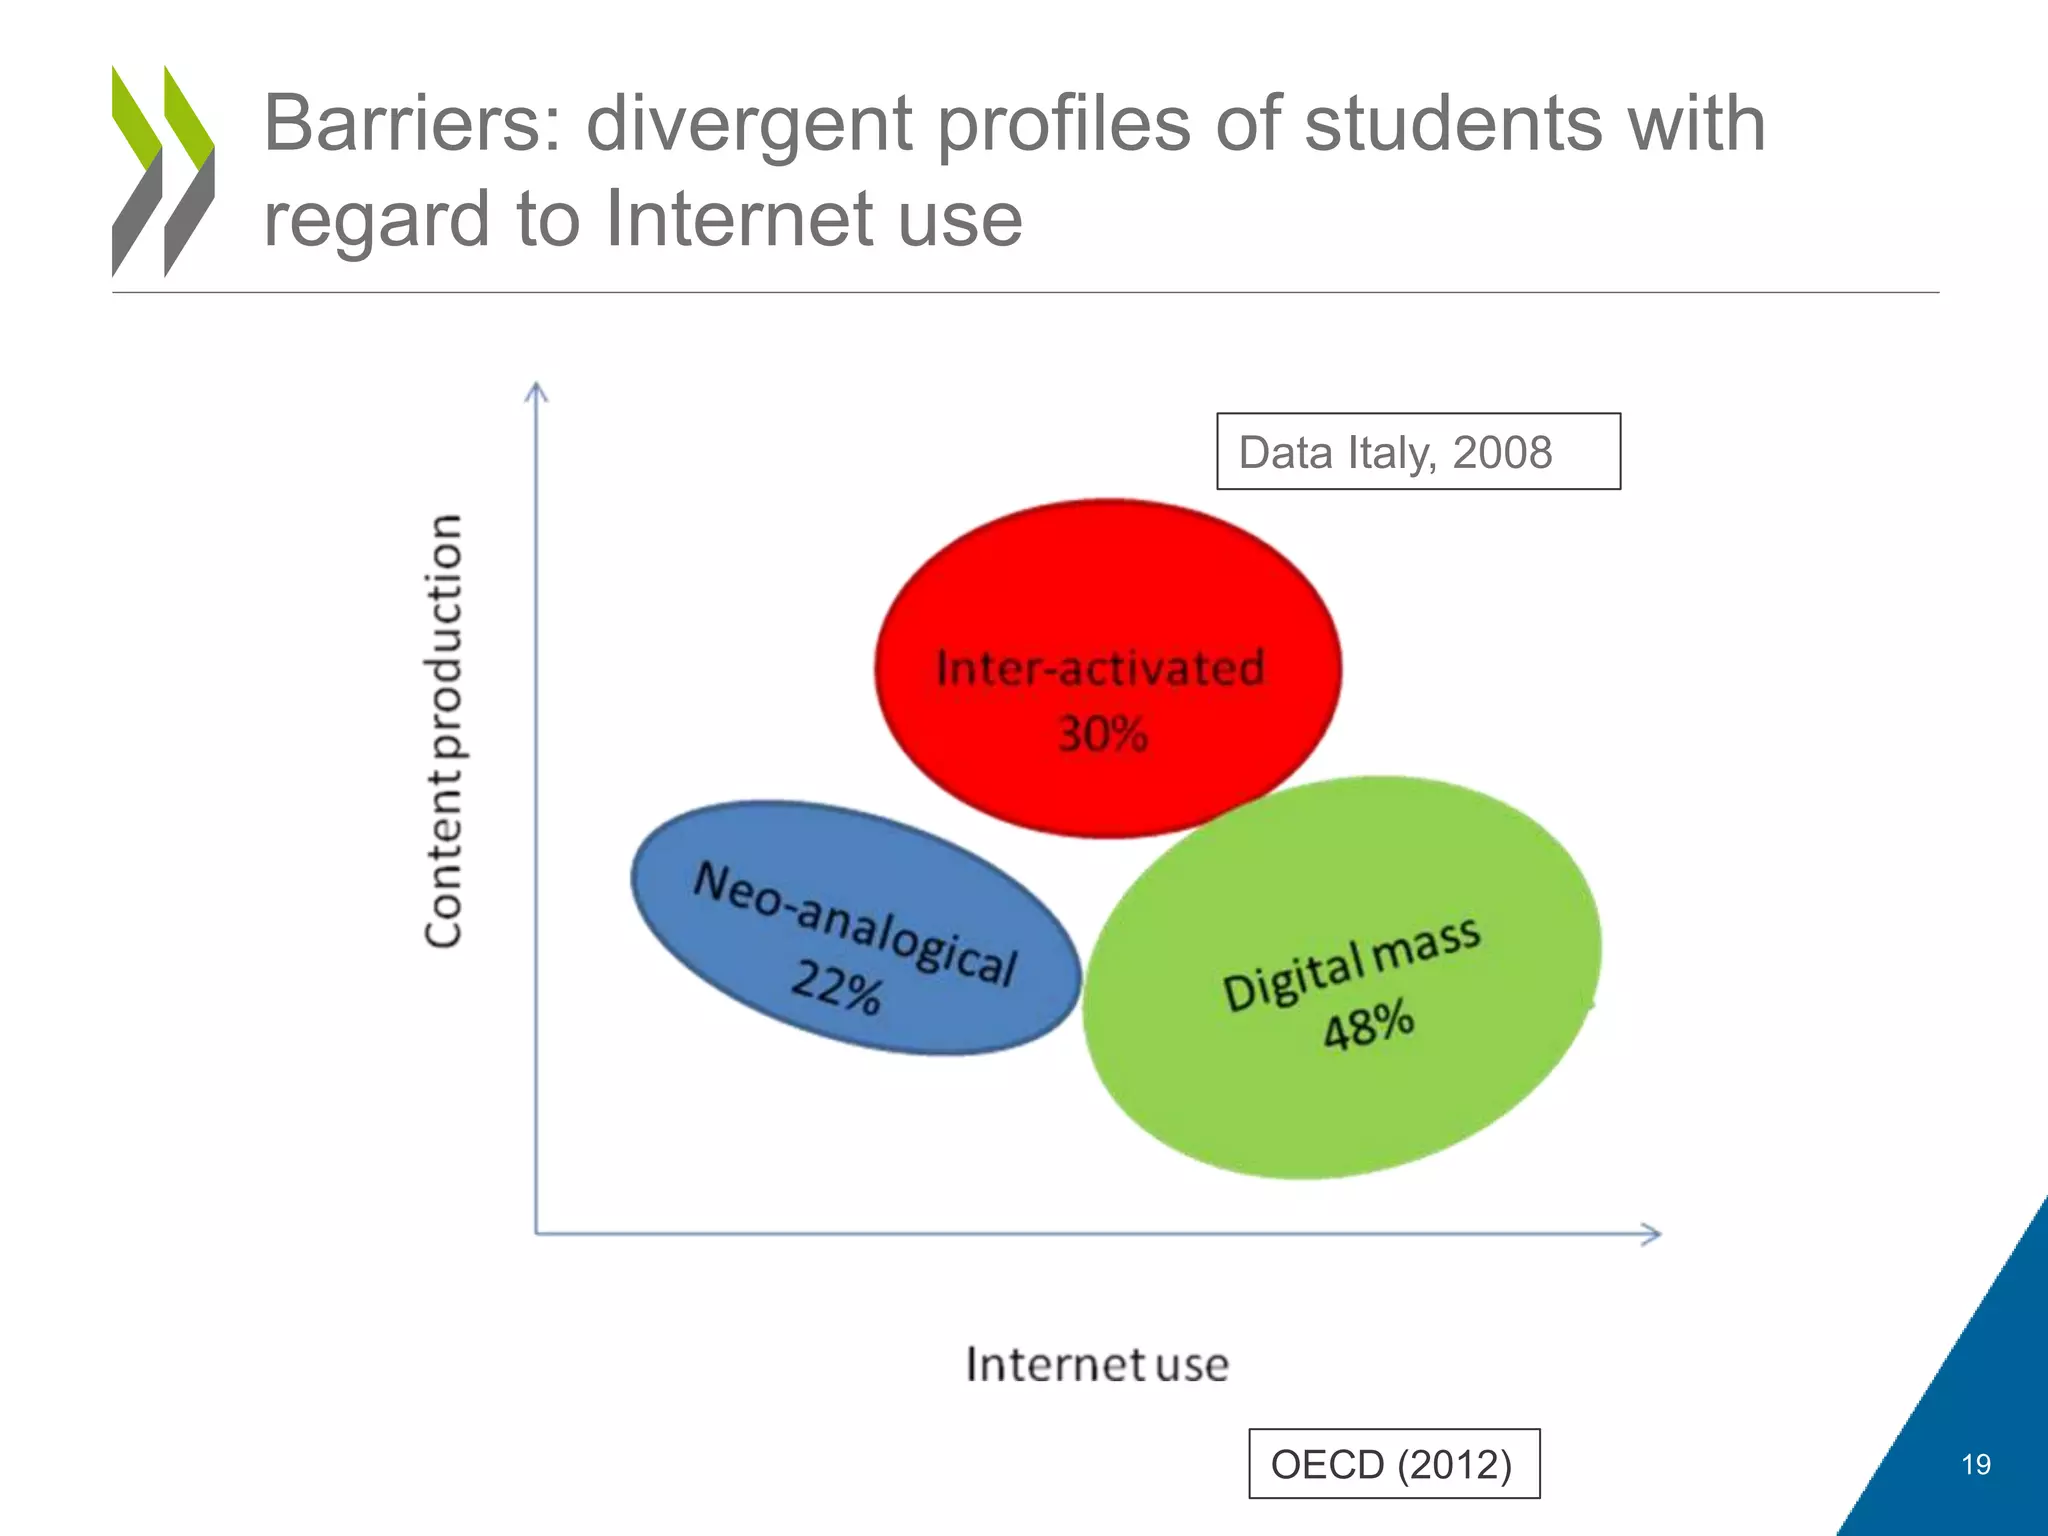
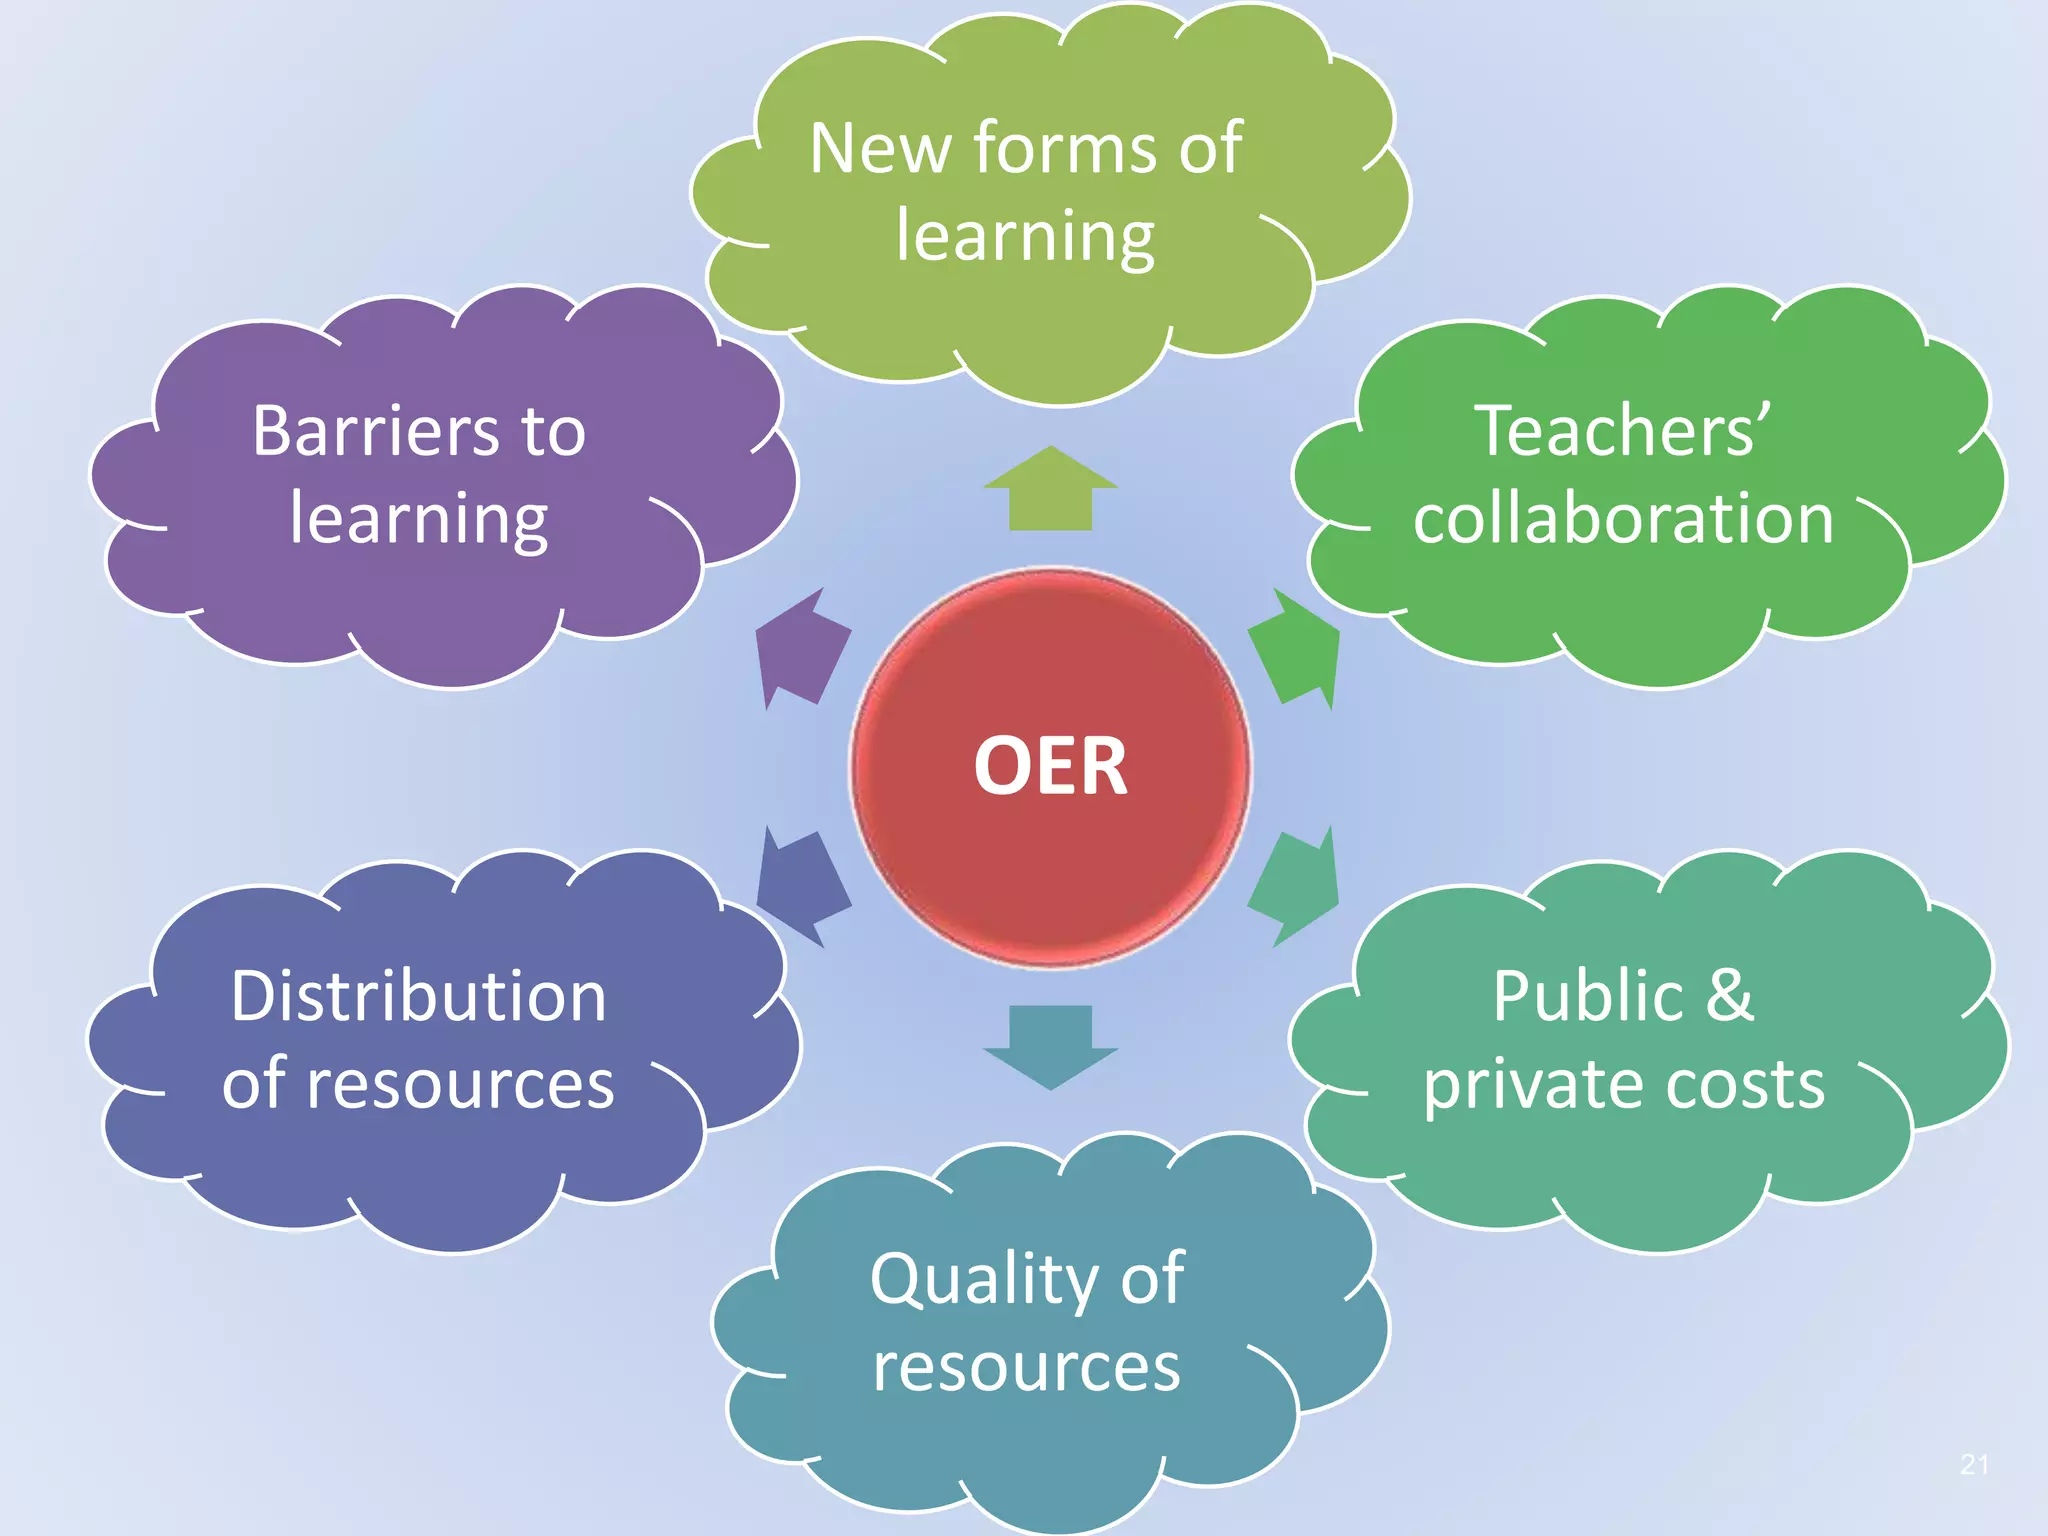
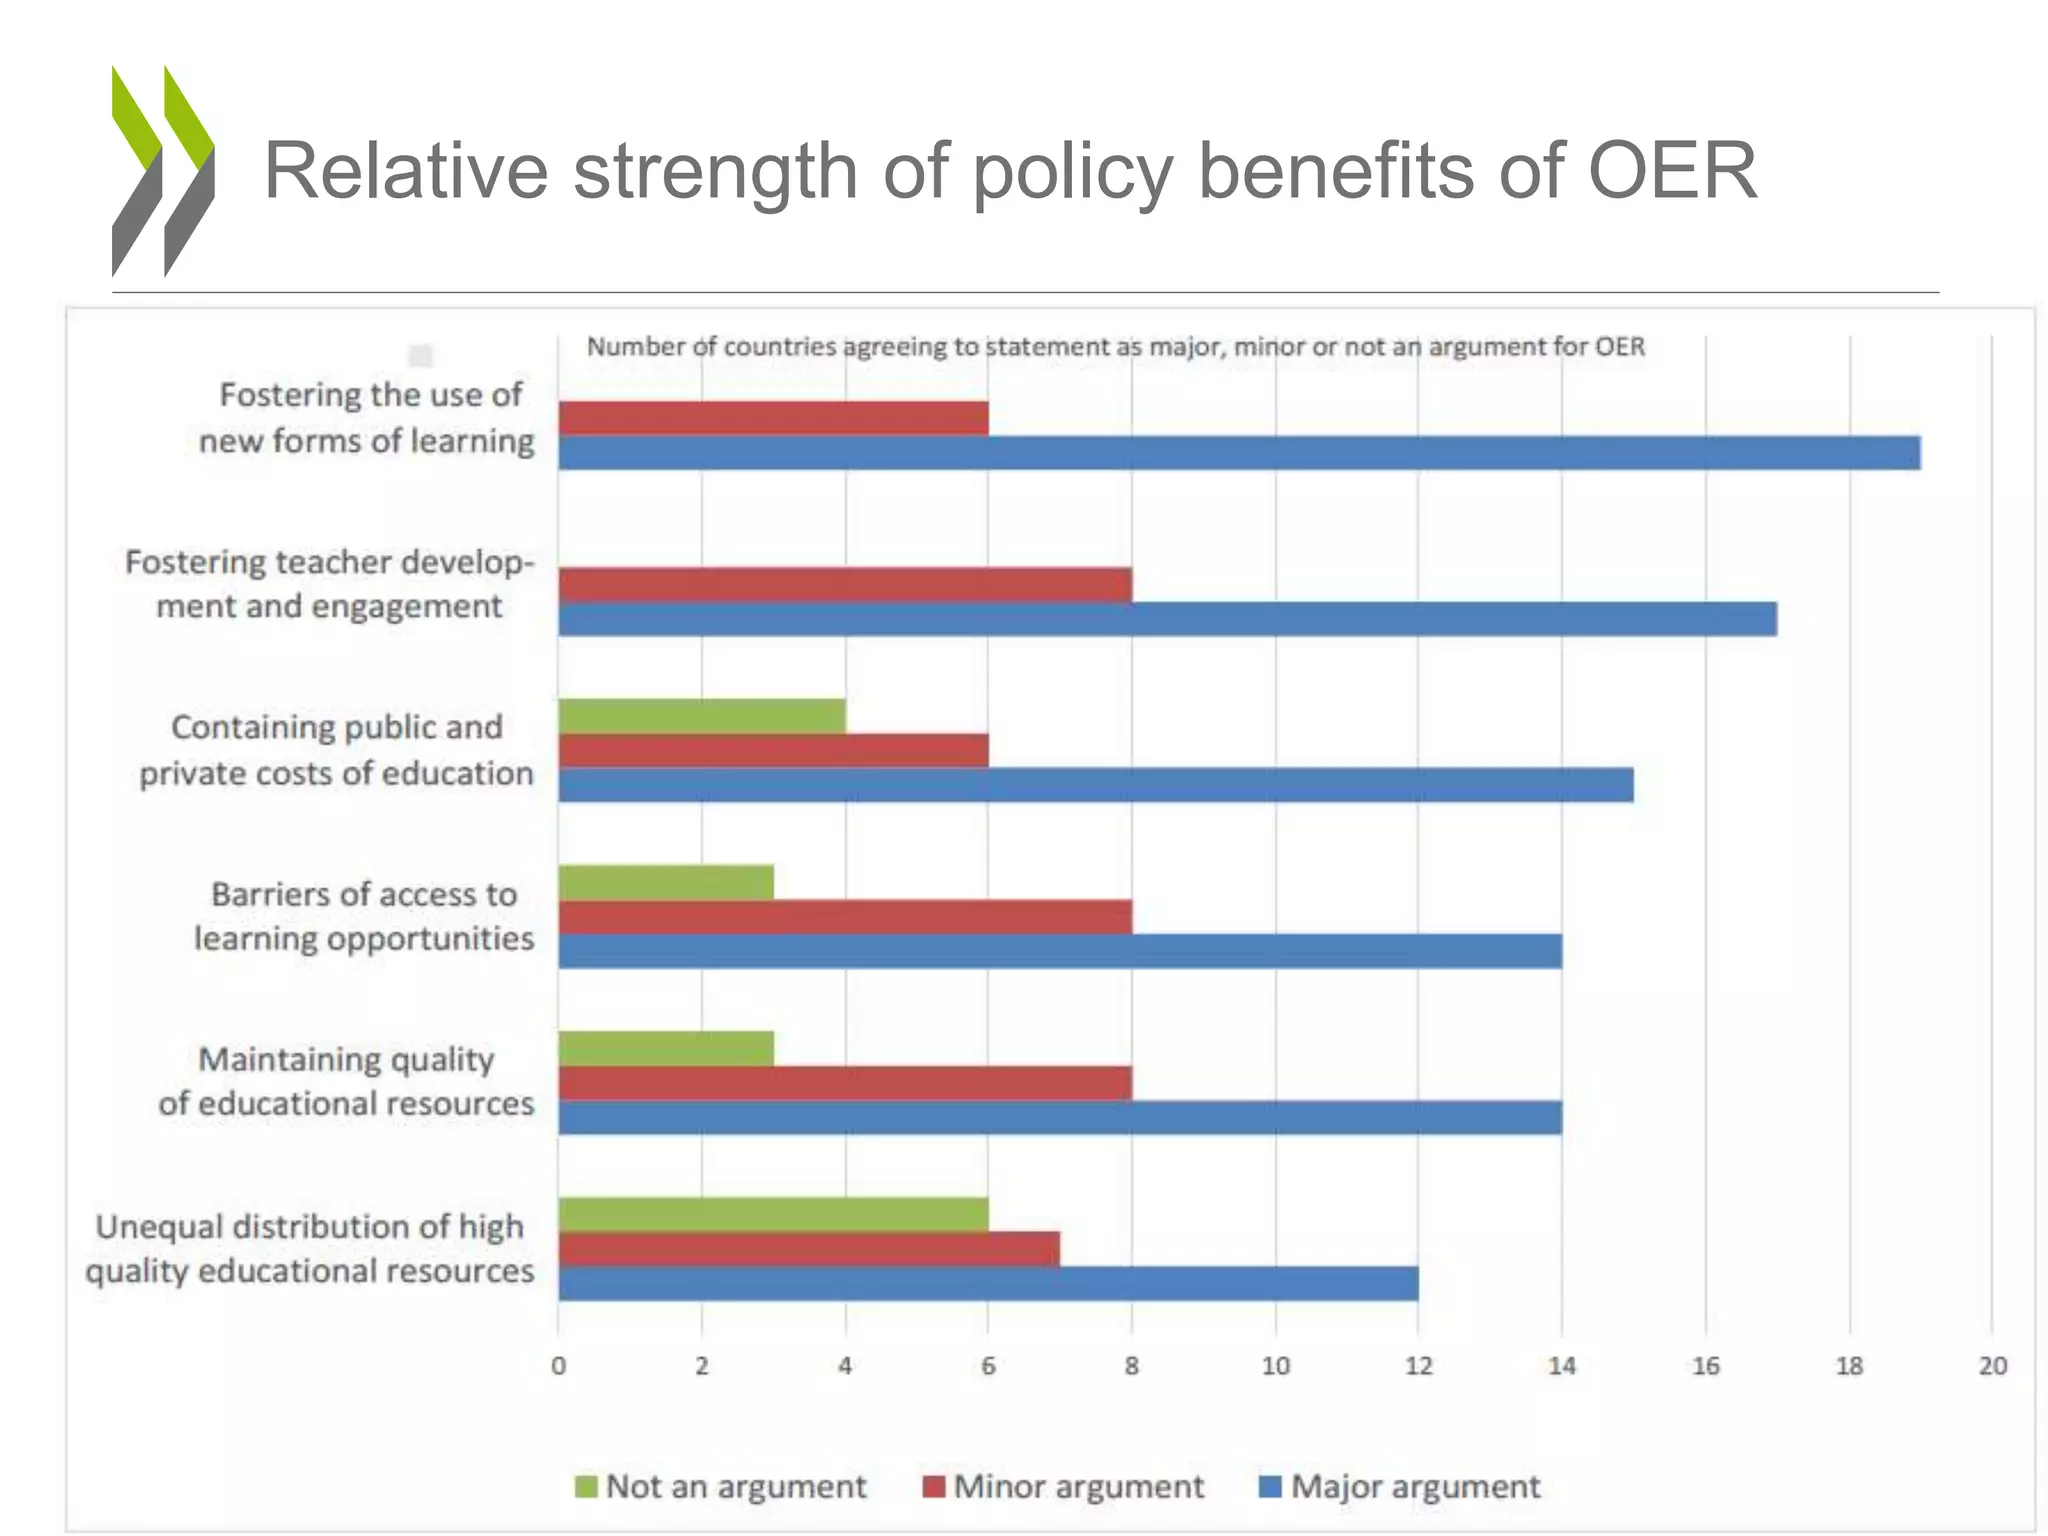
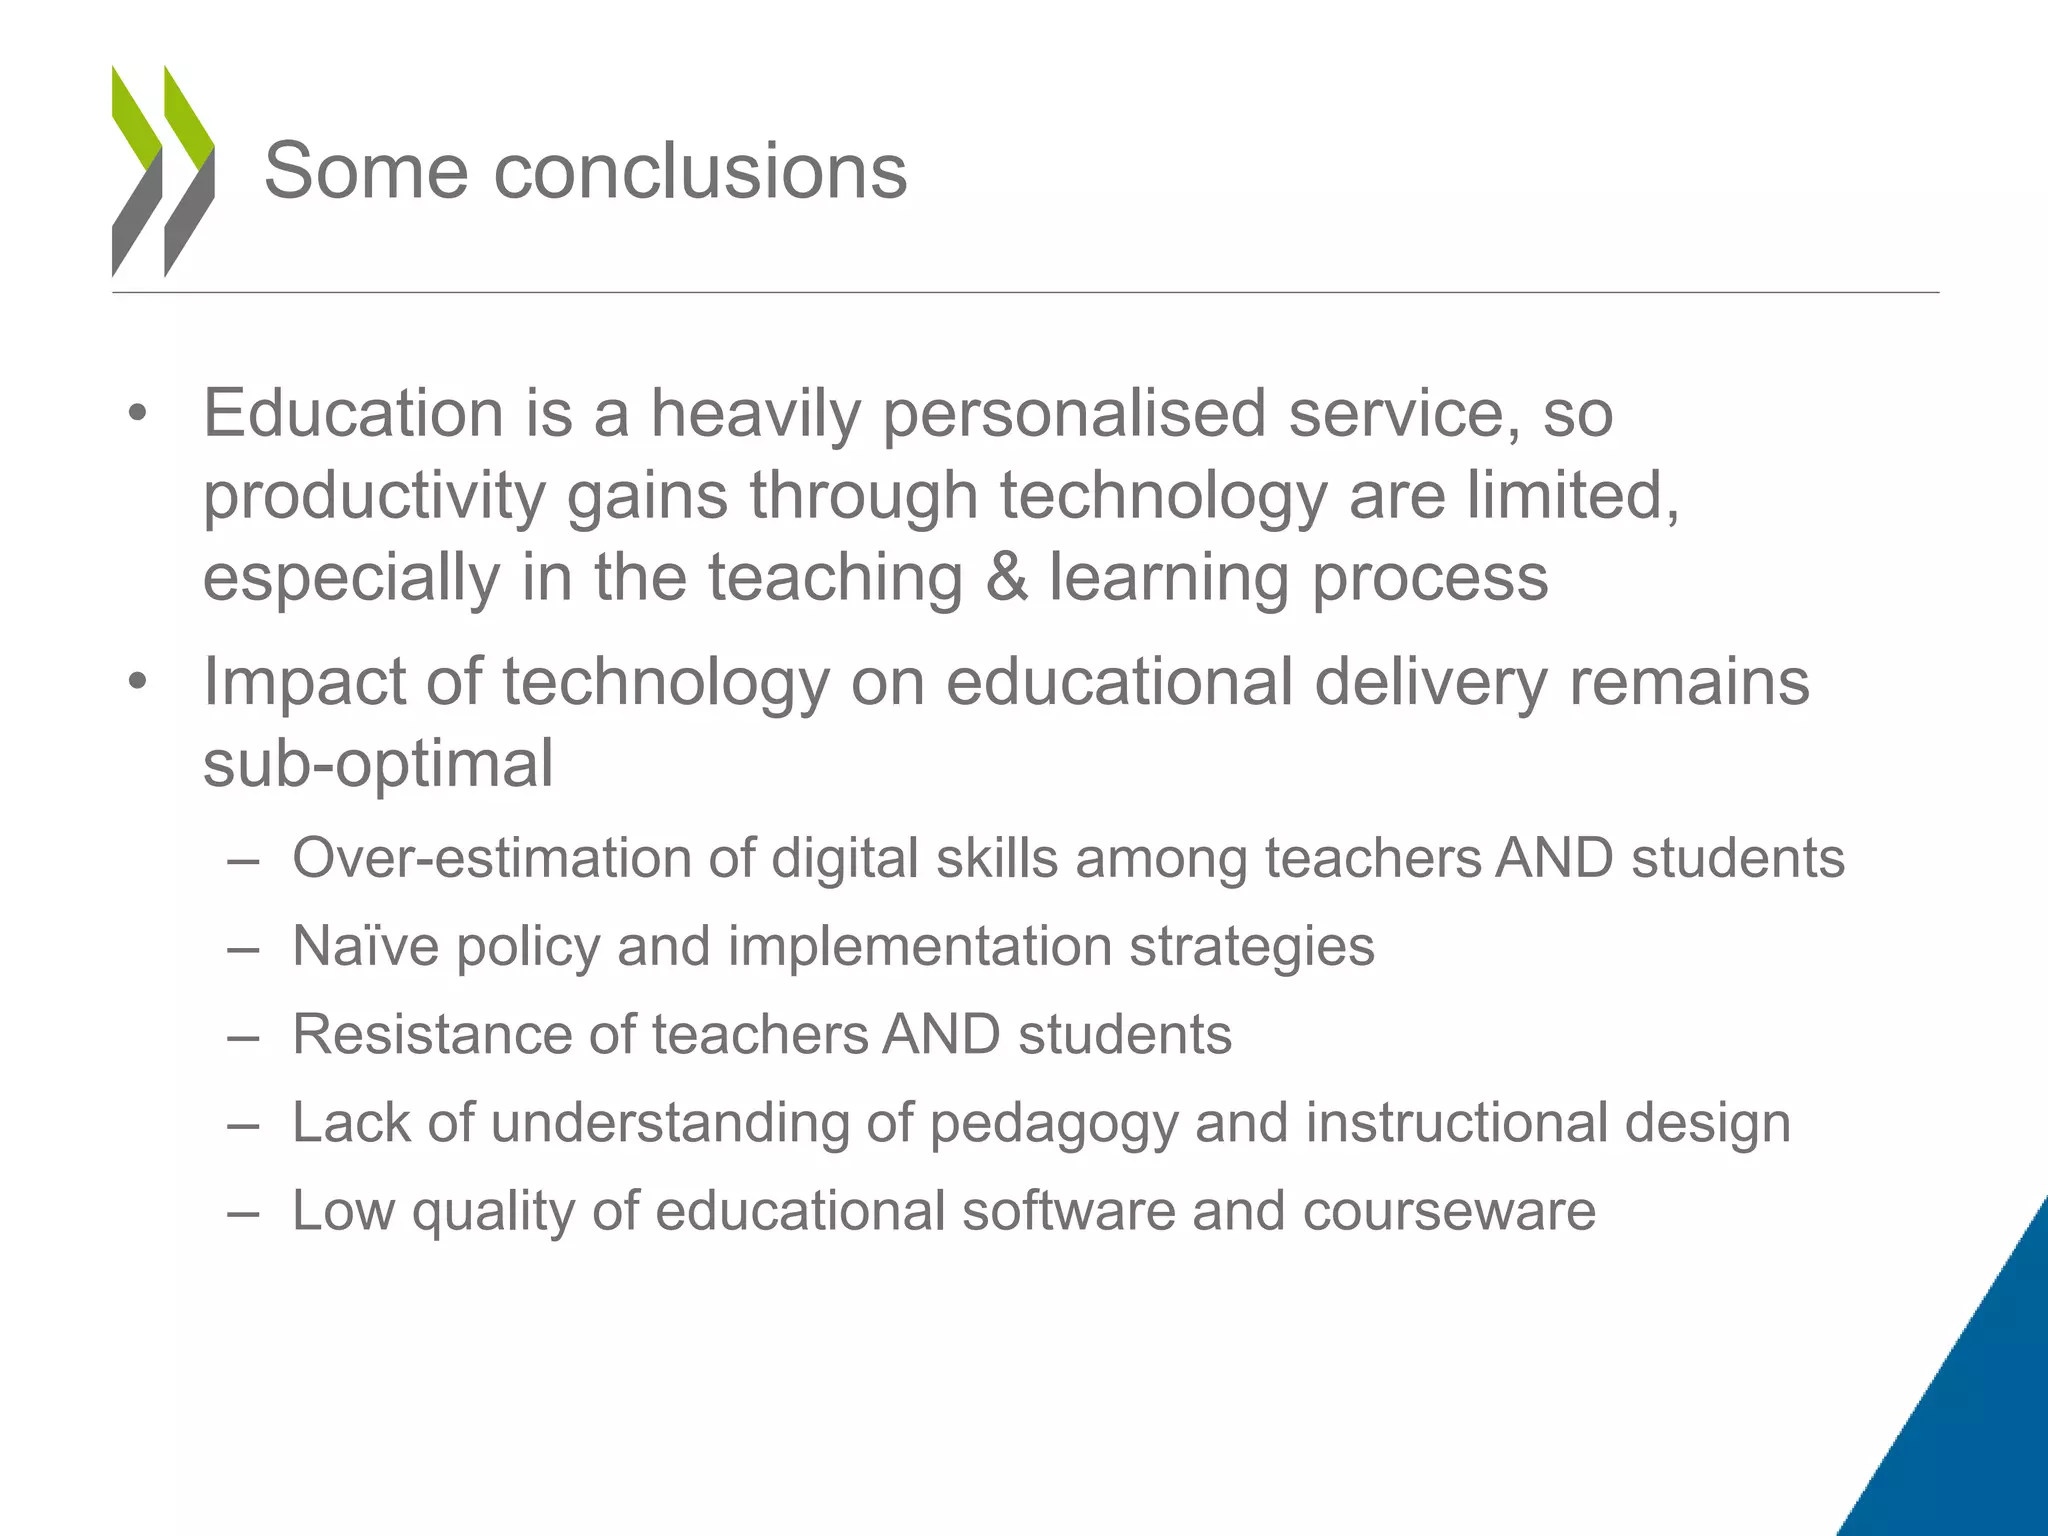
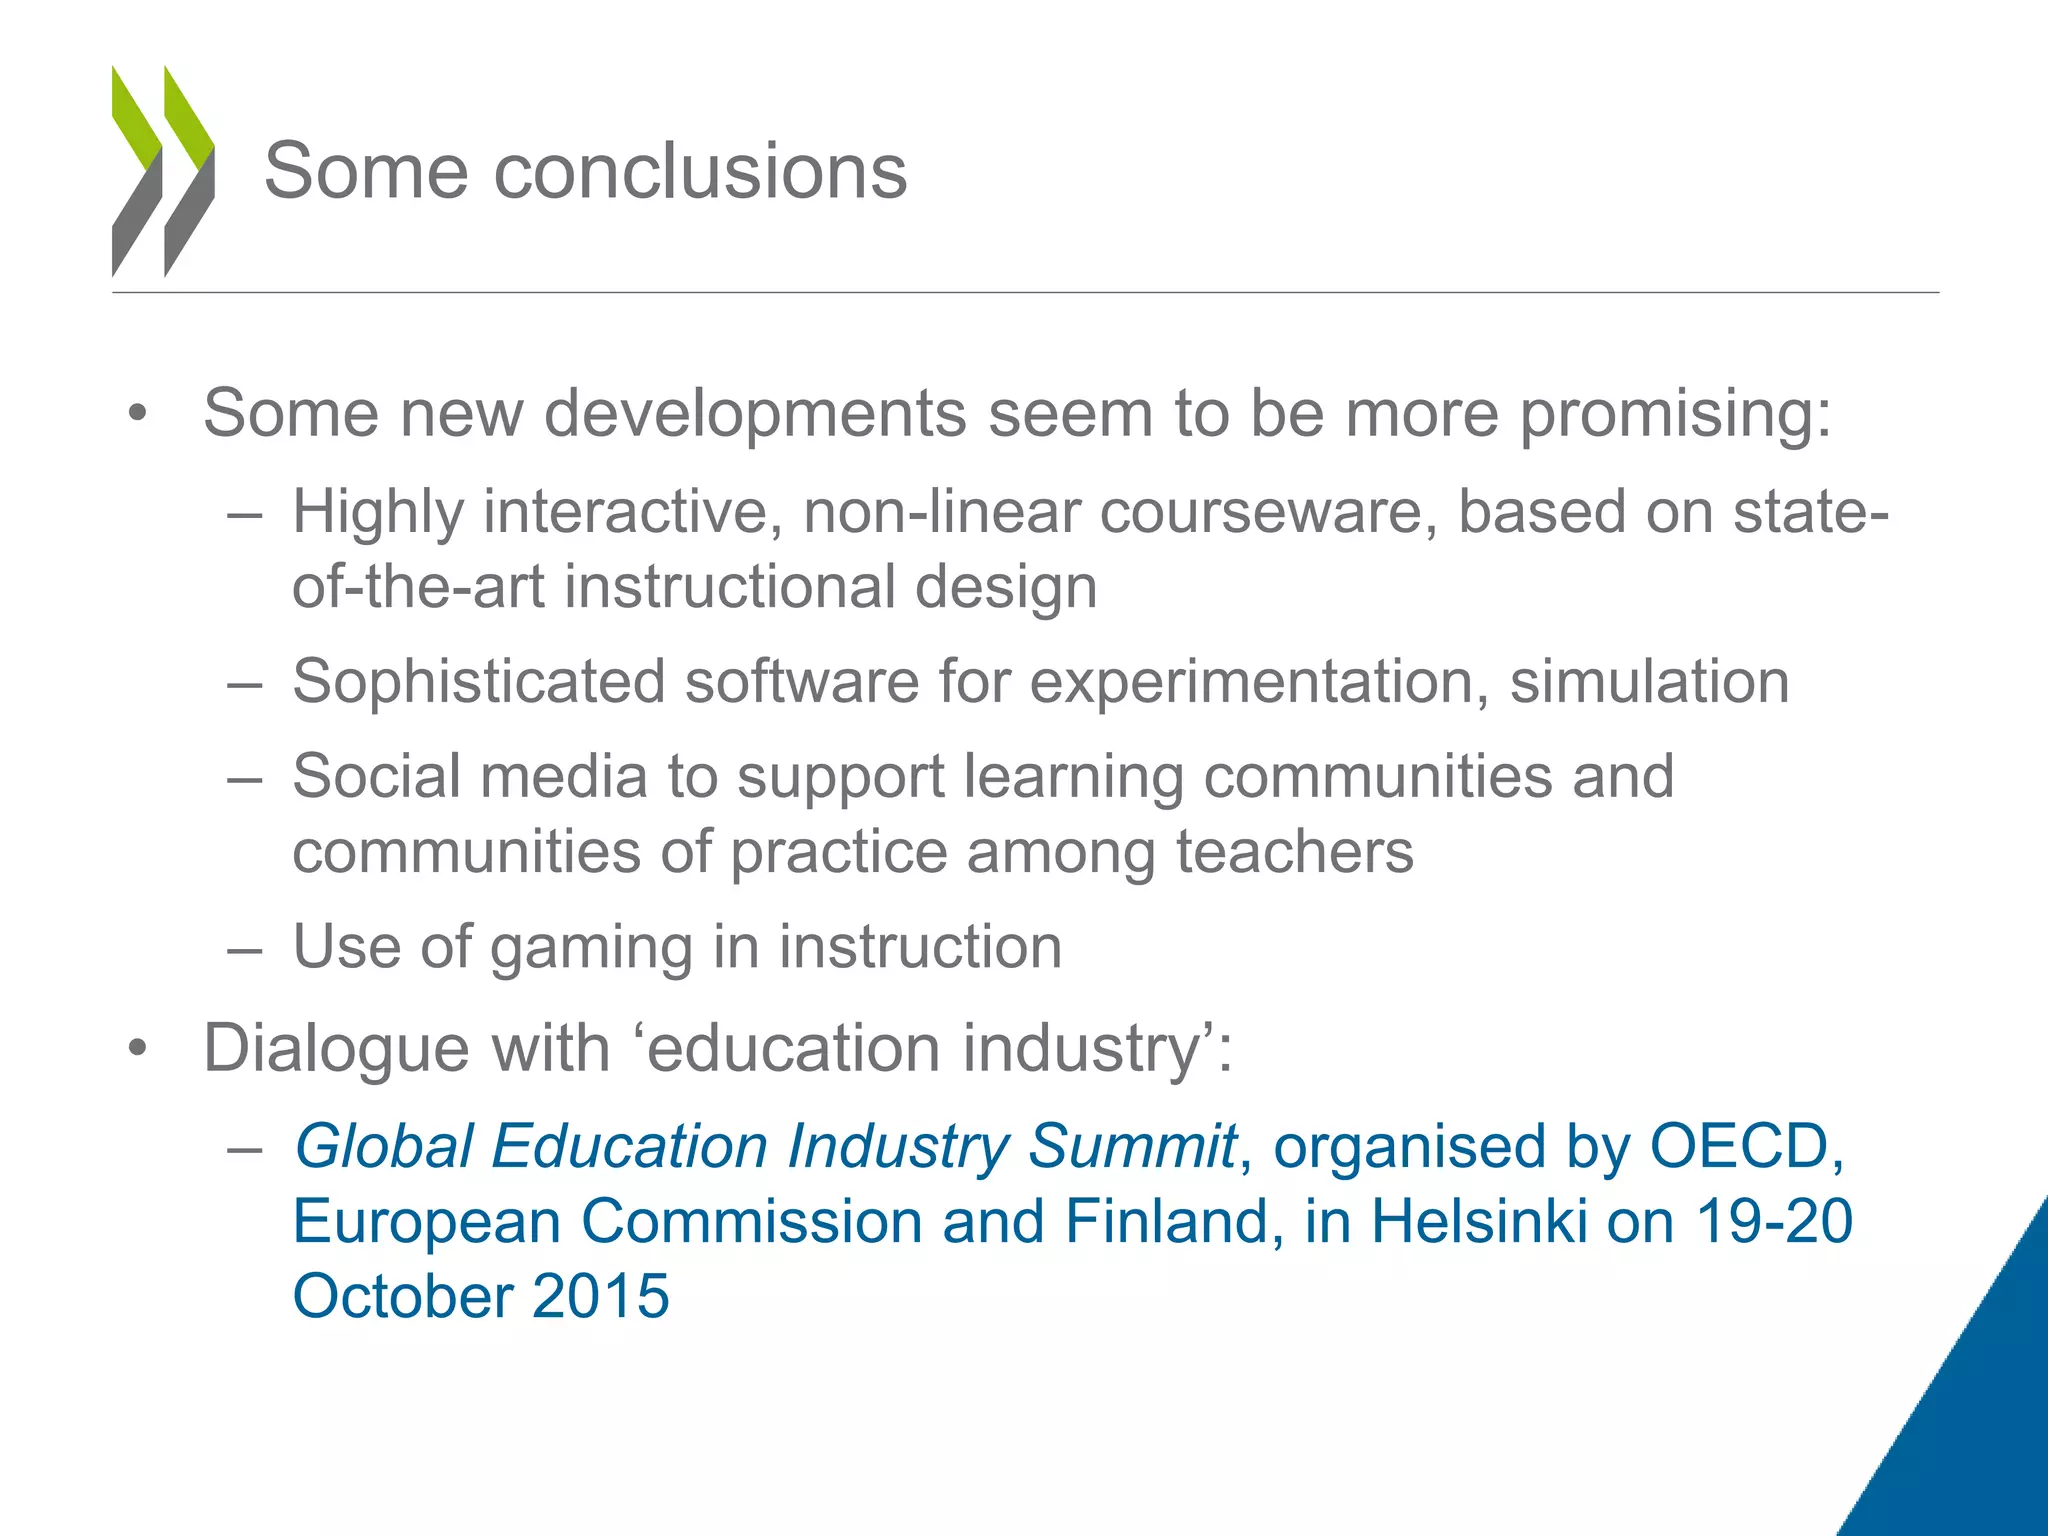
HOW CAN TECHNOLOGY CHANGE
THE WAY WE LEARN AND TEACH?
TECHNOLOGY AND
EDUCATIONAL PERFORMANCE
Dirk Van Damme
OECD/EDU/IMEP
The Chronicle of Higher Education, 5 Feb 2015
Technology in education: a history of self-
proclaimed ‘revolutions’
“The MOOC hype fades…”
Technology in education: a history of self-
proclaimed ‘revolutions’
4
5
Technology is changing:
• Skills demand
• Educational delivery
0
10
20
30
40
50
60
70
80
90
100
Japan
NewZealand
Portugal
Netherlands
Spain
Australia
Belgium
Germany
UnitedKingdom
Switzerland
Italy
Poland
Hungary
France
Ireland
UnitedStates
Austria
Canada
Sweden
Korea
Norway
Finland
OECDaverage
Slovenia
Luxembourg
Denmark
Iceland
Chile
CzechRepublic
Turkey
Greece
Israel
Mexico
Estonia
SlovakRepublic
Adequate instructional materials (e.g. textbooks) Adequate computer software for instruction
Adequate Internet connectivity
New technologies and high-quality instructional
resources are increasingly present in schools
School principals reports on the adequacy of resources to support student learning in their schools
% of students
Source: PISA 2012
The quality of schools’ educational resources
improved in most countries over the last decade
Change between 2003 and 2012 in the index of quality of schools' educational resources
(e.g. textbooks, computers, laboratory materials)
-0.4
-0.2
0
0.2
0.4
0.6
0.8
1
1.2
1.4
1.6
Turkey
Poland
Japan
Canada
SlovakRepublic
Portugal
Norway
Ireland
CzechRepublic
Greece
Spain
Belgium
Hungary
Australia
Sweden
OECDaverage
Switzerland
Germany
Italy
NewZealand
Denmark
Finland
Austria
UnitedStates
Luxembourg
Netherlands
Mexico
Iceland
Korea
Variationintheindex
Source: PISA 2012
37
48
0%
20%
40%
60%
80%
100%
Norway
Sweden
Finland
Denmark
Spain
Malta
Portugal
Estonia
Ireland
Luxembourg
Cyprus
Latvia
France
Belgium
EU
Czech_Rep
Austria
Lithuania
Slovenia
Croatia
Hungary
Bulgaria
Greece
Slovakia
Italy
Romania
Turkey
Poland
Type 1 Type 2 Type 3
The majority of students attend schools which are
well equipped digitally
Source: European Schoolnet (2013), Survey of Schools: ICT in Education.
European schools; primary level (Grade 4), 2012
Type 1: High equipment, fast broadband, high connectedness.
Type 2: Medium equipment, slow or no broadband, some connectedness
Teachers mainly use ICT to prepare teaching activities,
but the creation and evaluation of digital resources is rare
Source: European Schoolnet (2013), Survey of Schools: ICT in Education.
EU schools; secondary level (Grade 8), 2012
Frequency of teachers’ ICT based activities with the class
Evidence on effect and impact contradicting
and in many cases negative
Evidence on effect and impact contradicting
and in many cases negative
• Expand access to content – e.g. specialised
materials well beyond textbooks, in multiple formats,
with little time and space constraints
• Support new pedagogies with learners as active
participants – e.g. as tools for inquiry-based
pedagogies and collaborative workspaces
• Collaboration for knowledge creation – e.g.
collaboration platforms for teachers to share and
enrich teaching materials
• Feedback – make it faster and more granular
• Automatize data-intensive processes – visualisation
How can digital learning environments
enhance education?
• Experiential learning (e.g. remote and virtual labs,
project-based and enquiry-based pedagogies)
• Hands-on pedagogies (e.g. game development)
• Cooperative learning (e.g. local and global
collaboration)
• Interactive and metacognitive pedagogies (e.g. real-
time assessment)
ICT can foster good pedagogic models
Some technology-enhanced pedagogic models
• Based on HP Catalyst Initiative
• 5 models:
 Virtual and remote laboratories
 Educational games
 Cooperative learning
 Real-time formative assessment
 Skills-based assessment
• These models support
 Experiential learning (e.g. project-based and enquiry-based pedagogies)
 Hands-on pedagogies (e.g. game development)
 Interactive and metacognitive pedagogies (e.g. real-time assessment)
International collaborative student learning
 Chinese and US schools analyse together
the challenge of water quality
 Technology is used to track and analyse
water (pH, salinity, dissolved oxygen, etc.)
 With the help of scientists, discuss and
understand water challenges through
remote discussions
 Fosters skills in science, deeper
understanding, multicultural
communication, and awareness of global
environmental challenges
Teacher collaboration for curriculum design and
implementation
Teachers as curators -picking up on new technology, pedagogies, and content, and
seeing how they can be put to use in a new context
Technology is identified as an integral means for leveraging the potential of
networked professional knowledge
Scootle Community
A professional digital community for Australian teachers to discuss and share ideas about
the national Curriculum and its implementation
Enables on-line collaboration
 Teachers helping one another respond to problems of practice
 Access digital lesson plans, curriculum resources and research
 Collaborate on solutions
Using data mining and analytics to derive insights for curriculum design from web
navigation and conversations in on-line discussion platforms (blogs and social media)
Fig II.3.3
Teachers' needs for professional development
0 10 20 30 40
Knowledge of the curriculum
Knowledge of the subject field(s)
School management and administration
Pedagogical competencies
Developing competencies for future work
Teaching cross-curricular skills
Student evaluation and assessment practice
Student career guidance and counselling
Approaches to individualised learning
Teaching in a multicultural or multilingual setting
Student behaviour and classroom management
New technologies in the workplace
ICT skills for teaching
Teaching students with special needs
France Average
Percentage of lower secondary teachers indicating they have a high
level of need for professional development in the following areas
Barriers: teachers need high professional skills
TALIS 2013
41.738.99
100 80 60 40 20 0 20 40 60 80 100
Poland
Ireland
Slovak Republic
Estonia
Korea
United States
Austria
Czech Republic
Average
Flanders (Belgium)
Japan
England/N. Ireland (UK)
Germany
Canada
Australia
Denmark
Norway
Netherlands
Finland
Sweden
Level 2 Level 3
Young adults (16-24 year-olds) All adults (16-65 year-olds)
18
Barriers: general low proficiency in problem
solving in technology-rich environments
%
Adults at Level 3 can
• Complete tasks involving multiple
applications, a large number of steps,
impasses, and the discovery and use of
ad hoc commands in a novel
environment.
• Establish a plan to arrive at a solution
and monitor its implementation as they
deal with unexpected outcomes and
impasses.
Adults at Level 2 can complete
problems that have explicit
criteria for success, a small
number of applications, and
several steps and operators.
They can monitor progress
towards a solution and handle
unexpected outcomes or
impasses.
Barriers: divergent profiles of students with
regard to Internet use
OECD (2012)
Data Italy, 2008
19
A specific case: Open Educational Resources
(OER)
• OER = teaching, learning and research materials
that make use of appropriate tools, such as open
licensing, to permit their free re-use, continuous
improvement and re-purposing by others
– Any type or form
– Mostly, though not exclusively, in digital format
– Allowing for re-use, revise, re-mix and re-distribute
(the ‘four Rs’ of OER)
• OER are not a technological innovation, but they are
a force of social and educational innovation made
possible by technology
OER
New forms of
learning
Teachers’
collaboration
Public &
private costs
Quality of
resources
Distribution
of resources
Barriers to
learning
21
Relative strength of policy benefits of OER
22
• Education is a heavily personalised service, so
productivity gains through technology are limited,
especially in the teaching & learning process
• Impact of technology on educational delivery remains
sub-optimal
– Over-estimation of digital skills among teachers AND students
– Naïve policy and implementation strategies
– Resistance of teachers AND students
– Lack of understanding of pedagogy and instructional design
– Low quality of educational software and courseware
Some conclusions
• Some new developments seem to be more promising:
– Highly interactive, non-linear courseware, based on state-
of-the-art instructional design
– Sophisticated software for experimentation, simulation
– Social media to support learning communities and
communities of practice among teachers
– Use of gaming in instruction
• Dialogue with ‘education industry’:
– Global Education Industry Summit, organised by OECD,
European Commission and Finland, in Helsinki on 19-20
October 2015
Some conclusions
Thank you !
dirk.vandamme@oecd.org
www.oecd.org/edu/ceri
twitter @VanDammeEDU
25

How can technology change the way we teach and learn stoa, 6 may 2015

  • 1.
    HOW CAN TECHNOLOGYCHANGE THE WAY WE LEARN AND TEACH? TECHNOLOGY AND EDUCATIONAL PERFORMANCE Dirk Van Damme OECD/EDU/IMEP
  • 2.
    The Chronicle ofHigher Education, 5 Feb 2015 Technology in education: a history of self- proclaimed ‘revolutions’ “The MOOC hype fades…”
  • 3.
    Technology in education:a history of self- proclaimed ‘revolutions’
  • 4.
  • 5.
    5 Technology is changing: •Skills demand • Educational delivery
  • 6.
    0 10 20 30 40 50 60 70 80 90 100 Japan NewZealand Portugal Netherlands Spain Australia Belgium Germany UnitedKingdom Switzerland Italy Poland Hungary France Ireland UnitedStates Austria Canada Sweden Korea Norway Finland OECDaverage Slovenia Luxembourg Denmark Iceland Chile CzechRepublic Turkey Greece Israel Mexico Estonia SlovakRepublic Adequate instructional materials(e.g. textbooks) Adequate computer software for instruction Adequate Internet connectivity New technologies and high-quality instructional resources are increasingly present in schools School principals reports on the adequacy of resources to support student learning in their schools % of students Source: PISA 2012
  • 7.
    The quality ofschools’ educational resources improved in most countries over the last decade Change between 2003 and 2012 in the index of quality of schools' educational resources (e.g. textbooks, computers, laboratory materials) -0.4 -0.2 0 0.2 0.4 0.6 0.8 1 1.2 1.4 1.6 Turkey Poland Japan Canada SlovakRepublic Portugal Norway Ireland CzechRepublic Greece Spain Belgium Hungary Australia Sweden OECDaverage Switzerland Germany Italy NewZealand Denmark Finland Austria UnitedStates Luxembourg Netherlands Mexico Iceland Korea Variationintheindex Source: PISA 2012
  • 8.
    37 48 0% 20% 40% 60% 80% 100% Norway Sweden Finland Denmark Spain Malta Portugal Estonia Ireland Luxembourg Cyprus Latvia France Belgium EU Czech_Rep Austria Lithuania Slovenia Croatia Hungary Bulgaria Greece Slovakia Italy Romania Turkey Poland Type 1 Type2 Type 3 The majority of students attend schools which are well equipped digitally Source: European Schoolnet (2013), Survey of Schools: ICT in Education. European schools; primary level (Grade 4), 2012 Type 1: High equipment, fast broadband, high connectedness. Type 2: Medium equipment, slow or no broadband, some connectedness
  • 9.
    Teachers mainly useICT to prepare teaching activities, but the creation and evaluation of digital resources is rare Source: European Schoolnet (2013), Survey of Schools: ICT in Education. EU schools; secondary level (Grade 8), 2012 Frequency of teachers’ ICT based activities with the class
  • 10.
    Evidence on effectand impact contradicting and in many cases negative
  • 11.
    Evidence on effectand impact contradicting and in many cases negative
  • 12.
    • Expand accessto content – e.g. specialised materials well beyond textbooks, in multiple formats, with little time and space constraints • Support new pedagogies with learners as active participants – e.g. as tools for inquiry-based pedagogies and collaborative workspaces • Collaboration for knowledge creation – e.g. collaboration platforms for teachers to share and enrich teaching materials • Feedback – make it faster and more granular • Automatize data-intensive processes – visualisation How can digital learning environments enhance education?
  • 13.
    • Experiential learning(e.g. remote and virtual labs, project-based and enquiry-based pedagogies) • Hands-on pedagogies (e.g. game development) • Cooperative learning (e.g. local and global collaboration) • Interactive and metacognitive pedagogies (e.g. real- time assessment) ICT can foster good pedagogic models
  • 14.
    Some technology-enhanced pedagogicmodels • Based on HP Catalyst Initiative • 5 models:  Virtual and remote laboratories  Educational games  Cooperative learning  Real-time formative assessment  Skills-based assessment • These models support  Experiential learning (e.g. project-based and enquiry-based pedagogies)  Hands-on pedagogies (e.g. game development)  Interactive and metacognitive pedagogies (e.g. real-time assessment)
  • 15.
    International collaborative studentlearning  Chinese and US schools analyse together the challenge of water quality  Technology is used to track and analyse water (pH, salinity, dissolved oxygen, etc.)  With the help of scientists, discuss and understand water challenges through remote discussions  Fosters skills in science, deeper understanding, multicultural communication, and awareness of global environmental challenges
  • 16.
    Teacher collaboration forcurriculum design and implementation Teachers as curators -picking up on new technology, pedagogies, and content, and seeing how they can be put to use in a new context Technology is identified as an integral means for leveraging the potential of networked professional knowledge Scootle Community A professional digital community for Australian teachers to discuss and share ideas about the national Curriculum and its implementation Enables on-line collaboration  Teachers helping one another respond to problems of practice  Access digital lesson plans, curriculum resources and research  Collaborate on solutions Using data mining and analytics to derive insights for curriculum design from web navigation and conversations in on-line discussion platforms (blogs and social media)
  • 17.
    Fig II.3.3 Teachers' needsfor professional development 0 10 20 30 40 Knowledge of the curriculum Knowledge of the subject field(s) School management and administration Pedagogical competencies Developing competencies for future work Teaching cross-curricular skills Student evaluation and assessment practice Student career guidance and counselling Approaches to individualised learning Teaching in a multicultural or multilingual setting Student behaviour and classroom management New technologies in the workplace ICT skills for teaching Teaching students with special needs France Average Percentage of lower secondary teachers indicating they have a high level of need for professional development in the following areas Barriers: teachers need high professional skills TALIS 2013
  • 18.
    41.738.99 100 80 6040 20 0 20 40 60 80 100 Poland Ireland Slovak Republic Estonia Korea United States Austria Czech Republic Average Flanders (Belgium) Japan England/N. Ireland (UK) Germany Canada Australia Denmark Norway Netherlands Finland Sweden Level 2 Level 3 Young adults (16-24 year-olds) All adults (16-65 year-olds) 18 Barriers: general low proficiency in problem solving in technology-rich environments % Adults at Level 3 can • Complete tasks involving multiple applications, a large number of steps, impasses, and the discovery and use of ad hoc commands in a novel environment. • Establish a plan to arrive at a solution and monitor its implementation as they deal with unexpected outcomes and impasses. Adults at Level 2 can complete problems that have explicit criteria for success, a small number of applications, and several steps and operators. They can monitor progress towards a solution and handle unexpected outcomes or impasses.
  • 19.
    Barriers: divergent profilesof students with regard to Internet use OECD (2012) Data Italy, 2008 19
  • 20.
    A specific case:Open Educational Resources (OER) • OER = teaching, learning and research materials that make use of appropriate tools, such as open licensing, to permit their free re-use, continuous improvement and re-purposing by others – Any type or form – Mostly, though not exclusively, in digital format – Allowing for re-use, revise, re-mix and re-distribute (the ‘four Rs’ of OER) • OER are not a technological innovation, but they are a force of social and educational innovation made possible by technology
  • 21.
    OER New forms of learning Teachers’ collaboration Public& private costs Quality of resources Distribution of resources Barriers to learning 21
  • 22.
    Relative strength ofpolicy benefits of OER 22
  • 23.
    • Education isa heavily personalised service, so productivity gains through technology are limited, especially in the teaching & learning process • Impact of technology on educational delivery remains sub-optimal – Over-estimation of digital skills among teachers AND students – Naïve policy and implementation strategies – Resistance of teachers AND students – Lack of understanding of pedagogy and instructional design – Low quality of educational software and courseware Some conclusions
  • 24.
    • Some newdevelopments seem to be more promising: – Highly interactive, non-linear courseware, based on state- of-the-art instructional design – Sophisticated software for experimentation, simulation – Social media to support learning communities and communities of practice among teachers – Use of gaming in instruction • Dialogue with ‘education industry’: – Global Education Industry Summit, organised by OECD, European Commission and Finland, in Helsinki on 19-20 October 2015 Some conclusions
  • 25.

Editor's Notes

  • #7 An increasingly digitalised environment in education Computer and digital resources are increasingly present in schools The quality of these resources is an important input for teaching and learning processes On average across OECD countries, about three quarters of students attend schools with adequate Internet connectivity and computer equipment to support student learning, according to school principals’ reports. At the school level, in 32 countries and economies, principals’ perceptions about the adequacy of the educational resources in their school are positively related to the school’s average performance (Table IV.3.16, which is discussed in Chapter 3). However, schools with more adequate educational resources are also those that have other characteristics closely related to higher performance. But, even after accounting for the socio-economic status and demographic profile of students and schools and various other school characteristics, in Qatar, Romania and Costa Rica schools with more adequate resources tend to perform better. This suggests that much of the impact of socio-economic status on performance is mediated by the resources invested in schools.
  • #8 Index includes 6 components of school resources: computers, connectivity, educational software, instructional materials (e.g. textbooks) , science lab equipment, library materials. In 29 of the 38 countries and economies with comparable data, there is an increase in the index of quality of schools’ educational resources. The overall trend among OECD countries, that a lack of educational resources hinders the school’s capacity to provide instruction to a lower extent in 2012 than in 2003, was observed across all school types (advantaged and disadvantaged students, advantaged and disadvantaged schools, private and public schools, lower and upper secondary programmes, and urban and rural schools). Largest improvements observed in Turkey, Poland, Uruguay and the Russian Federation. In Turkey, for example, students are more than 40 percentage points less likely to attend schools whose principal reported that a lack of instructional materials (e.g. textbooks) or computer software for instruction hinders the school’s capacity to provide instruction.
  • #10 Across the EU, around 75% of students at all grades are taught by experienced teachers with more than four years of using ICT at school. The most frequent ICT-based activities at EU level are related to the preparation of teaching activities: around 30-45% (depending the specific activity concerned) of students are taught by teachers declaring they do this every or almost every day, or at least once a week.   Creating digital resources and using the school website or virtual learning environment also happens every or almost every day, or at least once a week, for teachers of respectively around 30% and 20% of students.   The low use of digital resources and tools is a concern. Digital textbooks and multimedia tools are the resources most frequently used. However, only 30% of students use them once a week or almost every day, but more than 50% of students at all grades never or almost never use such resources.  
  • #17 Teachers as designers is one vision articulated in the statements - acting as ‘curators’ ‘picking up on new trends, research, pedagogies, technology, content and seeing how they can be put to use in a new context.’ Cooperation, collaboration and the creation of communities of practice is essential. Drawing on evidence from international research is also widely seen as a necessary means to inform change. In their different systems, teachers are engaged in learning experiences that are co-created, connected, personalised, and integrated, while representing large scale professional learning, intervention and diffusion. Technology is identified as an integral means for such collaboration and professional learning to work.
  • #18 Figure 4.14