Download as PDF, PPTX


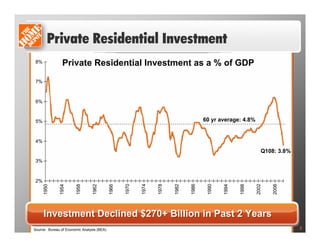
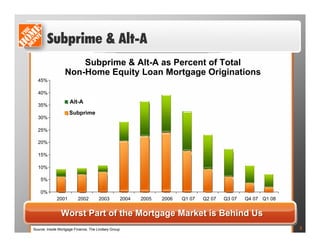
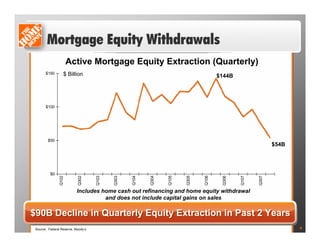
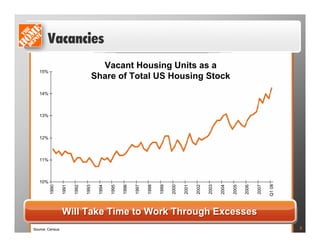
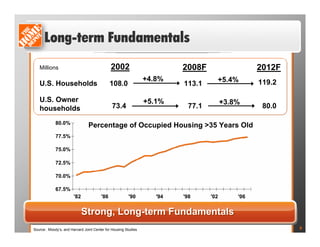
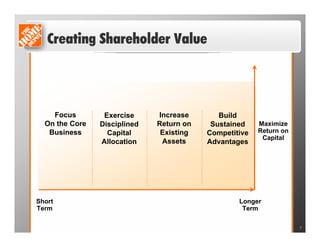
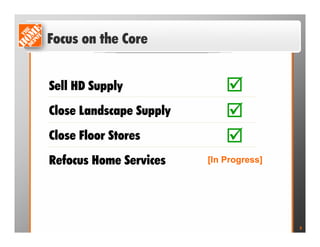
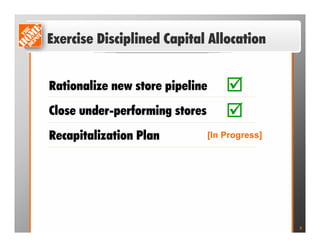
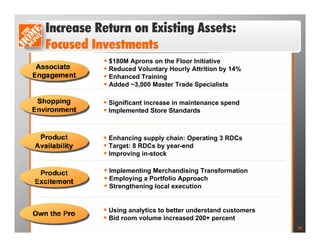
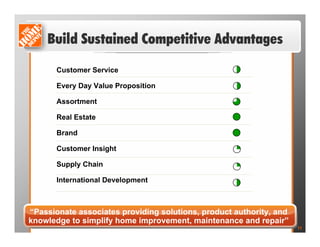
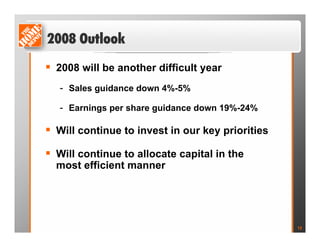
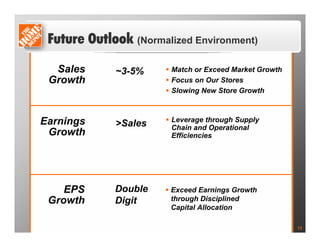
The document discusses a decline in private residential investment and subprime/Alt-A mortgages over the past few years which has negatively impacted the housing market. It then outlines Home Depot's strategic focus on increasing returns through disciplined capital allocation, investing in existing assets like employee training and supply chain improvements, and building sustained competitive advantages. Home Depot expects another difficult year in 2008 but believes these strategic initiatives position it for stronger future growth once market conditions normalize.


