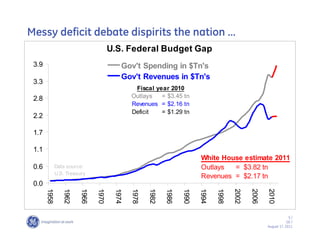
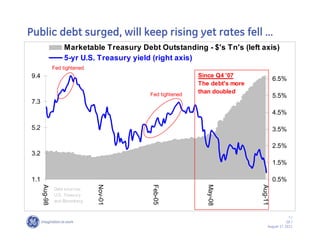
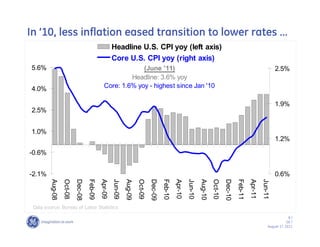
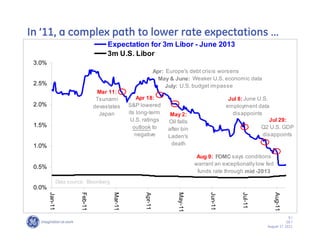
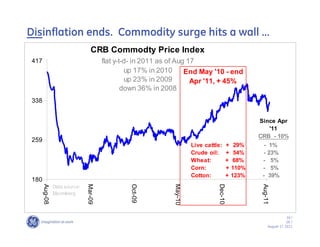
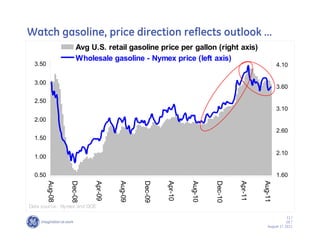
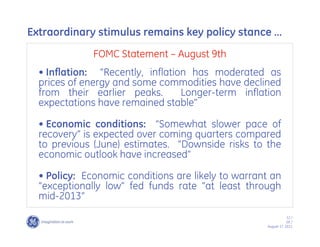
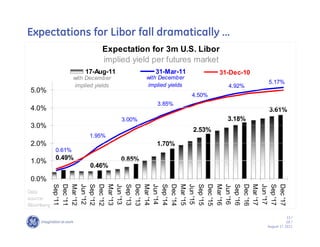
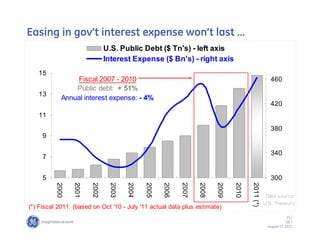
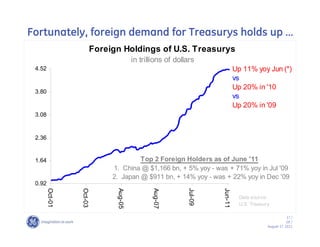
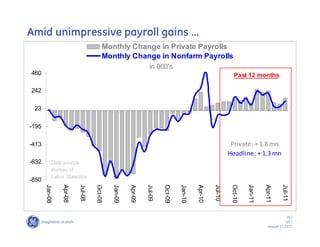
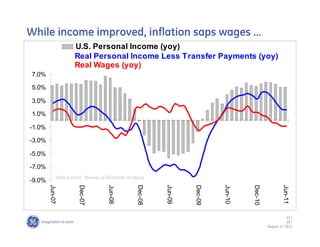
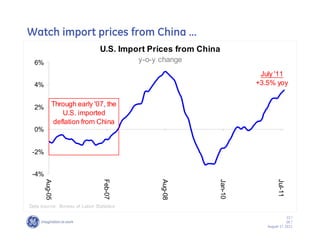
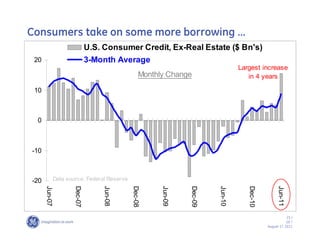
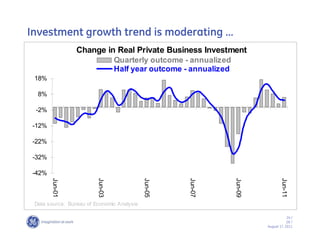
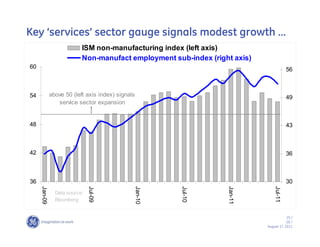
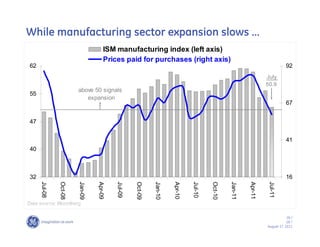
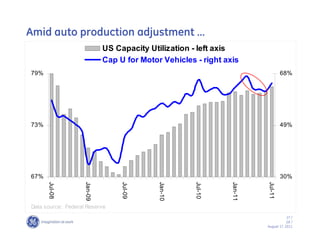
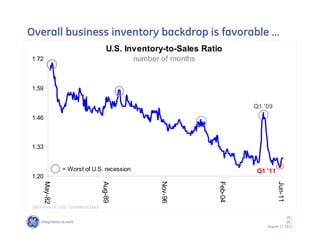
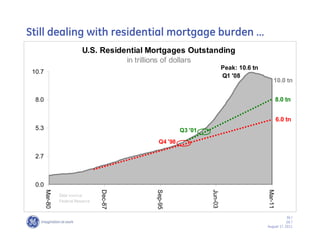
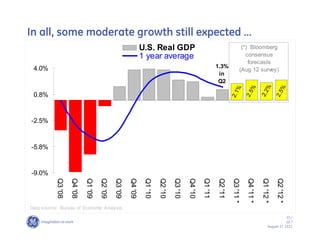
Greater Uncertainty Threatens Expansion


U.S. Economic Assessment &
Interest Rate Outlook


August 18, 2011

GE Capital, Americas
Robert Podorefsky (617) 973-4091


                                                       1/
                                                      GE /
                                          August 17, 2011
U.S. economy weakens ……
Amid uncertainty and more policy risk
Extraordinary factors contributed
•• Inflation hurt demand, shortages from Japan impacted
manufacturing, Q1 weather disrupted comps while unemployment
and Washington’’s messy budget handling weakened confidence
Key downside risk - financial market developments
•• Market volatility –– raises business & consumer anxiety
•• Unfavorable fiscal/geopolitical considerations –– Europe, Mid-East
Key to maintaining expansion
•• Continued government backstop ideology, contained oil prices
Key challenges
•• Housing sector and employment situation remain weak
•• Federal budget ‘‘super committee’’ must find solutions to deficit

                                                                            2/
                                                                           GE /
                                                               August 17, 2011
Watch the negative equity drivers ……
                  Monthly Change in S&P 500 Equity Index
  U.S. household wealth fell $1.3 tn in Q2 '10, then up $4.0 tn thru Q1 '11
 100
  75
  50
  25
   0
              Australia
 -25                                            Up 30% thru Apr 30
              began to China
 -50                                            after Bernanke
              tighten   began to
                                                outlined "options for
 -75                    tighten
                                                further easing" on
-100       Fiscal & economic worries            Aug 27, '10
-125
       Apr
       May
       Jun
       Jul
       Aug
       Sep
       Oct
       Nov
       Dec
       Jan '10
       Feb
       Mar
       Apr
       May
       Jun
       Jul
       Aug
       Sep
       Oct
       Nov
       Dec
       Jan '11
       Feb
       Mar
       Apr
       May
       Jun
       Jul
       Aug so far
Data source: Bloomberg and Federal Reserve

                                                                                     3/
                                                                                    GE /
                                                                        August 17, 2011
Parallel crises dominate while impact varies ……
                           Total Marketable Sovereign Debt
                                 in trillions of U.S. dollars
10                          % of total that comes due through 2013       $9.34
                                           Ireland = 18%
                                          Portugal = 32%
 8                                        Greece = 33%
                                            Spain = 41%
                                             Italy = 36%
 6                                     United States = 46%


 4
                                                                $2.28
 2
                                                   $0.92
          $0.13           $0.20       $0.42
 0
          Ireland        Portugal     Greece       Spain         Italy   United
                                                                         States
Data source: Bloomberg

                                                                                       4/
                                                                                      GE /
                                                                          August 17, 2011
Messy deficit debate dispirits the nation ……
                                      U.S. Federal Budget Gap
 3.9                                      Gov't Spending in $Tn's
                                          Gov't Revenues in $Tn's
 3.3
                                               Fiscal year 2010
 2.8                                          Outlays   = $3.45 tn
                                              Revenues = $2.16 tn
                                              Deficit   = $1.29 tn
 2.2

 1.7

 1.1
                                                                          White House estimate 2011
 0.6          Data source:                                                Outlays  = $3.82 tn
              U.S. Treasury
                                                                          Revenues = $2.17 tn
 0.0
       1958

                 1962

                        1966

                               1970

                                       1974

                                              1978

                                                     1982

                                                            1986

                                                                   1990

                                                                          1994

                                                                                 1998

                                                                                        2002

                                                                                               2006

                                                                                                      2010
                                                                                                                   5/
                                                                                                                  GE /
                                                                                                      August 17, 2011
U.S. rate structure benefits significantly ……
                         U.S. Treasury Yields Compared
                     Aug 16, 2011               Dec 31, 2010

                                                               4.33%
 4.5%                                                          3.67%
                                                  3.29%
                                                  2.22%

 3.0%                                 2.01%
                                      0.93%

 1.5%                        0.59%
             0.12%           0.18%
             0.01%
 0.0%
            3-month          2-year    5-year     10-year      30-year
Data source: Bloomberg

                                                                                 6/
                                                                                GE /
                                                                    August 17, 2011
Public debt surged, will keep rising yet rates fell ……
                   Marketable Treasury Debt Outstanding - $'s Tn's (left axis)
                   5-yr U.S. Treasury yield (right axis)
               Fed tightened
9.4                                                       Since Q4 '07
                                                                                     6.5%
                                                          The debt's more
                                          Fed tightened
                                                          than doubled
                                                                                     5.5%
7.3
                                                                                     4.5%

5.2                                                                                  3.5%

                                                                                     2.5%
3.2
                                                                                     1.5%

1.1                                                                                  0.5%
      Aug-98


                               Nov-01


                                           Feb-05


                                                            May-08


                                                                            Aug-11
               Data sources:
               U.S. Treasury
               and Bloomberg


                                                                                             7/
                                                                                            GE /
                                                                                August 17, 2011
In ’’10, less inflation eased transition to lower rates ……
                                                      Headline U.S. CPI yoy (left axis)
                                                      Core U.S. CPI yoy (right axis)
 5.6%                                                       (June '11)                                                                                                     2.5%
                                                        Headline: 3.6% yoy
 4.0%                                          Core: 1.6% yoy - highest since Jan '10

                                                                                                                                                                           1.9%
 2.5%


 1.0%
                                                                                                                                                                           1.2%

-0.6%


-2.1%                                                                                                                                                                      0.6%
         Aug-08
                  Oct-08
                           Dec-08
                                    Feb-09
                                             Apr-09
                                                      Jun-09
                                                               Aug-09
                                                                        Oct-09
                                                                                 Dec-09
                                                                                          Feb-10
                                                                                                   Apr-10
                                                                                                            Jun-10
                                                                                                                     Aug-10
                                                                                                                              Oct-10
                                                                                                                                       Dec-10
                                                                                                                                                Feb-11
                                                                                                                                                         Apr-11
                                                                                                                                                                  Jun-11
 Data source: Bureau of Labor Statistics

                                                                                                                                                                                   8/
                                                                                                                                                                                  GE /
                                                                                                                                                                      August 17, 2011
In ’’11, a complex path to lower rate expectations ……
                                     Expectation for 3m Libor - June 2013
                                     3m U.S. Libor
 3.0%
                                                               Apr: Europe's debt crisis worsens
                                                                 May & June: Weaker U.S. economic data
 2.5%                                                               July: U.S. budget impasse
                                 Mar 11:
                                 Tsunami            Apr 18:                                      Jul 8: June U.S.
 2.0%                           devastates      S&P lowered                                     employment data
                                  Japan         its long-term        May 2:                       disappoints
                                                 U.S. ratings       Oil falls                                     Jul 29:
 1.5%                                             outlook to                                                  Q2 U.S. GDP
                                                                    after bin
                                                   negative         Laden's                                    disappoints

 1.0%                                                                death

                                                                                  Aug 9: FOMC says conditions
                                                                                 warrant an exceptionally low fed
 0.5%
                                                                                  funds rate through mid -2013
             Data source: Bloomberg
 0.0%
        Jan-11


                       Feb-11


                                       Mar-11


                                                      Apr-11


                                                                        May-11


                                                                                       Jun-11


                                                                                                      Jul-11


                                                                                                                    Aug-11
                                                                                                                             9/
                                                                                                                            GE /
                                                                                                                August 17, 2011
Disinflation ends. Commodity surge hits a wall ……
                                 CRB Commodty Price Index
417                                    flat y-t-d- in 2011 as of Aug 17
                                                up 17% in 2010      End May '10 - end
                                                up 23% in 2009        Apr '11, + 45%
                                               down 36% in 2008
338


                                                                                               Since Apr
                                                                                                  '11
                                                                                               CRB - 10%
259
                                                                       Live cattle:   + 29%     - 1%
                                                                       Crude oil:     + 54%     - 23%
                                                                       Wheat:         + 68%     - 5%
                                                                       Corn:          + 110%    - 5%
                                                                       Cotton:        + 123%    - 39%
180
               Data source:
      Aug-08


                              Mar-09


                                                Oct-09


                                                              May-10


                                                                                 Dec-10


                                                                                                Aug-11
               Bloomberg


                                                                                                                10 /
                                                                                                                GE /
                                                                                                    August 17, 2011
Watch gasoline, price direction reflects outlook ……
                     Avg U.S. retail gasoline price per gallon (right axis)
                     Wholesale gasoline - Nymex price (left axis)
  3.50                                                                                             4.10

  3.00
                                                                                                   3.60

  2.50
                                                                                                   3.10
  2.00
                                                                                                   2.60
  1.50

                                                                                                   2.10
  1.00


  0.50                                                                                             1.60
         Aug-08


                  Dec-08


                           Apr-09


                                    Aug-09


                                             Dec-09


                                                      Apr-10


                                                               Aug-10


                                                                        Dec-10


                                                                                 Apr-11


                                                                                          Aug-11
Data source: Nymex and DOE

                                                                                                         11 /
                                                                                                         GE /
                                                                                             August 17, 2011
Extraordinary stimulus remains key policy stance ……
              FOMC Statement –– August 9th
  •• Inflation: ““Recently, inflation has moderated as
  prices of energy and some commodities have declined
  from their earlier peaks.         Longer-term inflation
  expectations have remained stable””

  •• Economic conditions: ““Somewhat slower pace of
  recovery”” is expected over coming quarters compared
  to previous (June) estimates. ““Downside risks to the
  economic outlook have increased””

  •• Policy: Economic conditions are likely to warrant an
  ““exceptionally low”” fed funds rate ““at least through
  mid-2013””
                                                                 12 /
                                                                 GE /
                                                     August 17, 2011
Expectations for Libor fall dramatically ……
                               Expectation for 3m U.S. Libor
                               implied yield per futures market
                        17-Aug-11                31-Mar-11              31-Dec-10
                    with December             with December
                                                                                    5.17%
                     implied yields            implied yields             4.92%
 5.0%
                                                                4.50%
                                                  3.85%
 4.0%                                                                               3.61%
                                      3.00%                               3.18%
 3.0%
                                                                2.53%
                          1.95%
 2.0%                                             1.70%
            0.61%
            0.49%                     0.85%
 1.0%
                          0.46%

 0.0%
            Sep '11
            Dec '11
            Mar '12
            Jun '12
            Sep '12
            Dec '12
            Mar '13
            Jun '13
            Sep '13
            Dec '13
            Mar '14
            Jun '14
            Sep '14
            Dec '14
            Mar '15
            Jun '15
            Sep '15
            Dec '15
            Mar '16
            Jun '16
            Sep '16
            Dec '16
            Mar '17
            Jun '17
            Sep '17
            Dec '17
Data
source:
Bloomberg

                                                                                                13 /
                                                                                                GE /
                                                                                    August 17, 2011
Pass-through inflation pressures muted overall ……
                                          Consumer Price Index (yoy)
 10.0%                                    Producer Price Index (yoy)

 7.0%


 4.0%

 1.0%


 -2.0%


 -5.0%

                  Data source:
 -8.0%            Bureau of
         Jun-91


                                 Jun-95


                                                Jun-99


                                                           Jun-03


                                                                       Jun-07


                                                                                     Jun-11
                  Labor
                  Statistics

                                                                                            14 /
                                                                                            GE /
                                                                                August 17, 2011
Easing in gov’’t interest expense won’’t last ……
                               U.S. Public Debt ($ Tn's) - left axis
                               Interest Expense ($ Bn's) - right axis
   15
                Fiscal 2007 - 2010                                                                    460
                Public debt: + 51%
   13
            Annual interest expense: - 4%
                                                                                                      420
   11

                                                                                                      380
     9

                                                                                                      340
     7


     5                                                                                                300
          2000

                 2001

                        2002

                                2003

                                       2004

                                              2005

                                                     2006

                                                            2007

                                                                   2008

                                                                          2009

                                                                                 2010

                                                                                        2011 (*)
                                                                                                    Data source:
                                                                                                   U.S. Treasury
(*) Fiscal 2011: (based on Oct '10 - July '11 actual data plus estimate)
                                                                                                                15 /
                                                                                                                GE /
                                                                                                    August 17, 2011
But interest burden is still very manageable ……
           U.S. Gov't Interest Expense as a Percent of Nominal GDP
                                                     Fiscal Year (Sept) Comparison
  4.7%


  4.2%


                                                                                                              (*) 2011 Estimate - End Sept '11:
  3.6%                                                                                                            Nominal GDP = $15.083 Tn
                                                                                                                Interest expense = $462.5 Bn


  3.1%


  2.5%
           1989
                  1990
                         1991
                                1992
                                       1993
                                              1994
                                                     1995
                                                            1996
                                                                   1997
                                                                          1998
                                                                                 1999
                                                                                        2000
                                                                                               2001
                                                                                                      2002
                                                                                                             2003
                                                                                                                    2004
                                                                                                                           2005
                                                                                                                                  2006
                                                                                                                                         2007
                                                                                                                                                2008
                                                                                                                                                       2009
                                                                                                                                                              2010
                                                                                                                                                                     2011 (*)
Data sources: U.S. Treasury and Bureau of Economic Analysis

                                                                                                                                                                           16 /
                                                                                                                                                                           GE /
                                                                                                                                                               August 17, 2011
Fortunately, foreign demand for Treasurys holds up ……
                      Foreign Holdings of U.S. Treasurys
                                     in trillions of dollars
 4.52                                                                      Up 11% yoy Jun (*)
                                                                           vs
                                                                           Up 20% in '10
 3.80
                                                                           vs
                                                                           Up 20% in '09
 3.08


 2.36


 1.64                               Top 2 Foreign Holders as of June '11
                           1. China @ $1,166 bn, + 5% yoy - was + 71% yoy in Jul '09
                           2. Japan @ $911 bn, + 14% yoy - was + 22% yoy in Dec '09
 0.92
        Oct-01


                 Oct-03


                            Aug-05


                                            Aug-07


                                                         Jul-09


                                                                  Jun-11
                                                                             Data source:
                                                                             U.S. Treasury

                                                                                                     17 /
                                                                                                     GE /
                                                                                         August 17, 2011
Economic composition –– U.S. GDP ……
                        Gov't         Q2 2011 U.S.
                      spending,        Real GDP
                    18.9% vs 18.4%
                                       Breakout
                        Q4 '07
   Net exports,
  -3.1% vs -4.2%
      Q4 '07


    Private
 investment,
13.4% vs 15.9%
    Q4 '07
                                        Personal
                                      consumption,
                                      70.7% vs 70%
 Data source: BEA                        Q4 '07

                                                          18 /
                                                          GE /
                                              August 17, 2011
Consumption trend has stalled ……
                     U.S. Real Personal Consumption Expenditures
                                                          yoy change
                                                          3-month change - annualized
 4.3%

 3.3%

 2.3%

 1.3%

 0.3%

-0.7%

-1.7%

-2.7%
          Nov-09

                   Dec-09

                            Jan-10

                                     Feb-10
                                              Mar-10

                                                       Apr-10

                                                                May-10

                                                                         Jun-10
                                                                                  Jul-10

                                                                                           Aug-10

                                                                                                    Sep-10

                                                                                                             Oct-10
                                                                                                                      Nov-10

                                                                                                                               Dec-10

                                                                                                                                        Jan-11

                                                                                                                                                 Feb-11
                                                                                                                                                          Mar-11

                                                                                                                                                                   Apr-11
                                                                                                                                                                            May-11

                                                                                                                                                                                     Jun-11
Data source: Bureau of Economic Analysis

                                                                                                                                                                                         19 /
                                                                                                                                                                                         GE /
                                                                                                                                                                             August 17, 2011
Amid unimpressive payroll gains ……
                                      Monthly Change in Private Payrolls
                                      Monthly Change in Nonfarm Payrolls
                                                              in 000's
460                                                                                                         Past 12 months

242

 23

-195

-413                                                                                                       Private: + 1.8 mn
                                                                                                          Headline: + 1.3 mn
-632       Data source:
           Bureau of
           Labor Statistics
-850
       Jan-08

                Apr-08

                         Jul-08

                                  Oct-08

                                           Jan-09

                                                    Apr-09

                                                             Jul-09

                                                                      Oct-09

                                                                               Jan-10

                                                                                        Apr-10

                                                                                                 Jul-10

                                                                                                           Oct-10

                                                                                                                    Jan-11

                                                                                                                             Apr-11

                                                                                                                                        Jul-11
                                                                                                                                           20 /
                                                                                                                                           GE /
                                                                                                                               August 17, 2011
While income improved, inflation saps wages ……
                     U.S. Personal Income (yoy)
                     Real Personal Income Less Transfer Payments (yoy)
                     Real Wages (yoy)
7.0%

5.0%

3.0%

1.0%

-1.0%

-3.0%

-5.0%

-7.0%
             Data source: Bureau of Economic Analysis
-9.0%
        Jun-07


                       Dec-07


                                    Jun-08


                                                 Dec-08


                                                          Jun-09


                                                                   Dec-09


                                                                            Jun-10


                                                                                     Dec-10


                                                                                                       Jun-11
                                                                                                          21 /
                                                                                                          GE /
                                                                                              August 17, 2011
Watch import prices from China ……
                                U.S. Import Prices from China
  6%                                      y-o-y change
                                                                      July '11
  4%                                                                 +3.5% yoy


  2%        Through early '07, the
               U.S. imported
            deflation from China
  0%


 -2%


 -4%
       Aug-05


                                 Feb-07


                                                Aug-08


                                                            Jan-10


                                                                              Jul-11
Data source: Bureau of Labor Statistics

                                                                                    22 /
                                                                                    GE /
                                                                        August 17, 2011
Consumers take on some more borrowing ……
                            U.S. Consumer Credit, Ex-Real Estate ($ Bn's)
 20                         3-Month Average
                                                                               Largest increase
                                              Monthly Change                      in 4 years

 10


 0


-10


-20        Data source: Federal Reserve
      Jun-07


                   Dec-07


                                Jun-08


                                          Dec-08


                                                    Jun-09


                                                             Dec-09


                                                                      Jun-10


                                                                                  Dec-10


                                                                                                 Jun-11
                                                                                                       23 /
                                                                                                       GE /
                                                                                           August 17, 2011
Investment growth trend is moderating ……
                 Change in Real Private Business Investment
                                  Quarterly outcome - annualized
                                  Half year outcome - annualized
 18%

  8%

 -2%

 -12%

 -22%

 -32%

 -42%
        Jun-01


                         Jun-03


                                            Jun-05


                                                     Jun-07


                                                                   Jun-09


                                                                                    Jun-11
 Data source: Bureau of Economic Analysis

                                                                                        24 /
                                                                                        GE /
                                                                            August 17, 2011
Key ‘‘services’’ sector gauge signals modest growth ……
                           ISM non-manufacturing index (left axis)
                           Non-manufact employment sub-index (right axis)
60                                                                                       56


54            above 50 (left axis index) signals                                         49
                 service sector expansion


48                                                                                       43


42                                                                                       36


36                                                                                       30
     Jan-09


                               Jul-09


                                               Jan-10


                                                        Jul-10


                                                                  Jan-11


                                                                                Jul-11
                Data source:
                Bloomberg


                                                                                        25 /
                                                                                        GE /
                                                                            August 17, 2011
While manufacturing sector expansion slows ……
                                    ISM manufacturing index (left axis)
                                    Prices paid for purchases (right axis)
62                                                                                                                          92
                                                                                                                 July
                                                                                                                 50.9
                       above 50 signals
55
                          expansion
                                                                                                                            67


47


                                                                                                                            41
40


32                                                                                                                          16
     Jul-08


              Oct-08


                       Jan-09


                                Apr-09


                                         Jul-09


                                                  Oct-09


                                                           Jan-10


                                                                    Apr-10


                                                                             Jul-10


                                                                                      Oct-10


                                                                                               Jan-11


                                                                                                        Apr-11


                                                                                                                  Jul-11
Data source: Bloomberg

                                                                                                                             26 /
                                                                                                                             GE /
                                                                                                                 August 17, 2011
Amid auto production adjustment ……
                             US Capacity Utilization - left axis
                             Cap U for Motor Vehicles - right axis
79%                                                                               68%


73%                                                                               49%


67%                                                                               30%
      Jul-08


                    Jan-09


                                  Jul-09


                                            Jan-10


                                                      Jul-10


                                                                Jan-11


                                                                         Jul-11
Data source: Federal Reserve
                                                                                     27 /
                                                                                     GE /
                                                                         August 17, 2011
Overall business inventory backdrop is favorable ……
                                     U.S. Inventory-to-Sales Ratio
1.72                                        number of months


1.59


                                                                          Q1 '09
1.46


1.33


                = Worst of U.S. recession                                  Q1 '11
1.20
       May-82


                                   Aug-89


                                                   Nov-96


                                                                 Feb-04


                                                                                    Jun-11
 Data source: U.S. Commerce Dept

                                                                                          28 /
                                                                                          GE /
                                                                              August 17, 2011
As is backdrop for private credit expansion ……
                                    Commercial and Industrial Loans
                                      at U.S. Commercial Banks
1.7                                            in trillions of dollars

1.5                                                        - Oct '08 peak: $1.62 tn
                                                           - Most recent: $1.28 tn
1.3                                                            Decrease: $340 bn

1.1                                                                                              Since
                                                                                              post crisis
                                                                                                low in
0.9                                                                                            Sep '10,
                                                                             Fed tightening
                                                                             cycle began      up $70 bn
0.7
                                 Fed tightening cycle began
0.5
      Dec-90


                                 Jan-95


                                                  Mar-99


                                                                    Apr-03


                                                                                     Jun-07


                                                                                                        Aug-11
               Data source:
               Federal Reserve


                                                                                                            29 /
                                                                                                            GE /
                                                                                                August 17, 2011
Still dealing with residential mortgage burden ……
                            U.S. Residential Mortgages Outstanding
                                       in trillions of dollars
                                                                          Peak: 10.6 tn
 10.7
                                                                          Q1 '08
                                                                                              10.0 tn


  8.0                                                                                              8.0 tn


                                                                                                   6.0 tn
  5.3                                                   Q3 '01
                                               Q4 '98

  2.7


  0.0
        Mar-80


                                   Dec-87


                                              Sep-95


                                                                 Jun-03


                                                                                          Mar-11
                 Data source:
                 Federal Reserve


                                                                                                      30 /
                                                                                                      GE /
                                                                                          August 17, 2011
And too many homes ……
         Ratio of U.S. Existing Housing Units to Number of U.S.
                               Households
1.110

1.105

1.100
1.095

1.090

1.085

1.080

1.075

1.070
          2000

                  2001

                          2002

                                  2003

                                          2004

                                                  2005

                                                          2006

                                                                  2007

                                                                          2008

                                                                                     2009

                                                                                            2010 (*)

                                                                                                            2011 (*)
(*) 2010 & 2011 estimated
Data source: U.S. Census Bureau. Estimates based on Census Bureau and nielsenw ire

                                                                                                                   31 /
                                                                                                                   GE /
                                                                                                       August 17, 2011
Causing home prices to fall ……
               U.S. Home Prices are 3% Below the 5-Year Average
                         and 20% Below July '06 Peak
231                                 Single Family Home Prices in $000's

               - Past 30 years, prices averaged 8%
               above the 5-year average
154
               - In June 2005, prices exceeded the 5-
               year average by 33%

 77

                                                                     Median Home Prices
           Data source: Nat'l Association of Realtors
                                                                     5 year moving average
  0
      Jul-69


                                 Jan-80


                                                        Jul-90


                                                                          Dec-00


                                                                                           Jun-11
                                                                                                 32 /
                                                                                                 GE /
                                                                                     August 17, 2011
In all, some moderate growth still expected ……
                                                                 U.S. Real GDP                                                  (*) Bloomberg
                                                                 1 year average                                                   consensus
                                                                                                                                   forecasts
 4.0%                                                                                                          1.3%
                                                                                                                               (Aug 12 survey)
                                                                                                                in
                                                                                                                Q2


                                                                                                                                                   %
                                                                                                                                       %


                                                                                                                                                              %
                                                                                                                           %


                                                                                                                                                2.2
                                                                                                                                    2.5


                                                                                                                                                           2.5
                                                                                                                        2.1
 0.8%


-2.5%


-5.8%


-9.0%
           Q3 '08

                    Q4 '08

                             Q1 '09

                                      Q2 '09

                                               Q3 '09

                                                        Q4 '09

                                                                  Q1 '10

                                                                           Q2 '10

                                                                                    Q3 '10

                                                                                             Q4 '10

                                                                                                      Q1 '11

                                                                                                               Q2 '11

                                                                                                                         Q3 '11 *

                                                                                                                                     Q4 '11 *

                                                                                                                                                Q1 '12 *

                                                                                                                                                           Q2 '12 *
Data source: Bureau of Economic Analysis
                                                                                                                                                                 33 /
                                                                                                                                                                 GE /
                                                                                                                                                     August 17, 2011
In summary
Near-term - 2011 & 2012
•• Policymakers focus on boosting near-term dynamics
•• U.S. real GDP subject to energy and equity prices
•• Equities vulnerable to extraordinary uncertainties
•• Fed’’s key focus is jobs - watch employment data

Beyond the moment
•• Budget deficit will force tough decisions on spending and taxes
•• Deeper fiscal erosion has risky inflation consequences
•• Less stimulus does not have to derail growth
                                                                         34 /
                                                                         GE /
                                                             August 17, 2011
Appendix


Answers to some recently asked questions


                                                       35 /
                                                       GE /
                                           August 17, 2011
Magnitude of U.S. fiscal deterioration post crisis ……

                                 Fiscal '10   Fiscal '08   Peak
Key budget receipts:
Individual Income Tax *          $ 899 bn     $ 1,146 bn   $ 1,163 bn '07
Corporate Income Tax             $ 191 bn     $ 304 bn     $ 370 bn '07

Key budget outlays:
Defense-Military                 $   667 bn   $ 595 bn     Fiscal '10
Health & Human Services          $   854 bn   $ 701 bn     Fiscal '10
Interest on Treas Debt           $   414 bn   $ 451 bn     $ 451 bn '08
Dept of Labor                    $   173 bn   $ 59 bn      Fiscal '10

Social Security                  $ 754 bn     $ 658 bn     Fiscal '10
Data source: www.fms.treas.gov


                                                                              36 /
                                                                              GE /
                                                                  August 17, 2011
How fiscal 2011 is shaping up for the US ……
        Individual income tax receipts up, corporate tax
           receipts near flat and total outlays higher
First 10 months of Fiscal ’’10 & ’’11 compared –– through July

                                   Fiscal 2011   Fiscal 2010
           Total receipts (*):     $1.893 Tn     $1.753 Tn
           Total outlays:          $2.993 Tn     $2.922 Tn
           Deficit:                $1.100 Tn     $1.169 Tn
  (*) includes:
  Indiv. income tax receipts: $0.891 Tn          $0.719 Tn
  Corp. income tax receipts: $0.141 Tn           $0.140 Tn
  Data source: www.fms.treas.gov
                                                                       37 /
                                                                       GE /
                                                           August 17, 2011
Average maturities for Treasury debt are rising ……
               Average Maturity of Total Outstanding Marketable
                       U.S. Treasury Debt - in months
                                                 past 10 years
 72
                                                                              Recent Comparison
                                                                               Jun '08: 56 months
                                                                               Jun '09: 51 months
 64                                                                            Jun '10: 58 months
                                                                               Jun '11: 62 months


 56


          Data source: U.S. Treasury
 48
      Jun-01


                 Jun-02


                           Jun-03


                                       Jun-04


                                                Jun-05


                                                         Jun-06


                                                                  Jun-07


                                                                           Jun-08


                                                                                    Jun-09


                                                                                             Jun-10


                                                                                                            Jun-11
                                                                                                                  38 /
                                                                                                                  GE /
                                                                                                      August 17, 2011
FOMC’’s views on a normalization policy ……
           Per Minutes of the June 21-22 FOMC Meeting

 1st step –– FOMC would likely first cease reinvesting some or all
     payments of maturing principal on its securities holdings

 2nd step –– At the same time or thereafter, the FOMC will modify its
     forward guidance on the path of the federal funds rate and will
     initiate temporary reserve-draining operations.

 3rd step –– When economic conditions warrant, the FOMC will begin
     raising its target fed funds rate, and from that point on, changing
     the target rate will be the primary means of adjusting monetary
     policy. During the normalization process, adjustments to interest
     rates on excess reserves and to the level of reserves will be used

 4th step –– Sales of agency securities from the Fed’’s balance sheet will
      likely begin sometime after the 1st fed funds rate increase
                                                                                39 /
                                                                                GE /
                                                                    August 17, 2011
After QE2, no buying & run-off would look like this ……
                   Fed's Balance Sheet - U.S. Treasury Holdings (*)
                                  Maturing Treasury Debt ($ Bn's) - left axis
$'s Bn                            Potential Treasury Balance ($ Tn's) - right axis            $'s Tn
   180                                                                                             1.65

                                                                                                   1.45
   150      Fed's Treasury balance
            Now: $1.63 Tn                                                                          1.25

   120                                                                                             1.05
            With run-off & no adds
            End 2018: $460 Bn                                                                      .85
     90
            (*) Includes Bills, Notes,                                                             .65
            Bonds and TIPS
     60                                                                                            .45

                                                                                                   .25
     30
                                                                                                   .05

       0                                                                                           -.15
                       mid-2011


                                     2011


                                            2012


                                                   2013


                                                          2014


                                                                 2015


                                                                        2016


                                                                               2017


                                                                                      2018
Data source:
Federal Reserve
& N.Y.Fed

                                                                                                         40 /
                                                                                                         GE /
                                                                                             August 17, 2011
State & local government tax receipts edge higher ……
                                  State & Local Tax Revenues
             Total: 4-qtr avg, annualized in Tn's (left axis)
             Individual income tax: 4-qtr avg, annualized in Bn's (right axis)
 $1.32                                                                                 $310

 $1.27                                                                                 $295

 $1.22
                                                                                       $280
 $1.17
                                                                                       $265
 $1.12
                                                                                       $250
 $1.07

 $1.02                                                                                 $235
           Sep-06


                         Jun-07


                                      Mar-08


                                               Dec-08


                                                        Sep-09


                                                                 Jun-10


                                                                          Mar-11
Data source: U.S. Census Bureau

                                                                                               41 /
                                                                                               GE /
                                                                                   August 17, 2011
Disclaimer
Disclaimer: This report is for information purposes only and is not intended as an offer, solicitation, or recommendation for the purchase or sale of a
financial instrument or to effect a transaction. The information contained within this report has been obtained from and is based upon sources believed
to be reliable. General Electric Capital Corporation and any of its affiliates (collectively ““GECC””) do not guarantee the accuracy or completeness of the
information and make no express or implied representations, but reasonable steps have been taken to determine the accuracy and completeness of the
information. All opinions, projections and estimates constitute the judgment of the author as of the date of the report and are subject to change without
notice. Market rates, valuations and availability of financial instruments also are subject to change without notice. Nothing contained within the materials
constitutes financial, legal, tax, accounting or other advice, nor should any investment or any other decisions be made solely based on this report. You
should obtain advice from qualified experts before making any investment decision. The GECC Interest Rate Management Team (““IRM””) acts solely in the
role of an arranger for interest rate management transactions, and is not and makes no representations to being an agent for or advisor to any party
involved, nor does IRM have any reporting, fiduciary or financial obligations to the parties.

This research report is produced separately from any other activity of GECC and was completed without access to non-public information that may have
been received by other units of GECC. This report may not be reproduced or redistributed in any form without prior written permission from GECC. The use
of this report in connection with the writing, marketing or promotion of any financial instruments, services or products is prohibited.


                                                                                                                                                          42 /
                                                                                                                                                          GE /
                                                                                                                                              August 17, 2011

Greater Uncertainty Threatens Expansion

  • 1.
    Greater Uncertainty ThreatensExpansion U.S. Economic Assessment & Interest Rate Outlook August 18, 2011 GE Capital, Americas Robert Podorefsky (617) 973-4091 1/ GE / August 17, 2011
  • 2.
    U.S. economy weakens…… Amid uncertainty and more policy risk Extraordinary factors contributed •• Inflation hurt demand, shortages from Japan impacted manufacturing, Q1 weather disrupted comps while unemployment and Washington’’s messy budget handling weakened confidence Key downside risk - financial market developments •• Market volatility –– raises business & consumer anxiety •• Unfavorable fiscal/geopolitical considerations –– Europe, Mid-East Key to maintaining expansion •• Continued government backstop ideology, contained oil prices Key challenges •• Housing sector and employment situation remain weak •• Federal budget ‘‘super committee’’ must find solutions to deficit 2/ GE / August 17, 2011
  • 3.
    Watch the negativeequity drivers …… Monthly Change in S&P 500 Equity Index U.S. household wealth fell $1.3 tn in Q2 '10, then up $4.0 tn thru Q1 '11 100 75 50 25 0 Australia -25 Up 30% thru Apr 30 began to China -50 after Bernanke tighten began to outlined "options for -75 tighten further easing" on -100 Fiscal & economic worries Aug 27, '10 -125 Apr May Jun Jul Aug Sep Oct Nov Dec Jan '10 Feb Mar Apr May Jun Jul Aug Sep Oct Nov Dec Jan '11 Feb Mar Apr May Jun Jul Aug so far Data source: Bloomberg and Federal Reserve 3/ GE / August 17, 2011
  • 4.
    Parallel crises dominatewhile impact varies …… Total Marketable Sovereign Debt in trillions of U.S. dollars 10 % of total that comes due through 2013 $9.34 Ireland = 18% Portugal = 32% 8 Greece = 33% Spain = 41% Italy = 36% 6 United States = 46% 4 $2.28 2 $0.92 $0.13 $0.20 $0.42 0 Ireland Portugal Greece Spain Italy United States Data source: Bloomberg 4/ GE / August 17, 2011
  • 5.
    Messy deficit debatedispirits the nation …… U.S. Federal Budget Gap 3.9 Gov't Spending in $Tn's Gov't Revenues in $Tn's 3.3 Fiscal year 2010 2.8 Outlays = $3.45 tn Revenues = $2.16 tn Deficit = $1.29 tn 2.2 1.7 1.1 White House estimate 2011 0.6 Data source: Outlays = $3.82 tn U.S. Treasury Revenues = $2.17 tn 0.0 1958 1962 1966 1970 1974 1978 1982 1986 1990 1994 1998 2002 2006 2010 5/ GE / August 17, 2011
  • 6.
    U.S. rate structurebenefits significantly …… U.S. Treasury Yields Compared Aug 16, 2011 Dec 31, 2010 4.33% 4.5% 3.67% 3.29% 2.22% 3.0% 2.01% 0.93% 1.5% 0.59% 0.12% 0.18% 0.01% 0.0% 3-month 2-year 5-year 10-year 30-year Data source: Bloomberg 6/ GE / August 17, 2011
  • 7.
    Public debt surged,will keep rising yet rates fell …… Marketable Treasury Debt Outstanding - $'s Tn's (left axis) 5-yr U.S. Treasury yield (right axis) Fed tightened 9.4 Since Q4 '07 6.5% The debt's more Fed tightened than doubled 5.5% 7.3 4.5% 5.2 3.5% 2.5% 3.2 1.5% 1.1 0.5% Aug-98 Nov-01 Feb-05 May-08 Aug-11 Data sources: U.S. Treasury and Bloomberg 7/ GE / August 17, 2011
  • 8.
    In ’’10, lessinflation eased transition to lower rates …… Headline U.S. CPI yoy (left axis) Core U.S. CPI yoy (right axis) 5.6% (June '11) 2.5% Headline: 3.6% yoy 4.0% Core: 1.6% yoy - highest since Jan '10 1.9% 2.5% 1.0% 1.2% -0.6% -2.1% 0.6% Aug-08 Oct-08 Dec-08 Feb-09 Apr-09 Jun-09 Aug-09 Oct-09 Dec-09 Feb-10 Apr-10 Jun-10 Aug-10 Oct-10 Dec-10 Feb-11 Apr-11 Jun-11 Data source: Bureau of Labor Statistics 8/ GE / August 17, 2011
  • 9.
    In ’’11, acomplex path to lower rate expectations …… Expectation for 3m Libor - June 2013 3m U.S. Libor 3.0% Apr: Europe's debt crisis worsens May & June: Weaker U.S. economic data 2.5% July: U.S. budget impasse Mar 11: Tsunami Apr 18: Jul 8: June U.S. 2.0% devastates S&P lowered employment data Japan its long-term May 2: disappoints U.S. ratings Oil falls Jul 29: 1.5% outlook to Q2 U.S. GDP after bin negative Laden's disappoints 1.0% death Aug 9: FOMC says conditions warrant an exceptionally low fed 0.5% funds rate through mid -2013 Data source: Bloomberg 0.0% Jan-11 Feb-11 Mar-11 Apr-11 May-11 Jun-11 Jul-11 Aug-11 9/ GE / August 17, 2011
  • 10.
    Disinflation ends. Commoditysurge hits a wall …… CRB Commodty Price Index 417 flat y-t-d- in 2011 as of Aug 17 up 17% in 2010 End May '10 - end up 23% in 2009 Apr '11, + 45% down 36% in 2008 338 Since Apr '11 CRB - 10% 259 Live cattle: + 29% - 1% Crude oil: + 54% - 23% Wheat: + 68% - 5% Corn: + 110% - 5% Cotton: + 123% - 39% 180 Data source: Aug-08 Mar-09 Oct-09 May-10 Dec-10 Aug-11 Bloomberg 10 / GE / August 17, 2011
  • 11.
    Watch gasoline, pricedirection reflects outlook …… Avg U.S. retail gasoline price per gallon (right axis) Wholesale gasoline - Nymex price (left axis) 3.50 4.10 3.00 3.60 2.50 3.10 2.00 2.60 1.50 2.10 1.00 0.50 1.60 Aug-08 Dec-08 Apr-09 Aug-09 Dec-09 Apr-10 Aug-10 Dec-10 Apr-11 Aug-11 Data source: Nymex and DOE 11 / GE / August 17, 2011
  • 12.
    Extraordinary stimulus remainskey policy stance …… FOMC Statement –– August 9th •• Inflation: ““Recently, inflation has moderated as prices of energy and some commodities have declined from their earlier peaks. Longer-term inflation expectations have remained stable”” •• Economic conditions: ““Somewhat slower pace of recovery”” is expected over coming quarters compared to previous (June) estimates. ““Downside risks to the economic outlook have increased”” •• Policy: Economic conditions are likely to warrant an ““exceptionally low”” fed funds rate ““at least through mid-2013”” 12 / GE / August 17, 2011
  • 13.
    Expectations for Liborfall dramatically …… Expectation for 3m U.S. Libor implied yield per futures market 17-Aug-11 31-Mar-11 31-Dec-10 with December with December 5.17% implied yields implied yields 4.92% 5.0% 4.50% 3.85% 4.0% 3.61% 3.00% 3.18% 3.0% 2.53% 1.95% 2.0% 1.70% 0.61% 0.49% 0.85% 1.0% 0.46% 0.0% Sep '11 Dec '11 Mar '12 Jun '12 Sep '12 Dec '12 Mar '13 Jun '13 Sep '13 Dec '13 Mar '14 Jun '14 Sep '14 Dec '14 Mar '15 Jun '15 Sep '15 Dec '15 Mar '16 Jun '16 Sep '16 Dec '16 Mar '17 Jun '17 Sep '17 Dec '17 Data source: Bloomberg 13 / GE / August 17, 2011
  • 14.
    Pass-through inflation pressuresmuted overall …… Consumer Price Index (yoy) 10.0% Producer Price Index (yoy) 7.0% 4.0% 1.0% -2.0% -5.0% Data source: -8.0% Bureau of Jun-91 Jun-95 Jun-99 Jun-03 Jun-07 Jun-11 Labor Statistics 14 / GE / August 17, 2011
  • 15.
    Easing in gov’’tinterest expense won’’t last …… U.S. Public Debt ($ Tn's) - left axis Interest Expense ($ Bn's) - right axis 15 Fiscal 2007 - 2010 460 Public debt: + 51% 13 Annual interest expense: - 4% 420 11 380 9 340 7 5 300 2000 2001 2002 2003 2004 2005 2006 2007 2008 2009 2010 2011 (*) Data source: U.S. Treasury (*) Fiscal 2011: (based on Oct '10 - July '11 actual data plus estimate) 15 / GE / August 17, 2011
  • 16.
    But interest burdenis still very manageable …… U.S. Gov't Interest Expense as a Percent of Nominal GDP Fiscal Year (Sept) Comparison 4.7% 4.2% (*) 2011 Estimate - End Sept '11: 3.6% Nominal GDP = $15.083 Tn Interest expense = $462.5 Bn 3.1% 2.5% 1989 1990 1991 1992 1993 1994 1995 1996 1997 1998 1999 2000 2001 2002 2003 2004 2005 2006 2007 2008 2009 2010 2011 (*) Data sources: U.S. Treasury and Bureau of Economic Analysis 16 / GE / August 17, 2011
  • 17.
    Fortunately, foreign demandfor Treasurys holds up …… Foreign Holdings of U.S. Treasurys in trillions of dollars 4.52 Up 11% yoy Jun (*) vs Up 20% in '10 3.80 vs Up 20% in '09 3.08 2.36 1.64 Top 2 Foreign Holders as of June '11 1. China @ $1,166 bn, + 5% yoy - was + 71% yoy in Jul '09 2. Japan @ $911 bn, + 14% yoy - was + 22% yoy in Dec '09 0.92 Oct-01 Oct-03 Aug-05 Aug-07 Jul-09 Jun-11 Data source: U.S. Treasury 17 / GE / August 17, 2011
  • 18.
    Economic composition ––U.S. GDP …… Gov't Q2 2011 U.S. spending, Real GDP 18.9% vs 18.4% Breakout Q4 '07 Net exports, -3.1% vs -4.2% Q4 '07 Private investment, 13.4% vs 15.9% Q4 '07 Personal consumption, 70.7% vs 70% Data source: BEA Q4 '07 18 / GE / August 17, 2011
  • 19.
    Consumption trend hasstalled …… U.S. Real Personal Consumption Expenditures yoy change 3-month change - annualized 4.3% 3.3% 2.3% 1.3% 0.3% -0.7% -1.7% -2.7% Nov-09 Dec-09 Jan-10 Feb-10 Mar-10 Apr-10 May-10 Jun-10 Jul-10 Aug-10 Sep-10 Oct-10 Nov-10 Dec-10 Jan-11 Feb-11 Mar-11 Apr-11 May-11 Jun-11 Data source: Bureau of Economic Analysis 19 / GE / August 17, 2011
  • 20.
    Amid unimpressive payrollgains …… Monthly Change in Private Payrolls Monthly Change in Nonfarm Payrolls in 000's 460 Past 12 months 242 23 -195 -413 Private: + 1.8 mn Headline: + 1.3 mn -632 Data source: Bureau of Labor Statistics -850 Jan-08 Apr-08 Jul-08 Oct-08 Jan-09 Apr-09 Jul-09 Oct-09 Jan-10 Apr-10 Jul-10 Oct-10 Jan-11 Apr-11 Jul-11 20 / GE / August 17, 2011
  • 21.
    While income improved,inflation saps wages …… U.S. Personal Income (yoy) Real Personal Income Less Transfer Payments (yoy) Real Wages (yoy) 7.0% 5.0% 3.0% 1.0% -1.0% -3.0% -5.0% -7.0% Data source: Bureau of Economic Analysis -9.0% Jun-07 Dec-07 Jun-08 Dec-08 Jun-09 Dec-09 Jun-10 Dec-10 Jun-11 21 / GE / August 17, 2011
  • 22.
    Watch import pricesfrom China …… U.S. Import Prices from China 6% y-o-y change July '11 4% +3.5% yoy 2% Through early '07, the U.S. imported deflation from China 0% -2% -4% Aug-05 Feb-07 Aug-08 Jan-10 Jul-11 Data source: Bureau of Labor Statistics 22 / GE / August 17, 2011
  • 23.
    Consumers take onsome more borrowing …… U.S. Consumer Credit, Ex-Real Estate ($ Bn's) 20 3-Month Average Largest increase Monthly Change in 4 years 10 0 -10 -20 Data source: Federal Reserve Jun-07 Dec-07 Jun-08 Dec-08 Jun-09 Dec-09 Jun-10 Dec-10 Jun-11 23 / GE / August 17, 2011
  • 24.
    Investment growth trendis moderating …… Change in Real Private Business Investment Quarterly outcome - annualized Half year outcome - annualized 18% 8% -2% -12% -22% -32% -42% Jun-01 Jun-03 Jun-05 Jun-07 Jun-09 Jun-11 Data source: Bureau of Economic Analysis 24 / GE / August 17, 2011
  • 25.
    Key ‘‘services’’ sectorgauge signals modest growth …… ISM non-manufacturing index (left axis) Non-manufact employment sub-index (right axis) 60 56 54 above 50 (left axis index) signals 49 service sector expansion 48 43 42 36 36 30 Jan-09 Jul-09 Jan-10 Jul-10 Jan-11 Jul-11 Data source: Bloomberg 25 / GE / August 17, 2011
  • 26.
    While manufacturing sectorexpansion slows …… ISM manufacturing index (left axis) Prices paid for purchases (right axis) 62 92 July 50.9 above 50 signals 55 expansion 67 47 41 40 32 16 Jul-08 Oct-08 Jan-09 Apr-09 Jul-09 Oct-09 Jan-10 Apr-10 Jul-10 Oct-10 Jan-11 Apr-11 Jul-11 Data source: Bloomberg 26 / GE / August 17, 2011
  • 27.
    Amid auto productionadjustment …… US Capacity Utilization - left axis Cap U for Motor Vehicles - right axis 79% 68% 73% 49% 67% 30% Jul-08 Jan-09 Jul-09 Jan-10 Jul-10 Jan-11 Jul-11 Data source: Federal Reserve 27 / GE / August 17, 2011
  • 28.
    Overall business inventorybackdrop is favorable …… U.S. Inventory-to-Sales Ratio 1.72 number of months 1.59 Q1 '09 1.46 1.33 = Worst of U.S. recession Q1 '11 1.20 May-82 Aug-89 Nov-96 Feb-04 Jun-11 Data source: U.S. Commerce Dept 28 / GE / August 17, 2011
  • 29.
    As is backdropfor private credit expansion …… Commercial and Industrial Loans at U.S. Commercial Banks 1.7 in trillions of dollars 1.5 - Oct '08 peak: $1.62 tn - Most recent: $1.28 tn 1.3 Decrease: $340 bn 1.1 Since post crisis low in 0.9 Sep '10, Fed tightening cycle began up $70 bn 0.7 Fed tightening cycle began 0.5 Dec-90 Jan-95 Mar-99 Apr-03 Jun-07 Aug-11 Data source: Federal Reserve 29 / GE / August 17, 2011
  • 30.
    Still dealing withresidential mortgage burden …… U.S. Residential Mortgages Outstanding in trillions of dollars Peak: 10.6 tn 10.7 Q1 '08 10.0 tn 8.0 8.0 tn 6.0 tn 5.3 Q3 '01 Q4 '98 2.7 0.0 Mar-80 Dec-87 Sep-95 Jun-03 Mar-11 Data source: Federal Reserve 30 / GE / August 17, 2011
  • 31.
    And too manyhomes …… Ratio of U.S. Existing Housing Units to Number of U.S. Households 1.110 1.105 1.100 1.095 1.090 1.085 1.080 1.075 1.070 2000 2001 2002 2003 2004 2005 2006 2007 2008 2009 2010 (*) 2011 (*) (*) 2010 & 2011 estimated Data source: U.S. Census Bureau. Estimates based on Census Bureau and nielsenw ire 31 / GE / August 17, 2011
  • 32.
    Causing home pricesto fall …… U.S. Home Prices are 3% Below the 5-Year Average and 20% Below July '06 Peak 231 Single Family Home Prices in $000's - Past 30 years, prices averaged 8% above the 5-year average 154 - In June 2005, prices exceeded the 5- year average by 33% 77 Median Home Prices Data source: Nat'l Association of Realtors 5 year moving average 0 Jul-69 Jan-80 Jul-90 Dec-00 Jun-11 32 / GE / August 17, 2011
  • 33.
    In all, somemoderate growth still expected …… U.S. Real GDP (*) Bloomberg 1 year average consensus forecasts 4.0% 1.3% (Aug 12 survey) in Q2 % % % % 2.2 2.5 2.5 2.1 0.8% -2.5% -5.8% -9.0% Q3 '08 Q4 '08 Q1 '09 Q2 '09 Q3 '09 Q4 '09 Q1 '10 Q2 '10 Q3 '10 Q4 '10 Q1 '11 Q2 '11 Q3 '11 * Q4 '11 * Q1 '12 * Q2 '12 * Data source: Bureau of Economic Analysis 33 / GE / August 17, 2011
  • 34.
    In summary Near-term -2011 & 2012 •• Policymakers focus on boosting near-term dynamics •• U.S. real GDP subject to energy and equity prices •• Equities vulnerable to extraordinary uncertainties •• Fed’’s key focus is jobs - watch employment data Beyond the moment •• Budget deficit will force tough decisions on spending and taxes •• Deeper fiscal erosion has risky inflation consequences •• Less stimulus does not have to derail growth 34 / GE / August 17, 2011
  • 35.
    Appendix Answers to somerecently asked questions 35 / GE / August 17, 2011
  • 36.
    Magnitude of U.S.fiscal deterioration post crisis …… Fiscal '10 Fiscal '08 Peak Key budget receipts: Individual Income Tax * $ 899 bn $ 1,146 bn $ 1,163 bn '07 Corporate Income Tax $ 191 bn $ 304 bn $ 370 bn '07 Key budget outlays: Defense-Military $ 667 bn $ 595 bn Fiscal '10 Health & Human Services $ 854 bn $ 701 bn Fiscal '10 Interest on Treas Debt $ 414 bn $ 451 bn $ 451 bn '08 Dept of Labor $ 173 bn $ 59 bn Fiscal '10 Social Security $ 754 bn $ 658 bn Fiscal '10 Data source: www.fms.treas.gov 36 / GE / August 17, 2011
  • 37.
    How fiscal 2011is shaping up for the US …… Individual income tax receipts up, corporate tax receipts near flat and total outlays higher First 10 months of Fiscal ’’10 & ’’11 compared –– through July Fiscal 2011 Fiscal 2010 Total receipts (*): $1.893 Tn $1.753 Tn Total outlays: $2.993 Tn $2.922 Tn Deficit: $1.100 Tn $1.169 Tn (*) includes: Indiv. income tax receipts: $0.891 Tn $0.719 Tn Corp. income tax receipts: $0.141 Tn $0.140 Tn Data source: www.fms.treas.gov 37 / GE / August 17, 2011
  • 38.
    Average maturities forTreasury debt are rising …… Average Maturity of Total Outstanding Marketable U.S. Treasury Debt - in months past 10 years 72 Recent Comparison Jun '08: 56 months Jun '09: 51 months 64 Jun '10: 58 months Jun '11: 62 months 56 Data source: U.S. Treasury 48 Jun-01 Jun-02 Jun-03 Jun-04 Jun-05 Jun-06 Jun-07 Jun-08 Jun-09 Jun-10 Jun-11 38 / GE / August 17, 2011
  • 39.
    FOMC’’s views ona normalization policy …… Per Minutes of the June 21-22 FOMC Meeting 1st step –– FOMC would likely first cease reinvesting some or all payments of maturing principal on its securities holdings 2nd step –– At the same time or thereafter, the FOMC will modify its forward guidance on the path of the federal funds rate and will initiate temporary reserve-draining operations. 3rd step –– When economic conditions warrant, the FOMC will begin raising its target fed funds rate, and from that point on, changing the target rate will be the primary means of adjusting monetary policy. During the normalization process, adjustments to interest rates on excess reserves and to the level of reserves will be used 4th step –– Sales of agency securities from the Fed’’s balance sheet will likely begin sometime after the 1st fed funds rate increase 39 / GE / August 17, 2011
  • 40.
    After QE2, nobuying & run-off would look like this …… Fed's Balance Sheet - U.S. Treasury Holdings (*) Maturing Treasury Debt ($ Bn's) - left axis $'s Bn Potential Treasury Balance ($ Tn's) - right axis $'s Tn 180 1.65 1.45 150 Fed's Treasury balance Now: $1.63 Tn 1.25 120 1.05 With run-off & no adds End 2018: $460 Bn .85 90 (*) Includes Bills, Notes, .65 Bonds and TIPS 60 .45 .25 30 .05 0 -.15 mid-2011 2011 2012 2013 2014 2015 2016 2017 2018 Data source: Federal Reserve & N.Y.Fed 40 / GE / August 17, 2011
  • 41.
    State & localgovernment tax receipts edge higher …… State & Local Tax Revenues Total: 4-qtr avg, annualized in Tn's (left axis) Individual income tax: 4-qtr avg, annualized in Bn's (right axis) $1.32 $310 $1.27 $295 $1.22 $280 $1.17 $265 $1.12 $250 $1.07 $1.02 $235 Sep-06 Jun-07 Mar-08 Dec-08 Sep-09 Jun-10 Mar-11 Data source: U.S. Census Bureau 41 / GE / August 17, 2011
  • 42.
    Disclaimer Disclaimer: This reportis for information purposes only and is not intended as an offer, solicitation, or recommendation for the purchase or sale of a financial instrument or to effect a transaction. The information contained within this report has been obtained from and is based upon sources believed to be reliable. General Electric Capital Corporation and any of its affiliates (collectively ““GECC””) do not guarantee the accuracy or completeness of the information and make no express or implied representations, but reasonable steps have been taken to determine the accuracy and completeness of the information. All opinions, projections and estimates constitute the judgment of the author as of the date of the report and are subject to change without notice. Market rates, valuations and availability of financial instruments also are subject to change without notice. Nothing contained within the materials constitutes financial, legal, tax, accounting or other advice, nor should any investment or any other decisions be made solely based on this report. You should obtain advice from qualified experts before making any investment decision. The GECC Interest Rate Management Team (““IRM””) acts solely in the role of an arranger for interest rate management transactions, and is not and makes no representations to being an agent for or advisor to any party involved, nor does IRM have any reporting, fiduciary or financial obligations to the parties. This research report is produced separately from any other activity of GECC and was completed without access to non-public information that may have been received by other units of GECC. This report may not be reproduced or redistributed in any form without prior written permission from GECC. The use of this report in connection with the writing, marketing or promotion of any financial instruments, services or products is prohibited. 42 / GE / August 17, 2011