1. Foreclosures have declined for almost three years after peaking in 2008. However, short sales continue to be common as lenders work with borrowers. The short sale cycle may continue for 2-5 more years before a normal market trend returns.
2. The ratio of home listings to sales indicates the market may drift into oversupply in the second half of 2010 if current trends continue, potentially leading to more foreclosures and short sales.
3. While average home prices have increased in the first half of 2010, particularly for higher-end homes, prices have actually declined in many individual areas. Average prices should only be used as a general guide, not to assess specific markets or properties.
Philadelphia House Price Indices, 2011 Q1
Philadelphia’s Decline in House Values Slows Significantly in Q1 . . . House prices decline 1.3% in 2011 Q1.
Following several consecutive quarters of sharp price declines, the Philadelphia housing market appeared to have tapped the brakes this past winter.
The typical Philadelphia home fell in value by an average of 1.3% on a quality- and seasonally- adjusted basis this past winter, according to the latest data from the City’s Recorder of Deeds. This comes after several consecutive quarters in which price declines totaled nearly 9% following the expiration of the Federal homebuyer tax credit last spring. And, while the winter season is normally a down period for both home sales and prices, this winter’s price decline is the smallest since 2007. With this most recent decrease, the average Philadelphia home has now fallen in value by a cumulative total of 16% since the bursting of the national housing bubble several years ago. Philadelphia’s house values have now reverted back to 2005 levels. (April 25, 2011)
Leslie Appleton Young, CAR Chief Economist, spoke at the Real Living Lifestyles New Year, New You Real Estate Symposium on January 31, 2012. She shared her economic forecast for the coming year, and all of the latest charts and stats on the California economy.
Leslie Appleton-Young, Chief Economist/California Association of Realtors presents his annual report to the California Desert Association of Realtors.
The Palm Springs desert area (Coachella Valley) housing market is on the upswing once again.
Rosemarie Anderson, Federal Highway Administration, shared information about addressing rural road safety in this session at the 2012 National Rural Transportation Peer Learning Conference, April 25-27 in Burlington, VT.
California Association of Realtors presentation by Oscar Wei, senior researcher at the CA Community College Real Estate Educators' Conference - Hilton, Oakland Airport. Friday, April 20, 2012
The CEO’s Dilemma - How to drive efficient innovation in the organizationJoeBarkai
Product organizations spend considerable effort and resources on innovation. However, many companies are engages in unfocused and inefficient innovation that does not support the company\'s strategic vision. In fact, many companies seem to engage in innovation for innovation sake and can be characterized as reckless innovators. This presentation discusses the role of lean and efficient innovation and how successful companies focus innovation to help connect business strategy to execution.
Smallholders represent a significant portion (38%) of oil palm cultivation in Indonesia, and represent a critical component of the palm oil industry, as well as constitute a significant opportunity to improve livelihoods in resource-poor settings. Smallholders’ engagement in oil palm cultivation began as part of Indonesian government to promote tree plantation crops in the late 1970s. The initial programme consisted basically of direct state investments through state-owned companies (PTPN) and was integrated with government-sponsored transmigration programmes to provide a labor force for the new plantations. This integration was embryonic for smallholder engagement in state-led agribusiness. The emergence of smallholder oil palm planters constituted a spread effect of plantation development led by the government. The state agribusiness-driven policy has transformed rural areas and settlement development was started in the surrounding of large-scale oil palm plantation.
3.4 other considerations before trading internationallyRawVix
1. Responsibility to stakeholders
Ethical decisions as to what and where to manufacture, balance between
capital and labour, where to sell, pay and working conditions, environmental
factors, for example emissions, waste disposal. Potential conflicts of socially
responsible and ethical behaviour with profit-based and other objectives.
2. Social/cultural differences in doing business
Different promotional message for different countries, international branding, distribution channel, joint ventures, pricing strategy for different countries.
3. The purpose of tariffs, laws, import quotas.
Why tariffs, laws or import quotas are used, for example to protect domestic industries or balance of trade. Constraints on businesses that these barriers provide.
Shuai HE, Saini YANG, Jiayuan YE
State Key Laboratory of Earth Surface Processes and Resource Ecology, Beijing Normal University, Beijing 100875, China
By Derek Byerlee. Presented at the ASTI-FARA conference Agricultural R&D: Investing in Africa's Future: Analyzing Trends, Challenges, and Opportunities - Accra, Ghana on December 5-7, 2011. http://www.asti.cgiar.org/2011conf
Sustainability in its shortest definition is the capacity to endure. To endure one does not only need material goods, but also a mental and spiritual resilience and set of skills on how to cope. When the quality and quantity of our material goods and biophysical environment starts to change, when our fellow South Africans are sick and dying prematurely and when our economy does not deliver the needed health and wealth to all of us, our hope for a better future is severely tested. It is the integrity of our hope that could and should be playing a fundamental role in a possible transition towards sustainability.
In this talk ladies and gentleman, the question of South Africa’s sustainability is under scrutiny. I will first show you that from an ecological, from a human well-being, and even from an economic perspective there are several warning lights on the biophysical and material sustainability of this country. I will also show the remarkable optimism we have as South Africans and highlight the importance of hope. Third, and finally I will argue that we as humans have an ethical responsibility in the individual and collective choices we make. It is our attitudes and behaviours that sustain or destroy.
There is a growing sense of urgency for bipartisan commitment to restoring America's competitive edge through innovation. How can we find the right mix of private sector dynamism and government support, as well as the political consensus required, to stay ahead of global competition and boost long-term prosperity?
April 2009 Philadelphia Housing MarketRajeev Sajja
Philadelphia Housing Market - Should I Buy?
By Kevin C Gillen Ph.D
Kevin Gillen is a respected source of real estate information for the Philadelphia area, was asked to prepare a report on the Philadelphia housing market for Mayor Nutter. It will be used at a city-wide housing fair. His report was made available to Prudential Fox & Roach, Realtors
Similar to MyTownCryer Mid Year 2010 Analysis (20)
AVERAGE PRICE AND TRANSACTION COUNT FOR HIGHLANDS RANCH COLORADO 2010Tom Cryer
The document attached offers a look in on the average price trend and transaction count numbers for Highlands Ranch, Colorado for the last three years as of 05-2010.
During the war years President Franklin Delano Roosevelt once said that a nation of homeowners is unconquerable. Margaret Thatcher, with a mantra that homeowners become responsible citizens, privatized and moved 1.7 million families from public housing into private ownership. President Bill Clinton has stated his belief that homeownership and decent housing are an essential part of the American Dream and wanted to make the dream of homeownership a reality for all Americans. President George W. Bush has said ownership has the power to transform people. Thus, the promotion of homeownership has been an integral part of President Bush’s vision of an “ownership society.” Even in the earliest days of civilization, before the collection and touting of statistical data, Aristotle had argued that ownership promotes virtue and responsibility.
Weekly Economic Financial Commentary March 26, 2010Tom Cryer
Public policy dominated this week, with the passage of health-care reform and confirmation the social security system would run into deficit this year contributing to disappointing Treasury auctions and higher bond yields.
2009 Us Corporate Relocation Benchmarking SurveyTom Cryer
2009 U.S. Corporate Relocation Benchmarking Survey
This pulse survey on relocation assistance provided to employees relocated within the U.S. is based on data collected in April 2009. Of the 816 member organizations invited to participate in the online survey, 182 responded—a 22 percent response rate. Data pertains to employees relocated domestically within the U.S.
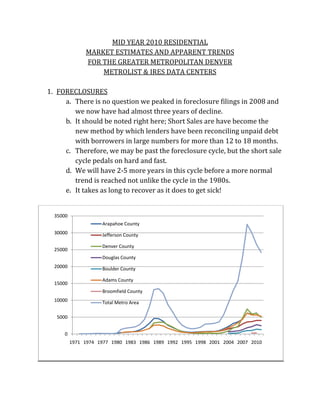
1. MID YEAR 2010 RESIDENTIAL
MARKET ESTIMATES AND APPARENT TRENDS
FOR THE GREATER METROPOLITAN DENVER
METROLIST & IRES DATA CENTERS
1. FORECLOSURES
a. There is no question we peaked in foreclosure filings in 2008 and
we now have had almost three years of decline.
b. It should be noted right here; Short Sales are have become the
new method by which lenders have been reconciling unpaid debt
with borrowers in large numbers for more than 12 to 18 months.
c. Therefore, we may be past the foreclosure cycle, but the short sale
cycle pedals on hard and fast.
d. We will have 2‐5 more years in this cycle before a more normal
trend is reached not unlike the cycle in the 1980s.
e. It takes as long to recover as it does to get sick!
35000
Arapahoe County
30000 Jefferson County
Denver County
25000
Douglas County
20000 Boulder County
Adams County
15000
Broomfield County
10000 Total Metro Area
5000
0
1971 1974 1977 1980 1983 1986 1989 1992 1995 1998 2001 2004 2007 2010
2. 2. SALES TO LISTING RATIOS
a. The ratio of sales to listings has been of paramount importance to
predicting the health of a market for many years.
b. What we are seeing right now is an estimated trend of rapidly
increasing supply and the absorption from sales activity
remaining constant.
c. This is creating a trend or movement toward over supply.
d. If the second half of 2010 were to continue on this same trend line
as the first six months, we will drift into an oversupply market
creating more foreclosure and short sale potential.
Ratio of Listings to Sales
4.00
3.00
Ratio
2.00
1.00
0.00
1975 1977 1979 1981 1983 1985 1987 1989 1991 1993 1995 1997 1999 2001 2003 2005 2007 2009
Date
3. AVERAGE PRICE TRENDS
a. Average price trends should only be considered as a guide to
market conditions and not an absolute for all properties in a given
market place.
b. In the first half of 2010, we have seen average prices inch up.
c. They have increased significantly in areas that have higher end
inventory, because we have seen increased activity there due to
the new price paradigm which is often 20, 30, 40 and even 50% of
2007 values.
d. This elevates the average price particularly if there is less activity
at the lower end of the market as we have seen since the Tax
Credits were eliminated from this equation.
e. Overall, average prices are up, but in many individual MLS areas,
prices have actually declined.
f. Remember, each and every enclave, community or neighborhood
needs to be addressed for their own individual price trend.
Average prices can only be used as a guide, and then and only
3. then can they assist with computing the health of a residential
market area.
History of Average Residential Prices in Denver Metro Area
$700,000
$600,000 ALL AREAS
$500,000 DSE
$400,000 SSE
Price
$300,000 DEC/DHR/DHL
$200,000
$100,000
$0
1974
1976
1978
1980
1982
1984
1986
1988
1990
1992
1994
1996
1998
2000
2002
2004
2006
2008
2010
Date
4. MARKET SHARE BY PRICE RANGE & SUPPLY OF INVENTORY
a. There is much to learn from this next chart. It can tell us the story
about the health of the market.
b. Is the market growing in the higher priced market segment or is it
growing at the bottom of the price ladder?
c. Here’s what we know. In the last 6 months, there has been
considerable growth in the middle of the market from $200K to
$750K.
d. This makes sense since we literally ran out of inventory under
$200K due to the tax credits, the $200‐400K price segment grew
by almost 2% in just 6 months.
e. We know from NAR data that each entry level transaction creates
an upward movement of parties to the market place hopefully
displacing residents along the way until there have been 6 more
transactions. (Keep in mind, many of the bank owned properties
were vacant at the time of sale a less “friction” in the market place
resulted.)
f. We know the higher the price the greater the months’ supply of
inventory. This has historically been a result of greater builder
margins therefore more supply was created at this end of the
market, but with virtually no new construction in the market at
4. this time, this suggests significant weakness for price
improvement in this segment moving forward.
MONTHS SUPPLY
40
35
30
25
20
15
10 MONTHS SUPPLY
5
0
g. Additionally, we know, the higher the price the smaller the market
share in terms of the number of transactions. This trend has
never changed as long as this chart has been compiled.
% MKT SHARE
120.00%
100.00%
80.00%
60.00%
40.00%
% MKT SHARE
20.00%
0.00%
5. IN CLOSING
a. There are always competing ways to read the data and present
the data in any report.
5. b. The data in this analysis has been presented in this fashion since
1975.
c. The result has been a relatively accurate method of predicting
future trends in this market place.
d. Everything points toward more of the same.
i. Uncertainty
ii. Price sensitivity
iii. Inventory teetering on the tipping point of dangerous
oversupply
iv. External factors affecting consumer sentiment which affects
home buying confidence
v. The cost of borrowing
vi. The cost of energy
vii. Residential taxes
e. As a result, we can’t bet on price appreciation to “bail out” the
price depressed residential market any time soon.
f. It’s going to take some time to heal all these wounds.
All data obtained, compiled and edited from Metrolist, Inc. which compiles their data from
individual Realtor sources. This report was completed by Tom Cryer, SCRP Broker Associate
with The Kentwood Company. Information obtained from sources believed to be reliable but
not guaranteed.
6. FORECLOSURES BY COUNTY AND METRO DENVER AREA TOTAL MID YEAR 2010 (ESTIMATED)
35000
Arapahoe County
30000
Jefferson County
Denver County
25000
Douglas County
20000
Boulder County
Adams County
15000
Broomfield County
10000
Total Metro Area
5000
0
1971 1974 1977 1980 1983 1986 1989 1992 1995 1998 2001 2004 2007 2010
7. Total # of Listings and Sales at Mid Year 2010 Denver MLS System
YEAR LISTINGS SALES RATIO
Total Count Total Count
12/31/75 35,728 19,156 1.87 Potential negative market signal (Above 2.50)
12/31/76 40,223 24,354 1.65 Potential positive market signal (Below 2.00)
12/31/77 41,598 29,875 1.39 Potential neutral market signal (Between 2.00 & 2.50)
12/31/78 49,675 31,213 1.59 Too soon to tell // Year to date // Inconclusive
12/31/79 59,384 31,024 1.91 Indicates all time high or low
12/31/80 55,438 23,952 2.31
12/31/81 49,755 22,125 2.25
12/31/82 52,817 18,756 2.82
12/31/83 63,585 23,566 2.70
12/31/84 69,041 23,264 2.97
12/31/85 73,279 24,489 2.99
12/31/86 75,694 25,865 2.93
12/31/87 69,740 23,414 2.98
12/31/88 62,521 24,120 2.59
12/31/89 50,112 25,142 1.99
12/31/90 53,682 26,436 2.03
12/31/91 53,286 27,375 1.95
12/31/92 48,103 34,828 1.38
12/31/93 69,118 40,291 1.72
12/31/94 73,637 40,068 1.84
12/31/95 78,969 37,767 2.09
12/31/96 84,909 39,849 2.13
12/31/97 90,813 41,959 2.16
12/31/98 103,402 47,836 2.16
12/31/99 72,842 48,795 1.49
12/31/00 100,672 50,499 1.99
12/31/01 133,688 49,372 2.71
12/27/02 138,445 49,326 2.81
12/29/03 123,596 47,731 2.59
12/31/04 127,989 53,710 2.38
12/31/05 135,008 54,072 2.50
12/31/06 152,807 52,220 2.93
12/31/07 143,400 51,304 2.80
12/31/08 123,655 48,926 2.53
12/31/09 104,330 48,926 2.13
12/31/10 125,954 42,892 2.94 MID YEAR
7/1/2008 (EST) LISTINGS SALES RATIO
Res 92,894 33,012 2.81
Cond 26,772 8,968 2.99
Land 4,134 452 9.15
Inc 2,154 460 4.68
Totals 125,954 42,892 2.94
Ratio of Listings to Sales
4.00
3.00
Ratio
2.00
1.00
0.00
1975 1977 1979 1981 1983 1985 1987 1989 1991 1993 1995 1997 1999 2001 2003 2005 2007 2009
Date
Information obtained from sources believed to be reliable but not guaranteed. All data obtained from year to date statistics provided by
Metrolist, Inc. and compiled by Tom Cryer, SCRP Broker Associate with The Kentwood Company
8. MID YEAR 2010 AVERAGE RESIDENTIAL PRICES IN THE
DENVER METROLIST SYSTEM
YEAR ALL AREAS DSE SSE DEC/DHR/DHL
1974 $34,722 $36,668 $50,912 $36,291
1975 $35,921 $36,381 $52,938 $59,250
1976 $39,740 $43,195 $61,135 $60,925
1977 $44,876 $50,825 $67,072 $64,473
1978 $55,610 $64,650 $83,446 $77,178
1979 $66,051 $77,648 $96,058 $80,129
1980 $78,594 $97,128 $127,856 $94,337
1981 $83,893 $98,263 $149,426 $101,684
1982 $87,816 $105,454 $161,047 $108,409
1983 $90,346 $109,035 $169,407 $113,755
1984 $95,137 $112,423 $167,934 $132,430
1985 $95,447 $112,415 $160,672 $119,942
1986 $97,049 $113,650 $170,716 $137,264
1987 $102,773 $116,006 $171,634 $137,204
1988 $98,937 $114,095 $171,848 $127,303
1989 $103,868 $117,491 $173,571 $133,061
1990 $102,848 $120,200 $194,900 $151,544
1991 $109,071 $120,485 $207,658 $146,456
1992 $115,154 $127,078 $212,173 $154,699
1993 $126,168 $140,513 $251,099 $164,913
1994 $138,301 $156,144 $278,046 $184,909
1995 $150,736 $172,185 $292,631 $192,643
1996 $159,328 $185,406 $315,670 $193,398
1997 $169,587 $201,601 $315,143 $205,132
1998 $185,785 $226,862 $358,542 $211,589
1999 $208,296 $259,311 $433,756 $231,368
2000 $257,394 $325,126 $492,378 $305,952
2001 $239,779 $301,211 $506,959 $277,089
2002 $268 926
$268,926 $348 850
$348,850 $507 371
$507,371 $315 375
$315,375
2003 $279,279 $365,652 $497,179 $315,402
2004 $290,876 $387,094 $527,605 $342,193
2005 $309,047 $426,258 $602,644 $355,242
2006 $317,112 $468,266 $589,911 $361,927
2007 $310,418 $486,515 $595,345 $372,880
2008 $270,261 $461,630 $529,667 $362,328
2009 $241,876 $435,726 $490,787 $358,684
2010 $252,041 $425,402 $485,992 $359,179 Mid Year
History of Average Residential Prices in Denver Metro Area
$700,000
$600,000 ALL AREAS
$500,000 DSE
$400,000 SSE
Price
$300,000 DEC/DHR/DHL
$200,000
$100,000
$0
1974
1976
1978
1980
1982
1984
1986
1988
1990
1992
1994
1996
1998
2000
2002
2004
2006
2008
2010
Date
Information obtained from sources believed to be reliable but not guaranteed. All data obtained from Metrolist, Inc. and compiled by
Tom Cryer, SCRP Broker Associate with The Kentwood Company.
9. DENVER METRO SINGLE FAMILY MARKET SHARE BY PRICE RANGE AS OF MID YEAR 2010**
**Annualized
LISTING RANGES ACTIVE LISTINGS UNDER CONTRACT SALES % MKT SHARE
ALL PRICES 24,731 5,288 41,174 100.00%
$0‐200K 6,175 2,327 16,227 39.41%
$200‐400K 10,670 2,091 18,679 45.37%
$400‐750K 5,249 741 5,440 13.21%
$750K‐1M 1306 105 689 1.67%
$1M + 1,639 89 533 1.29%
100.96%
SUPPLY IN MONTHS OF SFR INVENTORY
LISTING RANGES TOTAL # SALES MONTHS SUPPLY
ALL PRICES 41,174 7.21
$0‐200K 16227 4.57
$200‐400K 18679 6.85
$400‐750K 5440 11.58
$750K‐1M 689 22.75
$1M + 533 36.90