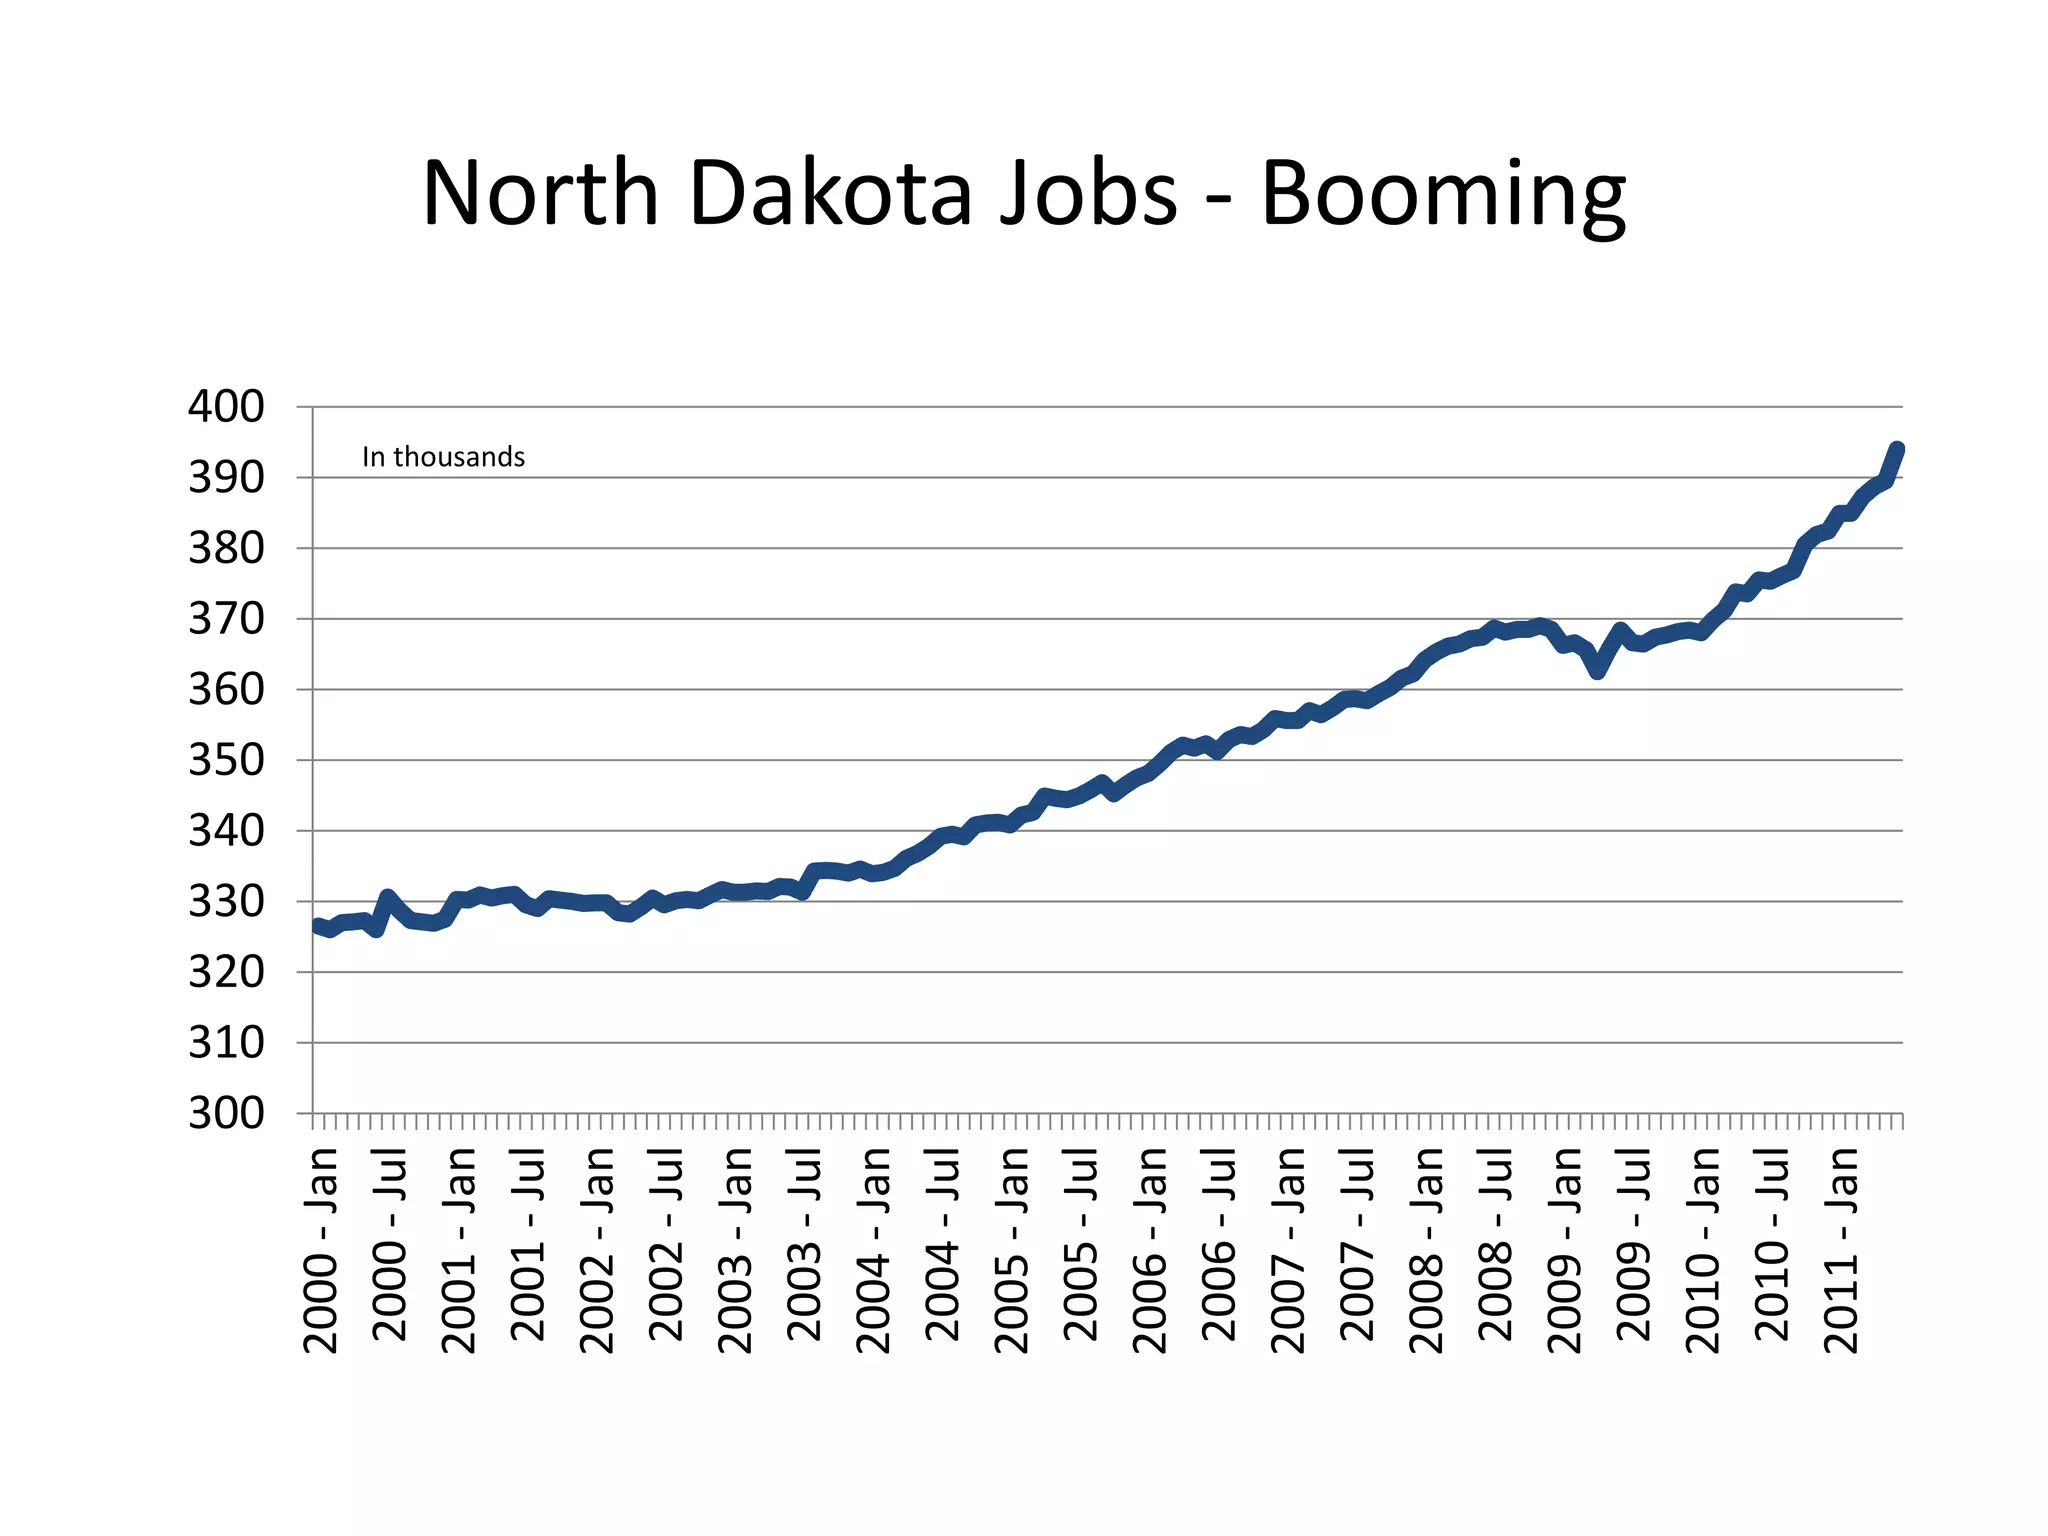
SlideShare a Scribd company logo
Housing Market and
    Economic Outlook
              Lawrence Yun, Ph.D.
                Chief Economist
      NATIONAL ASSOCIATION OF REALTORS®

Presentation at Charlotte Regional REALTOR® Association

                    Charlotte, NC
                 November 1, 2011
U.S. Annual Existing Home Sales
             …Ready to Breakout?
8,000,000
7,000,000
6,000,000
5,000,000
4,000,000
3,000,000
2,000,000
1,000,000
       0
            1981
            1982
            1983
            1984
            1985
            1986
            1987
            1988
            1989
            1990
            1991
            1992
            1993
            1994
            1995
            1996
            1997
            1998
            1999
            2000
            2001
            2002
            2003
            2004
            2005
            2006
            2007
            2008
            2009
            2010
3,000,000
                          3,500,000
                                      4,000,000
                                                  4,500,000
                                                              5,000,000
                                                                          5,500,000
                                                                                      6,000,000
                                                                                                  6,500,000
                                                                                                                    7,000,000
 2008 - Jan
2008 - Mar
2008 - May
 2008 - Jul
2008 - Sep
2008 - Nov
 2009 - Jan
2009 - Mar
2009 - May
 2009 - Jul
2009 - Sep
2009 - Nov
 2010 - Jan
2010 - Mar
2010 - May
                                                                                                              Tax Credit Impact


 2010 - Jul
2010 - Sep
2010 - Nov
 2011 - Jan
                                                                                                                                  Flat Line outside of Tax Credit
                                                                                                                                  Monthly Existing Home Sales …


2011 - Mar
2011 - May
 2011 - Jul
2011 - Sep
0
             1
             2
             3
             4
             5
             6
             7
             8
             9
2000 - Jan
2000 - Jul
2001 - Jan
2001 - Jul
2002 - Jan
2002 - Jul
2003 - Jan
2003 - Jul
2004 - Jan
2004 - Jul
2005 - Jan
2005 - Jul
                 30-year Mortgage


2006 - Jan
2006 - Jul
2007 - Jan
2007 - Jul
2008 - Jan
2008 - Jul
                 Fed Funds


2009 - Jan
2009 - Jul
2010 - Jan
                                    … Despite Record Low Rates


2010 - Jul
2011 - Jan
2011 - Jul
0
                                2
                                    4
                                         6
                                                   8
                                                       10


-10
      -8
           -6
                -4
                     -2
                2000 - Q1
                2000 - Q3
                2001 - Q1
                2001 - Q3
                2002 - Q1
                2002 - Q3
                2003 - Q1
                2003 - Q3
                2004 - Q1
                2004 - Q3
                2005 - Q1
                2005 - Q3
                2006 - Q1
                2006 - Q3
                2007 - Q1
                2007 - Q3
                2008 - Q1
                                                                           not 1% as in 1st half in 2011)


                2008 - Q3
                2009 - Q1
                2009 - Q3
                                                                                                                   Economy Losing Momentum


                2010 - Q1
                2010 - Q3
                2011 - Q1
                                                            (GDP growth after recession should be sustained 4% to 5% …


                                    Desired Pace


                2011 - Q3
Consumer Confidence in the Tanks

160
140
120
100
 80
 60
 40
 20
  0
   2000 - 2001 - 2002 - 2003 - 2004 - 2005 - 2006 - 2007 - 2008 - 2009 - 2010 - 2011 -
    Jan Jan Jan Jan Jan Jan Jan Jan Jan Jan Jan Jan
0
           50
                100
                      150
                            200
                                  250
1990
1991
1992
1993
1994
1995
1996
1997
1998
1999
2000
2001
2002
2003
2004
2005
2006
2007
                                        NC Home Sales - Annual


2008
2009
2010
2011
0
                 50
                      100
                            150
                                  200
                                        250
                                              300
1990 - Jan
1991 - Jan
1992 - Jan
1993 - Jan
1994 - Jan
1995 - Jan
1996 - Jan
1997 - Jan
1998 - Jan
1999 - Jan
2000 - Jan
2001 - Jan
2002 - Jan
2003 - Jan
2004 - Jan
2005 - Jan
2006 - Jan
2007 - Jan
2008 - Jan
2009 - Jan
2010 - Jan
                                                    Case-Shiller Index: Charlotte and Miami


2011 - Jan
Charlotte Region Activity
• September 2011 YTD … up 1.1%
• September 2010 YTD … up 4.0% (with tax credit)

• Inventory … down 20%

• Closed average price … down 6.5%
• Listed average price … up 5%

• Case-Shiller price index … bottomed ??? … up 2 out of the
  past 3 months

Source: CRRA 10K reports
U.S. Housing Starts… Very Low and
    much below Long-term Average
2500
          Housing Starts in thousands
2000
                                                      Long-term Average;
1500                                                  Long-term Requirement

1000

 500

   0
       2000 2001 2002 2003 2004 2005 2006 2007 2008 2009 2010 2011
       - Jan - Jan - Jan - Jan - Jan - Jan - Jan - Jan - Jan - Jan - Jan - Jan
0
                 100
                       200
                             300
                                   400
                                         500
                                               600
                                                              700
2000 - Feb
2000 - Aug
2001 - Feb
2001 - Aug
                                               In thousands

2002 - Feb
2002 - Aug
2003 - Feb
2003 - Aug
2004 - Feb
2004 - Aug
2005 - Feb
2005 - Aug
2006 - Feb
2006 - Aug
                                                                    (40 year lows)


2007 - Feb
2007 - Aug
2008 - Feb
2008 - Aug
2009 - Feb
2009 - Aug
                                                                                 Newly Built Home Inventory


2010 - Feb
2010 - Aug
2011 - Feb
2011 - Aug
Charlotte Housing Permits
30000

25000

20000

15000

10000

5000

   0
Improving Factors for Higher Home Sales
• Improving Factors
   –   Job Creation (though slowly)
   –   Stock market recovery from 2008
   –   Rising rents and larger pool of qualified renters
   –   Buyers want distressed properties … at deep discounts
   –   International buyers cashing in on the weakened dollar
   –   Smart money chasing real estate

• Potential Huge Positive … Lending opens up
• Potential Huge Negative … Washington policy change
124000
                      126000
                               128000
                                        130000
                                                 132000
                                                          134000
                                                                   136000
                                                                            138000
                                                                                           140000
2000 - Jan
2000 - Jul
2001 - Jan                                                                           In thousands

2001 - Jul
                                                                                                    In thousands


2002 - Jan
2002 - Jul
2003 - Jan
2003 - Jul
2004 - Jan
2004 - Jul
2005 - Jan
2005 - Jul
2006 - Jan
2006 - Jul
2007 - Jan
2007 - Jul
2008 - Jan
                                                                                                                   (1.3 million in the past 12 months)


2008 - Jul
2009 - Jan
2009 - Jul
2010 - Jan
2010 - Jul
2011 - Jan
                                                                               6.5 million
                                                                                                                                                   Total U.S. Payroll Jobs – Modest Recovery


2011 - Jul
                                                                               below prior peak
300
             310
             320
             330
             340
             350
             360
             370
             380
             390
             400
2000 - Jan
2000 - Jul
2001 - Jan     In thousands

2001 - Jul
                              In thousands


2002 - Jan
2002 - Jul
2003 - Jan
2003 - Jul
2004 - Jan
2004 - Jul
2005 - Jan
2005 - Jul
2006 - Jan
2006 - Jul
2007 - Jan
2007 - Jul
2008 - Jan
2008 - Jul
2009 - Jan
                                             North Dakota Jobs - Booming


2009 - Jul
2010 - Jan
2010 - Jul
2011 - Jan
8500
                    9000
                           9500
                                  10000
                                          10500
                                                             11000
2000 - Jan
2000 - Jul
2001 - Jan                                        In thousands

2001 - Jul
                                                                 In thousands


2002 - Jan
2002 - Jul
2003 - Jan
2003 - Jul
2004 - Jan
2004 - Jul
2005 - Jan
2005 - Jul
2006 - Jan
2006 - Jul
2007 - Jan
2007 - Jul
2008 - Jan
2008 - Jul
2009 - Jan
2009 - Jul
2010 - Jan
2010 - Jul
                                                                                Texas Payroll Jobs – Fully Recovered


2011 - Jan
3500
                    3700
                           3900
                                  4100
                                         4300
                                                4500
                                                       4700
                                                                  4900
2000 - Jan
2000 - Jul
                                                              In thousands
2001 - Jan
                                                                             In thousands


2001 - Jul
2002 - Jan
2002 - Jul
2003 - Jan
2003 - Jul
2004 - Jan
2004 - Jul
2005 - Jan
2005 - Jul
2006 - Jan
2006 - Jul
2007 - Jan
2007 - Jul
2008 - Jan
2008 - Jul
                                                                                              Michigan Payroll Jobs –


2009 - Jan
                                                                                            Ongoing Structural Changes


2009 - Jul
2010 - Jan
2010 - Jul
2011 - Jan
3500
                    3600
                           3700
                                  3800
                                         3900
                                                4000
                                                       4100
                                                              4200
                                                                     4300
2000 - Jan
2000 - Jul
2001 - Jan
                                                                           thousands


2001 - Jul
                                                                      InInthousands


2002 - Jan
2002 - Jul
2003 - Jan
2003 - Jul
2004 - Jan
2004 - Jul
2005 - Jan
2005 - Jul
2006 - Jan
2006 - Jul
2007 - Jan
2007 - Jul
2008 - Jan
2008 - Jul
2009 - Jan
2009 - Jul
2010 - Jan
                                                                                       NC Jobs – Recovery Starting


2010 - Jul
2011 - Jan
2011 - Jul
400
             450
             500
             550
             600
             650
             700
             750
             800
             850
             900
1990 - Jan
1991 - Jan
1992 - Jan     In thousands

1993 - Jan
                              In thousands


1994 - Jan
1995 - Jan
1996 - Jan
1997 - Jan
1998 - Jan
1999 - Jan
2000 - Jan
2001 - Jan
2002 - Jan
2003 - Jan
2004 - Jan
2005 - Jan
2006 - Jan
2007 - Jan
2008 - Jan
2009 - Jan
2010 - Jan
                                             Charlotte Long-Term Job Growth


2011 - Jan
0
                 100
                       200
                             300
                                   400
                                         500
                                               600
                                                           700
2000 - Jan
2000 - Jul
2001 - Jan                                           In thousands

2001 - Jul
                                                                    In thousands


2002 - Jan
2002 - Jul
2003 - Jan
2003 - Jul
2004 - Jan
2004 - Jul
2005 - Jan
2005 - Jul
2006 - Jan
2006 - Jul
2007 - Jan
2007 - Jul
2008 - Jan
2008 - Jul
                                                                                        Not Going under 400,000


2009 - Jan
2009 - Jul
2010 - Jan
2010 - Jul
                                                                                   Weekly Fresh Unemployment Claims …


2011 - Jan
2011 - Jul
Financial Asset at $45 trillion …
             Good Recovery from 2008
55000


50000


45000


40000


35000


30000
        2000 - 2001 - 2002 - 2003 - 2004 - 2005 - 2006 - 2007 - 2008 - 2009 - 2010 - 2011 -
         Q1     Q1     Q1     Q1     Q1     Q1     Q1     Q1     Q1     Q1     Q1 Q1 est.
    Source: Federal Reserve
5000
                                         6000
                                                7000
                                                       8000
                                                              9000
                                                                     10000
                                                                             11000
                                                                                     12000
                                                                                             13000
                                                                                                     14000
                          2000 - Q1
                          2000 - Q3
                          2001 - Q1
                          2001 - Q3
                          2002 - Q1
                          2002 - Q3


Source: Federal Reserve
                          2003 - Q1
                          2003 - Q3
                          2004 - Q1
                          2004 - Q3
                          2005 - Q1
                          2005 - Q3
                          2006 - Q1
                          2006 - Q3
                          2007 - Q1
                          2007 - Q3
                          2008 - Q1
                          2008 - Q3
                          2009 - Q1
                          2009 - Q3
                                                                                                              small business owners) … Down


                          2010 - Q1
                                                                                                             Housing Equity (source of funds for


                          2010 - Q3
                          2011 - Q1
0
                 1
                     2
                         3
                             4
                                 5


    -1
                                     6 %
2000 - Jan
2000 - Jul
2001 - Jan
2001 - Jul
2002 - Jan
2002 - Jul
2003 - Jan
2003 - Jul
2004 - Jan
2004 - Jul
2005 - Jan
2005 - Jul
2006 - Jan
2006 - Jul
2007 - Jan
2007 - Jul
2008 - Jan
2008 - Jul
                                           (3-month moving avg., annualized rate)
                                                                             CPI Apartment Rent


2009 - Jan
2009 - Jul
2010 - Jan
2010 - Jul
2011 - Jan
2011 - Jul
Home Price vs Rent
                        (index = 100 in 1980)
                                   rent      price
450.0
400.0
350.0
300.0
250.0
200.0
150.0
100.0
 50.0
  0.0
    1980 -   1984 -   1988 -   1992 -     1996 -     2000 -   2004 -   2008 -
      Jan     Jan      Jan      Jan        Jan        Jan      Jan      Jan
Serious Delinquent Mortgages …
  Mostly those who took out loans in bubble years
                     (90+ days late or in foreclosure process)
12.0   In millions
10.0
 8.0
 6.0
 4.0
 2.0
 0.0
       2000 - Q1
       2000 - Q3
       2001 - Q1
       2001 - Q3
       2002 - Q1
       2002 - Q3
       2003 - Q1
       2003 - Q3
       2004 - Q1
       2004 - Q3
       2005 - Q1
       2005 - Q3
       2006 - Q1
       2006 - Q3
       2007 - Q1
       2007 - Q3
       2008 - Q1
       2008 - Q3
       2009 - Q1
       2009 - Q3
       2010 - Q1
       2010 - Q3
       2011 - Q1
                                       U.S.     NC

  In 2010, there were 1.5 million distressed sales … need to wait 2.7 years
Distress Sales: 30% to 40% of Transactions
                Will Remain Significant for Next 2 years

55%

50%

45%

40%

35%

30%

25%

20%
      2008 - 2009 - 2009 - 2009 - 2009 - 2010 - 2010 - 2010 - 2010 - 2011 - 2011 -
       Oct    Jan Apr       Jul    Oct    Jan Apr       Jul    Oct    Jan Apr
Very Low Default among Recent Homebuyers
          Fannie and Freddie Backed Mortgage Loan Performance


Fannie Mae       Cumulative              Freddie Mac   Cumulative
Vintage          Default Rate            Vintage       Default Rate
                 after 18 months                       after 18 months
2002             3.1%                    2002          2.7%
2003             2.5%                    2003          1.2%
2004             4.6%                    2004          2.0%
2005             4.8%                    2005          1.8%
2006             11.6%                   2006          6.0%
2007             28.7%                   2007          22.3%
2008             12.6%                   2008          13.7%
2009             1.2%                    2009          1.1%


Source: Federal Housing Finance Agency
Smart Money Buying?
• All-cash record high at 30% to 35% of all sales
   – Investors want quick deals
   – Investors cannot get mortgage
   – Some do not want to bother with appraisals
   – Financial asset recovery helping with cash
   – Hedge against future inflation … alternative to
     expensive gold
   – Hedge against future housing shortage?
   – Empty nesters downsizing and using leftover cash for
     kids’ home?
0
                             5
                                 10
                                      15
                                                                                          20


-20
      -15
            -10
                  -5
            1969 - Jan
            1971 - Jan
            1973 - Jan
            1975 - Jan
            1977 - Jan
            1979 - Jan
            1981 - Jan
            1983 - Jan
            1985 - Jan
            1987 - Jan
            1989 - Jan
            1991 - Jan
            1993 - Jan
            1995 - Jan
            1997 - Jan
            1999 - Jan
            2001 - Jan
                                                                                                             (single-family home price in blue vs CPI in red)


            2003 - Jan
                                                                                                                                                         Real Estate as Inflation Hedge?

                                           Good inflation hedge in the past before the housing bubble/bust


            2005 - Jan
            2007 - Jan
            2009 - Jan
            2011 - Jan
0
                                                          1
                                                          2
                                                          3
                                                          4
                                                          5
                                                          6


                                                         -2
                                                         -1
                                                       2000 - Jan
                                                       2000 - Jul
                                                       2001 - Jan
                                                       2001 - Jul
                                                       2002 - Jan
                                                       2002 - Jul
                                                       2003 - Jan
                                                       2003 - Jul
                                                       2004 - Jan
                                                       2004 - Jul
                                                       2005 - Jan
                                                       2005 - Jul
                                                       2006 - Jan
                                                       2006 - Jul
                                                       2007 - Jan
                                                       2007 - Jul
                                                       2008 - Jan
                                                                    (% change from one year ago)


• Workers Wage to rise by 1.7% in 2011
                                                       2008 - Jul
                                                                                             CPI Inflation Rising


                                                       2009 - Jan
                                                       2009 - Jul
                                                       2010 - Jan
                                                       2010 - Jul
• Social Security COLA forecast to rise 3.5% in 2012


                                                       2011 - Jan
                                                       2011 - Jul
Broad Inflationary Pressure
Indicator                                     % change from one year ago
Consumer Price Index                          3.8%

Producer Price Index (Finished Product)       6.5%

Producer Price Index (Intermediate Product)   7.5%

Producer Price Index (Crude Product)          24.2%

Dow Jones Commodity Spot Price Index          28.3%

Gold Price                                    Off Record High Price … but very
                                              high
Upside Potential Surprise
Average Credit Score for
             Loan Origination
          Normal   2009   2010     If

Fannie    720      761    762      720

Freddie   720      757    758      720

FHA       650      682    698      660


                            15% to 20% Higher Sales
Downside Potential Surprise
Washington Policy Change?
• QRM and 20% downpayment requirement ???
    – Affordability (staying within budget) more important than down
      payment
    – No taxpayer bailout for FHA and VA program
•   Limit mortgage interest deduction for high income and
    second homes ???
    – Crush the working class in resort areas (Yacht Tax Impact)
    – Cascading impact to middle class homes and hurts confidence to
      buy a home
• Lower conforming loan limit ???
• Fannie and Freddie model was flawed (private
  profit/taxpayer loss) and need a fundamental restructuring
  … not total privatization
    – Jumbo interest rates on all loans?
    – Non-existent loans in times of crisis?
National Museum of American History


• 4 million no-down-payment VA mortgages for World War II veterans

• Fueled an unprecedented growth of America’s middle class
Real Estate Baseline Outlook
• Moderate GDP Expansion 1.5% to 2.5% in the next 2 years


• 1.0 to 1.5 million annual job additions yearly in the next 2 years


• Mortgage Rates rising to 4.3% by year-end 2011 and 5.0% in 2012
   • Not that important compared to underwriting standards
• Home sales – no reason to go lower … slight increases next 2 years
• Home values – steady and slow growth in the national price in the
  next 2 years … critical source of small business start-up funds


• Commercial : net absorption rising, vacancy rates falling, cap rates
  falling
Presidential Quotes
• Franklin Delano Roosevelt:
     “A nation of homeowners is unconquerable.”


• Ronald Reagan
    “We will preserve the part of the American dream
which the mortgage-interest deduction symbolizes."
For More Information
– Daily Data and Analysis on Latest Trends

– http://www.facebook.com/narresearchgroup

– Twitter @NAR_Research

More Related Content

What's hot

2014 Residential Economic Issues & Trends Forum: REALTOR® Party Convention & ...
2014 Residential Economic Issues & Trends Forum: REALTOR® Party Convention & ...2014 Residential Economic Issues & Trends Forum: REALTOR® Party Convention & ...
2014 Residential Economic Issues & Trends Forum: REALTOR® Party Convention & ...
Nar Res
 
Residential Economic Issues and Trends Forum: November 2014
Residential Economic Issues and Trends Forum: November 2014Residential Economic Issues and Trends Forum: November 2014
Residential Economic Issues and Trends Forum: November 2014
Nar Res
 
09 21-11 forecast2012
09 21-11 forecast201209 21-11 forecast2012
09 21-11 forecast2012
pushpanagaraj
 
International economics relations and thailand economic strategy updated 18...
International economics relations and thailand economic strategy   updated 18...International economics relations and thailand economic strategy   updated 18...
International economics relations and thailand economic strategy updated 18...
ชำนิ รักษายศ
 
2012 year end report
2012 year end report2012 year end report
2012 year end report
balatow1
 
10 07-11 leslie to mtg
10 07-11 leslie to mtg10 07-11 leslie to mtg
House price monitor.12.2011
House price monitor.12.2011House price monitor.12.2011
House price monitor.12.2011
REALTORS
 
Home Price Monitor, Released March 2012
Home Price Monitor, Released March 2012Home Price Monitor, Released March 2012
Home Price Monitor, Released March 2012
REALTORS
 
House price monitor.01.2012
House price monitor.01.2012House price monitor.01.2012
House price monitor.01.2012
REALTORS
 
Ronan Lyons, EU Conference Galway March 2012 - Ireland's property market, pas...
Ronan Lyons, EU Conference Galway March 2012 - Ireland's property market, pas...Ronan Lyons, EU Conference Galway March 2012 - Ireland's property market, pas...
Ronan Lyons, EU Conference Galway March 2012 - Ireland's property market, pas...
Ronan Lyons
 
Sl12 year in review and state of cabot
Sl12   year in review and state of cabotSl12   year in review and state of cabot
Sl12 year in review and state of cabot
cabotmoney
 
John L Scott Speech 10.27.11
John L Scott Speech 10.27.11John L Scott Speech 10.27.11
John L Scott Speech 10.27.11
GardnerEconomics
 
Greensboro Housing Report 2010.1
Greensboro Housing Report 2010.1Greensboro Housing Report 2010.1
Greensboro Housing Report 2010.1
trbproperties
 
Bruce yandle-chc-january
Bruce yandle-chc-januaryBruce yandle-chc-january
Bruce yandle-chc-january
Mercatus Center
 
For Richer or Poorer
For Richer or PoorerFor Richer or Poorer
For Richer or Poorer
Fourth Economy Consulting
 
Indian Economy
Indian EconomyIndian Economy
Indian Economy
Surendra D Vaidya
 
From Oecd To SNR
From Oecd To SNRFrom Oecd To SNR
From Oecd To SNR
30088
 
America and the Commodity Supercycle
America and the Commodity SupercycleAmerica and the Commodity Supercycle
America and the Commodity Supercycle
Objective Capital Conferences
 
Sgx ipo in singapore
Sgx ipo in singaporeSgx ipo in singapore
Sgx ipo in singapore
CapitalVia Singapore
 
Lecture 4 - Macroeconomic analysis of technological change
Lecture 4 - Macroeconomic analysis of technological changeLecture 4 - Macroeconomic analysis of technological change
Lecture 4 - Macroeconomic analysis of technological change
UNU.MERIT
 

What's hot (20)

2014 Residential Economic Issues & Trends Forum: REALTOR® Party Convention & ...
2014 Residential Economic Issues & Trends Forum: REALTOR® Party Convention & ...2014 Residential Economic Issues & Trends Forum: REALTOR® Party Convention & ...
2014 Residential Economic Issues & Trends Forum: REALTOR® Party Convention & ...
 
Residential Economic Issues and Trends Forum: November 2014
Residential Economic Issues and Trends Forum: November 2014Residential Economic Issues and Trends Forum: November 2014
Residential Economic Issues and Trends Forum: November 2014
 
09 21-11 forecast2012
09 21-11 forecast201209 21-11 forecast2012
09 21-11 forecast2012
 
International economics relations and thailand economic strategy updated 18...
International economics relations and thailand economic strategy   updated 18...International economics relations and thailand economic strategy   updated 18...
International economics relations and thailand economic strategy updated 18...
 
2012 year end report
2012 year end report2012 year end report
2012 year end report
 
10 07-11 leslie to mtg
10 07-11 leslie to mtg10 07-11 leslie to mtg
10 07-11 leslie to mtg
 
House price monitor.12.2011
House price monitor.12.2011House price monitor.12.2011
House price monitor.12.2011
 
Home Price Monitor, Released March 2012
Home Price Monitor, Released March 2012Home Price Monitor, Released March 2012
Home Price Monitor, Released March 2012
 
House price monitor.01.2012
House price monitor.01.2012House price monitor.01.2012
House price monitor.01.2012
 
Ronan Lyons, EU Conference Galway March 2012 - Ireland's property market, pas...
Ronan Lyons, EU Conference Galway March 2012 - Ireland's property market, pas...Ronan Lyons, EU Conference Galway March 2012 - Ireland's property market, pas...
Ronan Lyons, EU Conference Galway March 2012 - Ireland's property market, pas...
 
Sl12 year in review and state of cabot
Sl12   year in review and state of cabotSl12   year in review and state of cabot
Sl12 year in review and state of cabot
 
John L Scott Speech 10.27.11
John L Scott Speech 10.27.11John L Scott Speech 10.27.11
John L Scott Speech 10.27.11
 
Greensboro Housing Report 2010.1
Greensboro Housing Report 2010.1Greensboro Housing Report 2010.1
Greensboro Housing Report 2010.1
 
Bruce yandle-chc-january
Bruce yandle-chc-januaryBruce yandle-chc-january
Bruce yandle-chc-january
 
For Richer or Poorer
For Richer or PoorerFor Richer or Poorer
For Richer or Poorer
 
Indian Economy
Indian EconomyIndian Economy
Indian Economy
 
From Oecd To SNR
From Oecd To SNRFrom Oecd To SNR
From Oecd To SNR
 
America and the Commodity Supercycle
America and the Commodity SupercycleAmerica and the Commodity Supercycle
America and the Commodity Supercycle
 
Sgx ipo in singapore
Sgx ipo in singaporeSgx ipo in singapore
Sgx ipo in singapore
 
Lecture 4 - Macroeconomic analysis of technological change
Lecture 4 - Macroeconomic analysis of technological changeLecture 4 - Macroeconomic analysis of technological change
Lecture 4 - Macroeconomic analysis of technological change
 

Similar to Presentation: Dr Yun - Charlotte

2012 Midyear Charleston Residential Real Estate Market Update
2012 Midyear Charleston Residential Real Estate Market Update2012 Midyear Charleston Residential Real Estate Market Update
2012 Midyear Charleston Residential Real Estate Market Update
Charleston Trident Association of REALTORS
 
Dr. Lawrence Yun Economic Forecast Presentation
Dr. Lawrence Yun Economic Forecast PresentationDr. Lawrence Yun Economic Forecast Presentation
Dr. Lawrence Yun Economic Forecast Presentation
St. Charles County Association of REALTORS
 
Economic Update with Dr. Lawrende Yun
Economic Update with Dr. Lawrende YunEconomic Update with Dr. Lawrende Yun
Economic Update with Dr. Lawrende Yun
St. Charles County Association of REALTORS
 
Commercial Real Estate and Economic Outlook
Commercial Real Estate and Economic OutlookCommercial Real Estate and Economic Outlook
Commercial Real Estate and Economic Outlook
Nar Res
 
OAR Winter Conference 2013
OAR Winter Conference 2013OAR Winter Conference 2013
OAR Winter Conference 2013
Dane Theisen
 
Economic and Housing Market Trends and Outlook
Economic and Housing Market Trends and OutlookEconomic and Housing Market Trends and Outlook
Economic and Housing Market Trends and Outlook
Nar Res
 
Economic and Commercial Real Estate Outlook
Economic and Commercial Real Estate OutlookEconomic and Commercial Real Estate Outlook
Economic and Commercial Real Estate Outlook
Nar Res
 
Commercial Economic Issues and Trends Forum Presentation
Commercial Economic Issues and Trends Forum PresentationCommercial Economic Issues and Trends Forum Presentation
Commercial Economic Issues and Trends Forum Presentation
Nar Res
 
NAR Residential Economic Issues Trends Forum
NAR Residential Economic Issues Trends ForumNAR Residential Economic Issues Trends Forum
NAR Residential Economic Issues Trends Forum
Southwest Riverside County Association of Realtors
 
Recovery to Normalcy
Recovery to NormalcyRecovery to Normalcy
Recovery to Normalcy
NAR Research
 
Dr. Lawrence Yun - Real Estate Outlook - Global 2018
Dr. Lawrence Yun - Real Estate Outlook - Global 2018Dr. Lawrence Yun - Real Estate Outlook - Global 2018
Dr. Lawrence Yun - Real Estate Outlook - Global 2018
Paul Costello
 
Economic and Real Estate Market Update from National Association of REALTORS
Economic and Real Estate Market Update from National Association of REALTORSEconomic and Real Estate Market Update from National Association of REALTORS
Economic and Real Estate Market Update from National Association of REALTORS
Brian Block
 
Market Outlook with Lawrence Yun
Market Outlook with Lawrence YunMarket Outlook with Lawrence Yun
Market Outlook with Lawrence Yun
Better Homes and Gardens Real Estate
 
Albuquerque Real Estate Presentation by Dr. Lawrence Yun
Albuquerque Real Estate Presentation by Dr. Lawrence YunAlbuquerque Real Estate Presentation by Dr. Lawrence Yun
Albuquerque Real Estate Presentation by Dr. Lawrence Yun
Rich Cederberg, Albuquerque Real Estate Agent
 
Food and Global Financial Crises: Policy Response of Pakistan
Food and Global Financial Crises: Policy Response of PakistanFood and Global Financial Crises: Policy Response of Pakistan
Food and Global Financial Crises: Policy Response of Pakistan
Sustainable Development Policy Institute
 
Lawrence yun dbor power point presentation oct 27 2016
Lawrence yun dbor power point presentation oct 27 2016Lawrence yun dbor power point presentation oct 27 2016
Lawrence yun dbor power point presentation oct 27 2016
Dottie Herman
 
Economic and Housing Market Trends and Outlook
Economic and Housing Market Trends and OutlookEconomic and Housing Market Trends and Outlook
Economic and Housing Market Trends and Outlook
Nar Res
 
Charting the US Economy
Charting the US EconomyCharting the US Economy
Charting the US Economy
Gabriel Kaplan, CPA
 
Economic and Real Estate Outlook Silicon Valley (October 2015)
Economic and Real Estate Outlook Silicon Valley (October 2015)Economic and Real Estate Outlook Silicon Valley (October 2015)
Economic and Real Estate Outlook Silicon Valley (October 2015)
Susan Rits
 
Residential Economic Issues & Trends Forum 2013
Residential Economic Issues & Trends Forum 2013Residential Economic Issues & Trends Forum 2013
Residential Economic Issues & Trends Forum 2013
Nar Res
 

Similar to Presentation: Dr Yun - Charlotte (20)

2012 Midyear Charleston Residential Real Estate Market Update
2012 Midyear Charleston Residential Real Estate Market Update2012 Midyear Charleston Residential Real Estate Market Update
2012 Midyear Charleston Residential Real Estate Market Update
 
Dr. Lawrence Yun Economic Forecast Presentation
Dr. Lawrence Yun Economic Forecast PresentationDr. Lawrence Yun Economic Forecast Presentation
Dr. Lawrence Yun Economic Forecast Presentation
 
Economic Update with Dr. Lawrende Yun
Economic Update with Dr. Lawrende YunEconomic Update with Dr. Lawrende Yun
Economic Update with Dr. Lawrende Yun
 
Commercial Real Estate and Economic Outlook
Commercial Real Estate and Economic OutlookCommercial Real Estate and Economic Outlook
Commercial Real Estate and Economic Outlook
 
OAR Winter Conference 2013
OAR Winter Conference 2013OAR Winter Conference 2013
OAR Winter Conference 2013
 
Economic and Housing Market Trends and Outlook
Economic and Housing Market Trends and OutlookEconomic and Housing Market Trends and Outlook
Economic and Housing Market Trends and Outlook
 
Economic and Commercial Real Estate Outlook
Economic and Commercial Real Estate OutlookEconomic and Commercial Real Estate Outlook
Economic and Commercial Real Estate Outlook
 
Commercial Economic Issues and Trends Forum Presentation
Commercial Economic Issues and Trends Forum PresentationCommercial Economic Issues and Trends Forum Presentation
Commercial Economic Issues and Trends Forum Presentation
 
NAR Residential Economic Issues Trends Forum
NAR Residential Economic Issues Trends ForumNAR Residential Economic Issues Trends Forum
NAR Residential Economic Issues Trends Forum
 
Recovery to Normalcy
Recovery to NormalcyRecovery to Normalcy
Recovery to Normalcy
 
Dr. Lawrence Yun - Real Estate Outlook - Global 2018
Dr. Lawrence Yun - Real Estate Outlook - Global 2018Dr. Lawrence Yun - Real Estate Outlook - Global 2018
Dr. Lawrence Yun - Real Estate Outlook - Global 2018
 
Economic and Real Estate Market Update from National Association of REALTORS
Economic and Real Estate Market Update from National Association of REALTORSEconomic and Real Estate Market Update from National Association of REALTORS
Economic and Real Estate Market Update from National Association of REALTORS
 
Market Outlook with Lawrence Yun
Market Outlook with Lawrence YunMarket Outlook with Lawrence Yun
Market Outlook with Lawrence Yun
 
Albuquerque Real Estate Presentation by Dr. Lawrence Yun
Albuquerque Real Estate Presentation by Dr. Lawrence YunAlbuquerque Real Estate Presentation by Dr. Lawrence Yun
Albuquerque Real Estate Presentation by Dr. Lawrence Yun
 
Food and Global Financial Crises: Policy Response of Pakistan
Food and Global Financial Crises: Policy Response of PakistanFood and Global Financial Crises: Policy Response of Pakistan
Food and Global Financial Crises: Policy Response of Pakistan
 
Lawrence yun dbor power point presentation oct 27 2016
Lawrence yun dbor power point presentation oct 27 2016Lawrence yun dbor power point presentation oct 27 2016
Lawrence yun dbor power point presentation oct 27 2016
 
Economic and Housing Market Trends and Outlook
Economic and Housing Market Trends and OutlookEconomic and Housing Market Trends and Outlook
Economic and Housing Market Trends and Outlook
 
Charting the US Economy
Charting the US EconomyCharting the US Economy
Charting the US Economy
 
Economic and Real Estate Outlook Silicon Valley (October 2015)
Economic and Real Estate Outlook Silicon Valley (October 2015)Economic and Real Estate Outlook Silicon Valley (October 2015)
Economic and Real Estate Outlook Silicon Valley (October 2015)
 
Residential Economic Issues & Trends Forum 2013
Residential Economic Issues & Trends Forum 2013Residential Economic Issues & Trends Forum 2013
Residential Economic Issues & Trends Forum 2013
 

Recently uploaded

Sense Levent Kagithane Catalog - Listing Turkey
Sense Levent Kagithane Catalog - Listing TurkeySense Levent Kagithane Catalog - Listing Turkey
Sense Levent Kagithane Catalog - Listing Turkey
Listing Turkey
 
Serviced Apartment Ho Chi Minh For Rental
Serviced Apartment Ho Chi Minh For RentalServiced Apartment Ho Chi Minh For Rental
Serviced Apartment Ho Chi Minh For Rental
GVRenting
 
原版制作(Greenwich毕业证书)格林威治大学毕业证PDF成绩单一模一样
原版制作(Greenwich毕业证书)格林威治大学毕业证PDF成绩单一模一样原版制作(Greenwich毕业证书)格林威治大学毕业证PDF成绩单一模一样
原版制作(Greenwich毕业证书)格林威治大学毕业证PDF成绩单一模一样
a7xjm8n4
 
Things to Consider When Selling Your House - Summer 2024 Edition
Things to Consider When Selling Your House - Summer 2024 EditionThings to Consider When Selling Your House - Summer 2024 Edition
Things to Consider When Selling Your House - Summer 2024 Edition
Tom Blefko
 
Addis Bleaching Mixed use Apartment- Documentation 6.pdf
Addis Bleaching Mixed use Apartment- Documentation 6.pdfAddis Bleaching Mixed use Apartment- Documentation 6.pdf
Addis Bleaching Mixed use Apartment- Documentation 6.pdf
hawifitumaed
 
Recent Trends Fueling The Surge in Farmhouse Demand in India
Recent Trends Fueling The Surge in Farmhouse Demand in IndiaRecent Trends Fueling The Surge in Farmhouse Demand in India
Recent Trends Fueling The Surge in Farmhouse Demand in India
Farmland Bazaar
 
Best Construction Company in Haldwani UK
Best Construction Company in Haldwani UKBest Construction Company in Haldwani UK
Best Construction Company in Haldwani UK
Geomatrix
 
Victory by Maskeen Group Surrey Floor plans June 2024 PDF
Victory by Maskeen Group Surrey Floor plans June 2024 PDFVictory by Maskeen Group Surrey Floor plans June 2024 PDF
Victory by Maskeen Group Surrey Floor plans June 2024 PDF
VickyAulakh1
 
G+10 apartment 1- Sustainable apartment building.pdf
G+10 apartment 1- Sustainable apartment building.pdfG+10 apartment 1- Sustainable apartment building.pdf
G+10 apartment 1- Sustainable apartment building.pdf
hawifitumaed
 
制作(ucr毕业证书)加州大学河滨分校毕业证学历学位证书原版一模一样
制作(ucr毕业证书)加州大学河滨分校毕业证学历学位证书原版一模一样制作(ucr毕业证书)加州大学河滨分校毕业证学历学位证书原版一模一样
制作(ucr毕业证书)加州大学河滨分校毕业证学历学位证书原版一模一样
z5h13yqc
 
Gurgaon Industrial Business Association.pdf
Gurgaon Industrial Business Association.pdfGurgaon Industrial Business Association.pdf
Gurgaon Industrial Business Association.pdf
jwhrsngh23
 
BEST FARMLAND FOR SALE | FARM PLOTS NEAR BANGALORE | KANAKAPURA | CHICKKABALP...
BEST FARMLAND FOR SALE | FARM PLOTS NEAR BANGALORE | KANAKAPURA | CHICKKABALP...BEST FARMLAND FOR SALE | FARM PLOTS NEAR BANGALORE | KANAKAPURA | CHICKKABALP...
BEST FARMLAND FOR SALE | FARM PLOTS NEAR BANGALORE | KANAKAPURA | CHICKKABALP...
knox groups real estate
 
Hawthorn Module 1 Coverted to Slide Show - 04.06.2024.docx
Hawthorn Module 1 Coverted to Slide Show - 04.06.2024.docxHawthorn Module 1 Coverted to Slide Show - 04.06.2024.docx
Hawthorn Module 1 Coverted to Slide Show - 04.06.2024.docx
anothershaneroberts
 
Deutsche EuroShop | Company Presentation | 06/24
Deutsche EuroShop | Company Presentation | 06/24Deutsche EuroShop | Company Presentation | 06/24
Deutsche EuroShop | Company Presentation | 06/24
Deutsche EuroShop AG
 
GT234 CADASTRAL SURVEYING gggggggggg.ppt
GT234 CADASTRAL SURVEYING gggggggggg.pptGT234 CADASTRAL SURVEYING gggggggggg.ppt
GT234 CADASTRAL SURVEYING gggggggggg.ppt
leonardmichael1
 
SVN Live 6.10.24 Weekly Property Broadcast
SVN Live 6.10.24 Weekly Property BroadcastSVN Live 6.10.24 Weekly Property Broadcast
SVN Live 6.10.24 Weekly Property Broadcast
SVN International Corp.
 
Listing Turkey - Yeni Eyupevleri Istanbul
Listing Turkey - Yeni Eyupevleri IstanbulListing Turkey - Yeni Eyupevleri Istanbul
Listing Turkey - Yeni Eyupevleri Istanbul
Listing Turkey
 
HollandRow_17x11_Insert_Floorplan_Feature sheet.pdf
HollandRow_17x11_Insert_Floorplan_Feature sheet.pdfHollandRow_17x11_Insert_Floorplan_Feature sheet.pdf
HollandRow_17x11_Insert_Floorplan_Feature sheet.pdf
VickyAulakh1
 
The KA Housing - Catalogue - Listing Turkey
The KA Housing - Catalogue - Listing TurkeyThe KA Housing - Catalogue - Listing Turkey
The KA Housing - Catalogue - Listing Turkey
Listing Turkey
 
House Construction Cost in Haldwani
House Construction Cost in Haldwani House Construction Cost in Haldwani
House Construction Cost in Haldwani
Geomatrix
 

Recently uploaded (20)

Sense Levent Kagithane Catalog - Listing Turkey
Sense Levent Kagithane Catalog - Listing TurkeySense Levent Kagithane Catalog - Listing Turkey
Sense Levent Kagithane Catalog - Listing Turkey
 
Serviced Apartment Ho Chi Minh For Rental
Serviced Apartment Ho Chi Minh For RentalServiced Apartment Ho Chi Minh For Rental
Serviced Apartment Ho Chi Minh For Rental
 
原版制作(Greenwich毕业证书)格林威治大学毕业证PDF成绩单一模一样
原版制作(Greenwich毕业证书)格林威治大学毕业证PDF成绩单一模一样原版制作(Greenwich毕业证书)格林威治大学毕业证PDF成绩单一模一样
原版制作(Greenwich毕业证书)格林威治大学毕业证PDF成绩单一模一样
 
Things to Consider When Selling Your House - Summer 2024 Edition
Things to Consider When Selling Your House - Summer 2024 EditionThings to Consider When Selling Your House - Summer 2024 Edition
Things to Consider When Selling Your House - Summer 2024 Edition
 
Addis Bleaching Mixed use Apartment- Documentation 6.pdf
Addis Bleaching Mixed use Apartment- Documentation 6.pdfAddis Bleaching Mixed use Apartment- Documentation 6.pdf
Addis Bleaching Mixed use Apartment- Documentation 6.pdf
 
Recent Trends Fueling The Surge in Farmhouse Demand in India
Recent Trends Fueling The Surge in Farmhouse Demand in IndiaRecent Trends Fueling The Surge in Farmhouse Demand in India
Recent Trends Fueling The Surge in Farmhouse Demand in India
 
Best Construction Company in Haldwani UK
Best Construction Company in Haldwani UKBest Construction Company in Haldwani UK
Best Construction Company in Haldwani UK
 
Victory by Maskeen Group Surrey Floor plans June 2024 PDF
Victory by Maskeen Group Surrey Floor plans June 2024 PDFVictory by Maskeen Group Surrey Floor plans June 2024 PDF
Victory by Maskeen Group Surrey Floor plans June 2024 PDF
 
G+10 apartment 1- Sustainable apartment building.pdf
G+10 apartment 1- Sustainable apartment building.pdfG+10 apartment 1- Sustainable apartment building.pdf
G+10 apartment 1- Sustainable apartment building.pdf
 
制作(ucr毕业证书)加州大学河滨分校毕业证学历学位证书原版一模一样
制作(ucr毕业证书)加州大学河滨分校毕业证学历学位证书原版一模一样制作(ucr毕业证书)加州大学河滨分校毕业证学历学位证书原版一模一样
制作(ucr毕业证书)加州大学河滨分校毕业证学历学位证书原版一模一样
 
Gurgaon Industrial Business Association.pdf
Gurgaon Industrial Business Association.pdfGurgaon Industrial Business Association.pdf
Gurgaon Industrial Business Association.pdf
 
BEST FARMLAND FOR SALE | FARM PLOTS NEAR BANGALORE | KANAKAPURA | CHICKKABALP...
BEST FARMLAND FOR SALE | FARM PLOTS NEAR BANGALORE | KANAKAPURA | CHICKKABALP...BEST FARMLAND FOR SALE | FARM PLOTS NEAR BANGALORE | KANAKAPURA | CHICKKABALP...
BEST FARMLAND FOR SALE | FARM PLOTS NEAR BANGALORE | KANAKAPURA | CHICKKABALP...
 
Hawthorn Module 1 Coverted to Slide Show - 04.06.2024.docx
Hawthorn Module 1 Coverted to Slide Show - 04.06.2024.docxHawthorn Module 1 Coverted to Slide Show - 04.06.2024.docx
Hawthorn Module 1 Coverted to Slide Show - 04.06.2024.docx
 
Deutsche EuroShop | Company Presentation | 06/24
Deutsche EuroShop | Company Presentation | 06/24Deutsche EuroShop | Company Presentation | 06/24
Deutsche EuroShop | Company Presentation | 06/24
 
GT234 CADASTRAL SURVEYING gggggggggg.ppt
GT234 CADASTRAL SURVEYING gggggggggg.pptGT234 CADASTRAL SURVEYING gggggggggg.ppt
GT234 CADASTRAL SURVEYING gggggggggg.ppt
 
SVN Live 6.10.24 Weekly Property Broadcast
SVN Live 6.10.24 Weekly Property BroadcastSVN Live 6.10.24 Weekly Property Broadcast
SVN Live 6.10.24 Weekly Property Broadcast
 
Listing Turkey - Yeni Eyupevleri Istanbul
Listing Turkey - Yeni Eyupevleri IstanbulListing Turkey - Yeni Eyupevleri Istanbul
Listing Turkey - Yeni Eyupevleri Istanbul
 
HollandRow_17x11_Insert_Floorplan_Feature sheet.pdf
HollandRow_17x11_Insert_Floorplan_Feature sheet.pdfHollandRow_17x11_Insert_Floorplan_Feature sheet.pdf
HollandRow_17x11_Insert_Floorplan_Feature sheet.pdf
 
The KA Housing - Catalogue - Listing Turkey
The KA Housing - Catalogue - Listing TurkeyThe KA Housing - Catalogue - Listing Turkey
The KA Housing - Catalogue - Listing Turkey
 
House Construction Cost in Haldwani
House Construction Cost in Haldwani House Construction Cost in Haldwani
House Construction Cost in Haldwani
 

Presentation: Dr Yun - Charlotte

  • 1. Housing Market and Economic Outlook Lawrence Yun, Ph.D. Chief Economist NATIONAL ASSOCIATION OF REALTORS® Presentation at Charlotte Regional REALTOR® Association Charlotte, NC November 1, 2011
  • 2. U.S. Annual Existing Home Sales …Ready to Breakout? 8,000,000 7,000,000 6,000,000 5,000,000 4,000,000 3,000,000 2,000,000 1,000,000 0 1981 1982 1983 1984 1985 1986 1987 1988 1989 1990 1991 1992 1993 1994 1995 1996 1997 1998 1999 2000 2001 2002 2003 2004 2005 2006 2007 2008 2009 2010
  • 3. 3,000,000 3,500,000 4,000,000 4,500,000 5,000,000 5,500,000 6,000,000 6,500,000 7,000,000 2008 - Jan 2008 - Mar 2008 - May 2008 - Jul 2008 - Sep 2008 - Nov 2009 - Jan 2009 - Mar 2009 - May 2009 - Jul 2009 - Sep 2009 - Nov 2010 - Jan 2010 - Mar 2010 - May Tax Credit Impact 2010 - Jul 2010 - Sep 2010 - Nov 2011 - Jan Flat Line outside of Tax Credit Monthly Existing Home Sales … 2011 - Mar 2011 - May 2011 - Jul 2011 - Sep
  • 4. 0 1 2 3 4 5 6 7 8 9 2000 - Jan 2000 - Jul 2001 - Jan 2001 - Jul 2002 - Jan 2002 - Jul 2003 - Jan 2003 - Jul 2004 - Jan 2004 - Jul 2005 - Jan 2005 - Jul 30-year Mortgage 2006 - Jan 2006 - Jul 2007 - Jan 2007 - Jul 2008 - Jan 2008 - Jul Fed Funds 2009 - Jan 2009 - Jul 2010 - Jan … Despite Record Low Rates 2010 - Jul 2011 - Jan 2011 - Jul
  • 5. 0 2 4 6 8 10 -10 -8 -6 -4 -2 2000 - Q1 2000 - Q3 2001 - Q1 2001 - Q3 2002 - Q1 2002 - Q3 2003 - Q1 2003 - Q3 2004 - Q1 2004 - Q3 2005 - Q1 2005 - Q3 2006 - Q1 2006 - Q3 2007 - Q1 2007 - Q3 2008 - Q1 not 1% as in 1st half in 2011) 2008 - Q3 2009 - Q1 2009 - Q3 Economy Losing Momentum 2010 - Q1 2010 - Q3 2011 - Q1 (GDP growth after recession should be sustained 4% to 5% … Desired Pace 2011 - Q3
  • 6. Consumer Confidence in the Tanks 160 140 120 100 80 60 40 20 0 2000 - 2001 - 2002 - 2003 - 2004 - 2005 - 2006 - 2007 - 2008 - 2009 - 2010 - 2011 - Jan Jan Jan Jan Jan Jan Jan Jan Jan Jan Jan Jan
  • 7. 0 50 100 150 200 250 1990 1991 1992 1993 1994 1995 1996 1997 1998 1999 2000 2001 2002 2003 2004 2005 2006 2007 NC Home Sales - Annual 2008 2009 2010 2011
  • 8. 0 50 100 150 200 250 300 1990 - Jan 1991 - Jan 1992 - Jan 1993 - Jan 1994 - Jan 1995 - Jan 1996 - Jan 1997 - Jan 1998 - Jan 1999 - Jan 2000 - Jan 2001 - Jan 2002 - Jan 2003 - Jan 2004 - Jan 2005 - Jan 2006 - Jan 2007 - Jan 2008 - Jan 2009 - Jan 2010 - Jan Case-Shiller Index: Charlotte and Miami 2011 - Jan
  • 9. Charlotte Region Activity • September 2011 YTD … up 1.1% • September 2010 YTD … up 4.0% (with tax credit) • Inventory … down 20% • Closed average price … down 6.5% • Listed average price … up 5% • Case-Shiller price index … bottomed ??? … up 2 out of the past 3 months Source: CRRA 10K reports
  • 10. U.S. Housing Starts… Very Low and much below Long-term Average 2500 Housing Starts in thousands 2000 Long-term Average; 1500 Long-term Requirement 1000 500 0 2000 2001 2002 2003 2004 2005 2006 2007 2008 2009 2010 2011 - Jan - Jan - Jan - Jan - Jan - Jan - Jan - Jan - Jan - Jan - Jan - Jan
  • 11. 0 100 200 300 400 500 600 700 2000 - Feb 2000 - Aug 2001 - Feb 2001 - Aug In thousands 2002 - Feb 2002 - Aug 2003 - Feb 2003 - Aug 2004 - Feb 2004 - Aug 2005 - Feb 2005 - Aug 2006 - Feb 2006 - Aug (40 year lows) 2007 - Feb 2007 - Aug 2008 - Feb 2008 - Aug 2009 - Feb 2009 - Aug Newly Built Home Inventory 2010 - Feb 2010 - Aug 2011 - Feb 2011 - Aug
  • 13. Improving Factors for Higher Home Sales • Improving Factors – Job Creation (though slowly) – Stock market recovery from 2008 – Rising rents and larger pool of qualified renters – Buyers want distressed properties … at deep discounts – International buyers cashing in on the weakened dollar – Smart money chasing real estate • Potential Huge Positive … Lending opens up • Potential Huge Negative … Washington policy change
  • 14. 124000 126000 128000 130000 132000 134000 136000 138000 140000 2000 - Jan 2000 - Jul 2001 - Jan In thousands 2001 - Jul In thousands 2002 - Jan 2002 - Jul 2003 - Jan 2003 - Jul 2004 - Jan 2004 - Jul 2005 - Jan 2005 - Jul 2006 - Jan 2006 - Jul 2007 - Jan 2007 - Jul 2008 - Jan (1.3 million in the past 12 months) 2008 - Jul 2009 - Jan 2009 - Jul 2010 - Jan 2010 - Jul 2011 - Jan 6.5 million Total U.S. Payroll Jobs – Modest Recovery 2011 - Jul below prior peak
  • 15. 300 310 320 330 340 350 360 370 380 390 400 2000 - Jan 2000 - Jul 2001 - Jan In thousands 2001 - Jul In thousands 2002 - Jan 2002 - Jul 2003 - Jan 2003 - Jul 2004 - Jan 2004 - Jul 2005 - Jan 2005 - Jul 2006 - Jan 2006 - Jul 2007 - Jan 2007 - Jul 2008 - Jan 2008 - Jul 2009 - Jan North Dakota Jobs - Booming 2009 - Jul 2010 - Jan 2010 - Jul 2011 - Jan
  • 16. 8500 9000 9500 10000 10500 11000 2000 - Jan 2000 - Jul 2001 - Jan In thousands 2001 - Jul In thousands 2002 - Jan 2002 - Jul 2003 - Jan 2003 - Jul 2004 - Jan 2004 - Jul 2005 - Jan 2005 - Jul 2006 - Jan 2006 - Jul 2007 - Jan 2007 - Jul 2008 - Jan 2008 - Jul 2009 - Jan 2009 - Jul 2010 - Jan 2010 - Jul Texas Payroll Jobs – Fully Recovered 2011 - Jan
  • 17. 3500 3700 3900 4100 4300 4500 4700 4900 2000 - Jan 2000 - Jul In thousands 2001 - Jan In thousands 2001 - Jul 2002 - Jan 2002 - Jul 2003 - Jan 2003 - Jul 2004 - Jan 2004 - Jul 2005 - Jan 2005 - Jul 2006 - Jan 2006 - Jul 2007 - Jan 2007 - Jul 2008 - Jan 2008 - Jul Michigan Payroll Jobs – 2009 - Jan Ongoing Structural Changes 2009 - Jul 2010 - Jan 2010 - Jul 2011 - Jan
  • 18. 3500 3600 3700 3800 3900 4000 4100 4200 4300 2000 - Jan 2000 - Jul 2001 - Jan thousands 2001 - Jul InInthousands 2002 - Jan 2002 - Jul 2003 - Jan 2003 - Jul 2004 - Jan 2004 - Jul 2005 - Jan 2005 - Jul 2006 - Jan 2006 - Jul 2007 - Jan 2007 - Jul 2008 - Jan 2008 - Jul 2009 - Jan 2009 - Jul 2010 - Jan NC Jobs – Recovery Starting 2010 - Jul 2011 - Jan 2011 - Jul
  • 19. 400 450 500 550 600 650 700 750 800 850 900 1990 - Jan 1991 - Jan 1992 - Jan In thousands 1993 - Jan In thousands 1994 - Jan 1995 - Jan 1996 - Jan 1997 - Jan 1998 - Jan 1999 - Jan 2000 - Jan 2001 - Jan 2002 - Jan 2003 - Jan 2004 - Jan 2005 - Jan 2006 - Jan 2007 - Jan 2008 - Jan 2009 - Jan 2010 - Jan Charlotte Long-Term Job Growth 2011 - Jan
  • 20. 0 100 200 300 400 500 600 700 2000 - Jan 2000 - Jul 2001 - Jan In thousands 2001 - Jul In thousands 2002 - Jan 2002 - Jul 2003 - Jan 2003 - Jul 2004 - Jan 2004 - Jul 2005 - Jan 2005 - Jul 2006 - Jan 2006 - Jul 2007 - Jan 2007 - Jul 2008 - Jan 2008 - Jul Not Going under 400,000 2009 - Jan 2009 - Jul 2010 - Jan 2010 - Jul Weekly Fresh Unemployment Claims … 2011 - Jan 2011 - Jul
  • 21. Financial Asset at $45 trillion … Good Recovery from 2008 55000 50000 45000 40000 35000 30000 2000 - 2001 - 2002 - 2003 - 2004 - 2005 - 2006 - 2007 - 2008 - 2009 - 2010 - 2011 - Q1 Q1 Q1 Q1 Q1 Q1 Q1 Q1 Q1 Q1 Q1 Q1 est. Source: Federal Reserve
  • 22. 5000 6000 7000 8000 9000 10000 11000 12000 13000 14000 2000 - Q1 2000 - Q3 2001 - Q1 2001 - Q3 2002 - Q1 2002 - Q3 Source: Federal Reserve 2003 - Q1 2003 - Q3 2004 - Q1 2004 - Q3 2005 - Q1 2005 - Q3 2006 - Q1 2006 - Q3 2007 - Q1 2007 - Q3 2008 - Q1 2008 - Q3 2009 - Q1 2009 - Q3 small business owners) … Down 2010 - Q1 Housing Equity (source of funds for 2010 - Q3 2011 - Q1
  • 23. 0 1 2 3 4 5 -1 6 % 2000 - Jan 2000 - Jul 2001 - Jan 2001 - Jul 2002 - Jan 2002 - Jul 2003 - Jan 2003 - Jul 2004 - Jan 2004 - Jul 2005 - Jan 2005 - Jul 2006 - Jan 2006 - Jul 2007 - Jan 2007 - Jul 2008 - Jan 2008 - Jul (3-month moving avg., annualized rate) CPI Apartment Rent 2009 - Jan 2009 - Jul 2010 - Jan 2010 - Jul 2011 - Jan 2011 - Jul
  • 24. Home Price vs Rent (index = 100 in 1980) rent price 450.0 400.0 350.0 300.0 250.0 200.0 150.0 100.0 50.0 0.0 1980 - 1984 - 1988 - 1992 - 1996 - 2000 - 2004 - 2008 - Jan Jan Jan Jan Jan Jan Jan Jan
  • 25. Serious Delinquent Mortgages … Mostly those who took out loans in bubble years (90+ days late or in foreclosure process) 12.0 In millions 10.0 8.0 6.0 4.0 2.0 0.0 2000 - Q1 2000 - Q3 2001 - Q1 2001 - Q3 2002 - Q1 2002 - Q3 2003 - Q1 2003 - Q3 2004 - Q1 2004 - Q3 2005 - Q1 2005 - Q3 2006 - Q1 2006 - Q3 2007 - Q1 2007 - Q3 2008 - Q1 2008 - Q3 2009 - Q1 2009 - Q3 2010 - Q1 2010 - Q3 2011 - Q1 U.S. NC In 2010, there were 1.5 million distressed sales … need to wait 2.7 years
  • 26. Distress Sales: 30% to 40% of Transactions Will Remain Significant for Next 2 years 55% 50% 45% 40% 35% 30% 25% 20% 2008 - 2009 - 2009 - 2009 - 2009 - 2010 - 2010 - 2010 - 2010 - 2011 - 2011 - Oct Jan Apr Jul Oct Jan Apr Jul Oct Jan Apr
  • 27. Very Low Default among Recent Homebuyers Fannie and Freddie Backed Mortgage Loan Performance Fannie Mae Cumulative Freddie Mac Cumulative Vintage Default Rate Vintage Default Rate after 18 months after 18 months 2002 3.1% 2002 2.7% 2003 2.5% 2003 1.2% 2004 4.6% 2004 2.0% 2005 4.8% 2005 1.8% 2006 11.6% 2006 6.0% 2007 28.7% 2007 22.3% 2008 12.6% 2008 13.7% 2009 1.2% 2009 1.1% Source: Federal Housing Finance Agency
  • 28. Smart Money Buying? • All-cash record high at 30% to 35% of all sales – Investors want quick deals – Investors cannot get mortgage – Some do not want to bother with appraisals – Financial asset recovery helping with cash – Hedge against future inflation … alternative to expensive gold – Hedge against future housing shortage? – Empty nesters downsizing and using leftover cash for kids’ home?
  • 29. 0 5 10 15 20 -20 -15 -10 -5 1969 - Jan 1971 - Jan 1973 - Jan 1975 - Jan 1977 - Jan 1979 - Jan 1981 - Jan 1983 - Jan 1985 - Jan 1987 - Jan 1989 - Jan 1991 - Jan 1993 - Jan 1995 - Jan 1997 - Jan 1999 - Jan 2001 - Jan (single-family home price in blue vs CPI in red) 2003 - Jan Real Estate as Inflation Hedge? Good inflation hedge in the past before the housing bubble/bust 2005 - Jan 2007 - Jan 2009 - Jan 2011 - Jan
  • 30. 0 1 2 3 4 5 6 -2 -1 2000 - Jan 2000 - Jul 2001 - Jan 2001 - Jul 2002 - Jan 2002 - Jul 2003 - Jan 2003 - Jul 2004 - Jan 2004 - Jul 2005 - Jan 2005 - Jul 2006 - Jan 2006 - Jul 2007 - Jan 2007 - Jul 2008 - Jan (% change from one year ago) • Workers Wage to rise by 1.7% in 2011 2008 - Jul CPI Inflation Rising 2009 - Jan 2009 - Jul 2010 - Jan 2010 - Jul • Social Security COLA forecast to rise 3.5% in 2012 2011 - Jan 2011 - Jul
  • 31. Broad Inflationary Pressure Indicator % change from one year ago Consumer Price Index 3.8% Producer Price Index (Finished Product) 6.5% Producer Price Index (Intermediate Product) 7.5% Producer Price Index (Crude Product) 24.2% Dow Jones Commodity Spot Price Index 28.3% Gold Price Off Record High Price … but very high
  • 33. Average Credit Score for Loan Origination Normal 2009 2010 If Fannie 720 761 762 720 Freddie 720 757 758 720 FHA 650 682 698 660 15% to 20% Higher Sales
  • 35. Washington Policy Change? • QRM and 20% downpayment requirement ??? – Affordability (staying within budget) more important than down payment – No taxpayer bailout for FHA and VA program • Limit mortgage interest deduction for high income and second homes ??? – Crush the working class in resort areas (Yacht Tax Impact) – Cascading impact to middle class homes and hurts confidence to buy a home • Lower conforming loan limit ??? • Fannie and Freddie model was flawed (private profit/taxpayer loss) and need a fundamental restructuring … not total privatization – Jumbo interest rates on all loans? – Non-existent loans in times of crisis?
  • 36. National Museum of American History • 4 million no-down-payment VA mortgages for World War II veterans • Fueled an unprecedented growth of America’s middle class
  • 37. Real Estate Baseline Outlook • Moderate GDP Expansion 1.5% to 2.5% in the next 2 years • 1.0 to 1.5 million annual job additions yearly in the next 2 years • Mortgage Rates rising to 4.3% by year-end 2011 and 5.0% in 2012 • Not that important compared to underwriting standards • Home sales – no reason to go lower … slight increases next 2 years • Home values – steady and slow growth in the national price in the next 2 years … critical source of small business start-up funds • Commercial : net absorption rising, vacancy rates falling, cap rates falling
  • 38. Presidential Quotes • Franklin Delano Roosevelt: “A nation of homeowners is unconquerable.” • Ronald Reagan “We will preserve the part of the American dream which the mortgage-interest deduction symbolizes."
  • 39. For More Information – Daily Data and Analysis on Latest Trends – http://www.facebook.com/narresearchgroup – Twitter @NAR_Research