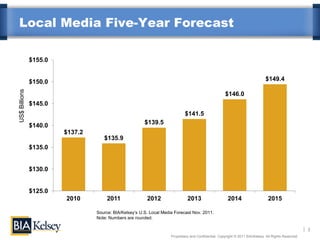
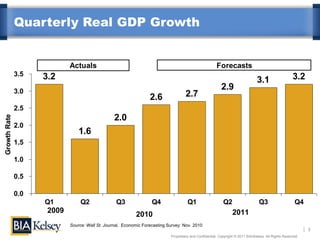
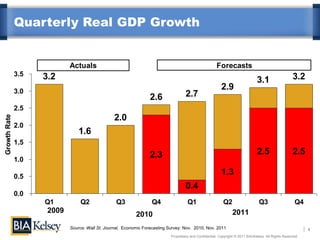
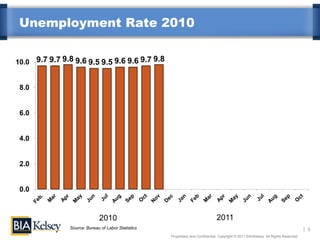
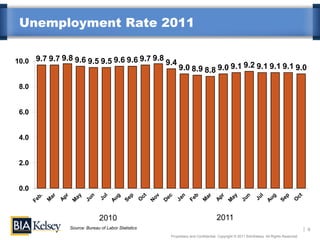
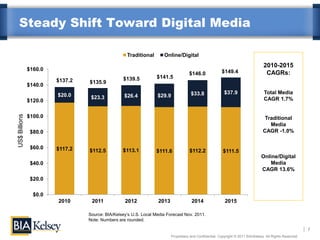
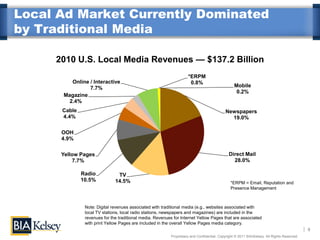
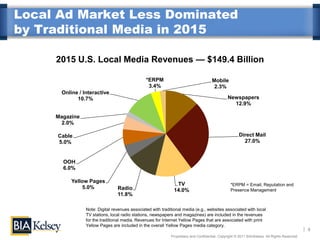
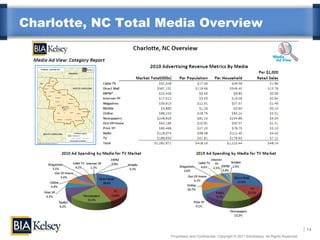
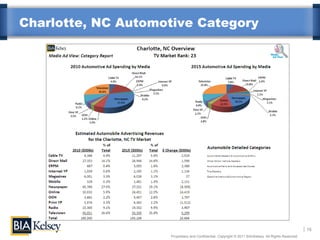
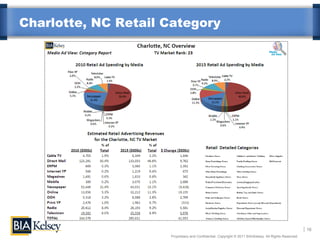
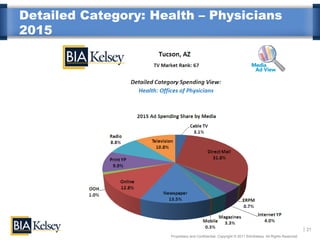
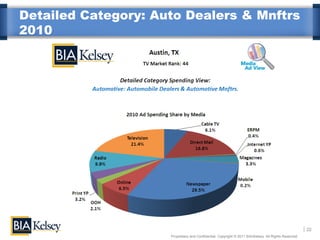
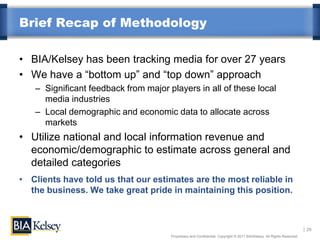
Webinar

Where’s the Money in Local Media?
     Before You Plan and Budget,
     Track the Shifting Ad Dollars
             November 16, 2011


             Dial-In Information:
            Toll: +1 (914) 339-0033
           Access Code: 688-595-848
Introduction & Agenda

• Welcome, and thank you for joining us
• Our discussion points:
   – Economic Overview                                                                Mark Fratrik
                                                                                      VP, Research
   – National Forecast (Traditional vs. Digital)
   – Share Shifts: 2010 - 2015
   – Competition in Local Markets
   – Local Market Estimates                                                           Steve Passwaiter
                                                                                      VP, Business
   – Budgeting with Media Ad View - Local Ad                                          Development
     Reports
   – Detailed examination of two markets
   – Live Questions, FAQs
                                                                                      Omar Wardak
                                                                                      Senior Researcher


                                                                                                                        1
                                      Proprietary and Confidential. Copyright © 2011 BIA/Kelsey. All Rights Reserved.
Local Media Five-Year Forecast

               $155.0


               $150.0                                                                                                          $149.4
US$ Billions


                                                                                                      $146.0
               $145.0
                                                                             $141.5
                                                        $139.5
               $140.0
                        $137.2
                                    $135.9
               $135.0


               $130.0


               $125.0
                        2010          2011               2012                  2013                     2014                     2015

                                 Source: BIA/Kelsey’s U.S. Local Media Forecast Nov. 2011.
                                 Note: Numbers are rounded.

                                                                                                                                                       2
                                                                     Proprietary and Confidential. Copyright © 2011 BIA/Kelsey. All Rights Reserved.
Quarterly Real GDP Growth


                            Actuals                                                                     Forecasts
              3.5   3.2                                                                                                                                3.2
                                                                                                                                 3.1
              3.0
                                                                                                           2.9
                                                                  2.6               2.7
              2.5
                                                 2.0
Growth Rate


              2.0
                                1.6
              1.5

              1.0

              0.5

              0.0
                    Q1           Q2               Q3               Q4                 Q1                    Q2                    Q3                    Q4
                     2009                                                                                         2011
                                                           2010
                            Source: Wall St. Journal, Economic Forecasting Survey: Nov. 2010
                                                                                                                                                              3
                                                                            Proprietary and Confidential. Copyright © 2011 BIA/Kelsey. All Rights Reserved.
Quarterly Real GDP Growth


                            Actuals                                                                     Forecasts
              3.5   3.2                                                                                                                                3.2
                                                                                                                                 3.1
              3.0
                                                                                                           2.9
                                                                  2.6               2.7
              2.5
                                                 2.0
Growth Rate


              2.0
                                1.6
              1.5
                                                                  2.3                                                            2.5                   2.5
              1.0

              0.5
                                                                                                           1.3
                                                                                    0.4
              0.0
                    Q1           Q2               Q3               Q4                 Q1                    Q2                    Q3                    Q4
                     2009                                                                                         2011
                                                           2010
                            Source: Wall St. Journal, Economic Forecasting Survey: Nov. 2010, Nov. 2011                                                       4
                                                                            Proprietary and Confidential. Copyright © 2011 BIA/Kelsey. All Rights Reserved.
Unemployment Rate 2010


10.0 9.7 9.7 9.8 9.6 9.5 9.5 9.6 9.6 9.7 9.8


 8.0


 6.0


 4.0


 2.0


 0.0


                              2010                                               2011
                Source: Bureau of Labor Statistics                                                                                     5
                                                     Proprietary and Confidential. Copyright © 2011 BIA/Kelsey. All Rights Reserved.
Unemployment Rate 2011

10.0 9.7 9.7 9.8 9.6 9.5 9.5 9.6 9.6 9.7 9.8 9.4
                                                         9.0 8.9 8.8 9.0 9.1 9.2 9.1 9.1 9.1 9.0

 8.0


 6.0


 4.0


 2.0


 0.0


                              2010                                               2011
                Source: Bureau of Labor Statistics                                                                                     6
                                                     Proprietary and Confidential. Copyright © 2011 BIA/Kelsey. All Rights Reserved.
Steady Shift Toward Digital Media

                                                   Traditional       Online/Digital
                                                                                                                                   2010-2015
               $160.0                                                                                    $149.4
                                                                                     $146.0                                         CAGRs:
                                                 $139.5           $141.5
                        $137.2   $135.9
               $140.0
                        $20.0                                                         $33.8               $37.9                    Total Media
                                  $23.3           $26.4           $29.9
               $120.0                                                                                                              CAGR 1.7%
US$ Billions


               $100.0                                                                                                               Traditional
                                                                                                                                      Media
                $80.0                                                                                                              CAGR -1.0%


                $60.0   $117.2   $112.5          $113.1           $111.6             $112.2               $111.5
                                                                                                                                  Online/Digital
                $40.0                                                                                                                 Media
                                                                                                                                  CAGR 13.6%
                $20.0

                 $0.0
                        2010      2011            2012            2013                2014                 2015

                                 Source: BIA/Kelsey’s U.S. Local Media Forecast Nov. 2011.
                                 Note: Numbers are rounded.

                                                                                                                                                            7
                                                                          Proprietary and Confidential. Copyright © 2011 BIA/Kelsey. All Rights Reserved.
Local Ad Market Currently Dominated
by Traditional Media

     2010 U.S. Local Media Revenues — $137.2 Billion
                                                                    *ERPM
         Online / Interactive                                        0.8%
                7.7%                                                                             Mobile
                                                                                                  0.2%
      Magazine
        2.4%
      Cable                                                                                Newspapers
      4.4%                                                                                   19.0%

      OOH
      4.9%

      Yellow Pages                                                                           Direct Mail
          7.7%                                                                                 28.0%

              Radio            TV
              10.5%           14.5%                                                           *ERPM = Email, Reputation and
                                                                                              Presence Management


               Note: Digital revenues associated with traditional media (e.g., websites associated with
               local TV stations, local radio stations, newspapers and magazines) are included in the
               revenues for the traditional media. Revenues for Internet Yellow Pages that are associated
               with print Yellow Pages are included in the overall Yellow Pages media category.
                                                                                                                                            8
                                                          Proprietary and Confidential. Copyright © 2011 BIA/Kelsey. All Rights Reserved.
Local Ad Market Less Dominated
by Traditional Media in 2015

     2015 U.S. Local Media Revenues — $149.4 Billion

                                               *ERPM                                 Mobile
                                                3.4%                                  2.3%
      Online / Interactive
            10.7%                                                                              Newspapers
                                                                                                 12.9%

     Magazine
       2.0%

     Cable                                                                                            Direct Mail
     5.0%                                                                                               27.0%


       OOH
       6.0%

          Yellow Pages
                                                               TV                               *ERPM = Email, Reputation and
              5.0%              Radio                         14.0%                             Presence Management
                                11.8%

                Note: Digital revenues associated with traditional media (e.g., websites associated with local
                TV stations, local radio stations, newspapers and magazines) are included in the revenues
                for the traditional media. Revenues for Internet Yellow Pages that are associated with print
                Yellow Pages are included in the overall Yellow Pages media category.
                                                                                                                                              9
                                                            Proprietary and Confidential. Copyright © 2011 BIA/Kelsey. All Rights Reserved.
Competitive Local Media Markets

• Information these days is critical. Why?
   –   More in-market competition
   –   Digital ad share shifts
   –   Consumer preferences
   –   Emerging new growth categories


                                                                                                                      10
                                    Proprietary and Confidential. Copyright © 2011 BIA/Kelsey. All Rights Reserved.
Analyzing the Local Ad Market

• Clients have told us – they need detailed local market
  information so they can see exactly what is happening in their
  market

• In response, we have developed Media Ad View:
   – Provides a detailed picture of advertising trends for every local market
   – Covers advertising spending by media for the most recent year and for
     five years out (2010-2015)
   – Drills down into 93 detailed categories (e.g., tire dealers, women’s
     clothing stores, physicians) for different types of businesses
   – Delivers the details necessary to understand and evolve with the rapid
     share shift environment that continues to transform the media industry


                                                                                                                            11
                                          Proprietary and Confidential. Copyright © 2011 BIA/Kelsey. All Rights Reserved.
Ad Spend by Media Category

Media                              General Advertising
Categories                         Categories
•   Mobile                         •       Automobile
•   ERPM (E-mail, Reputation and   •       Education
    Presence Management)
                                   •       Financial/Insurance
•   Online Advertising
•   Radio
                                   •       General Services
•   Newspaper                      •       Government/Religion
•   Television                     •       Health Care
•   Cable TV                       •       Leisure/Recreation
•   Internet Yellow Pages          •       Media
•   Print Yellow Pages             •       Real Estate
•   Magazines
                                   •       Restaurants
•   Out-Of-Home
                                   •       Retail
•   Direct Mail
                                   •       Technology


                                                                                                                         12
                                       Proprietary and Confidential. Copyright © 2011 BIA/Kelsey. All Rights Reserved.
93 Detailed Categories
Automobile Dealers & Automotive Mnftrs.    Landscaping Services
                                                                                            Home Furnishings Stores
Other Motor Vehicle Dealers                Offices of Physicians
                                                                                            Floor Covering Stores
Automotive Parts and Accessories Stores    Offices of Dentists
                                                                                            Other Home Furnishings Stores
Tire Dealers                               Offices of Chiropractors
                                                                                            Household Appliance Stores
Gasoline Stations & Automotive Repair      Offices of Optometrists
                                                                                            Radio, Television, and Other Electronics
Business Schools and Computer              Hospitals
                                                                                            Computer and Software Stores
Technical and Trade Schools                Nursing and Residential Care
                                                                                            Home Centers
Other Schools and Instruction              Veterinary Services
                                                                                            Paint and Wallpaper Stores
Educational Support Services               Pharmacies and Drug Stores
                                                                                            Hardware Stores
Commercial banking                         Hotels-Motels
                                                                                            Lawn and Garden Equipment Stores
Savings institutions                       Airline Transportation
                                                                                            Men's Clothing Stores
Credit unions, federally chartered         RV (Recreational Vehicle) Parks
                                                                                            Women's Clothing Stores
Securities brokerage                       Performing Arts Companies
                                                                                            Children's and Infants' Clothing Stores
Portfolio management                       Spectator Sports
                                                                                            Family Clothing Stores
Investment advice                          Museums, Historical Sites Amusement
                                                                                            Clothing Accessories Stores
Direct life insurance carriers             Parks and Arcades
                                                                                            Other Clothing Stores
Direct health and medical insurance        Gambling Industries
                                                                                            Shoe Stores
Auto Insurance                             Other Amusement and Recreation
                                                                                            Jewelry, Luggage, and Leather Stores
Direct property and casualty insurance     Motion Picture and Video
                                                                                            Sporting Goods Stores
Insurance agencies and brokerages          Newspaper Publishers
                                                                                            Hobby, Toy, and Game Stores
Legal Services                             Periodical Publishers
                                                                                            Book Stores
Accounting, Tax Preparation, Bookkeeping   Radio Stations
                                                                                            Department Stores
Architectural, Engineering Services        Television Broadcasting
                                                                                            Discount Department Stores
Specialized Design Services                Cable and Other Subscription
                                                                                            Warehouse Clubs and Supercenters
Computer Systems Design and Related        Programming
                                                                                            All Other General Merchandise Stores
Management, Scientific, and Technical      Full-Service Restaurants
                                                                                            Office Supplies and Stationery Stores
Scientific Research and Development        QSR/Fast Foods
                                                                                            Gift, Novelty, and Souvenir Stores
Advertising, Public Relations Services     Special Food Services
                                                                                            Wired Telecommunications Carriers
Other Professional, Scientific Technical   Bars
                                                                                            Wireless Telecommunications Carriers
Temporary Help Services                    Supermarkets and Other Grocery
                                                                                            Other Telecommunications
Janitorial Services                        Convenience Stores
                                           Beer and Wine, and Liquor Stores
                                           Furniture Stores
                                                                                                                                                 13
                                                               Proprietary and Confidential. Copyright © 2011 BIA/Kelsey. All Rights Reserved.
Charlotte, NC Total Media Overview


                                                                                                       14
                     Proprietary and Confidential. Copyright © 2011 BIA/Kelsey. All Rights Reserved.
Charlotte, NC Automotive Category


                                                                                                      15
                    Proprietary and Confidential. Copyright © 2011 BIA/Kelsey. All Rights Reserved.
Charlotte, NC Retail Category


                                                                                                       16
                     Proprietary and Confidential. Copyright © 2011 BIA/Kelsey. All Rights Reserved.
Charlotte, NC Retail Category

            Furniture Stores
            Children's and Infants' Clothing
            Office Supplies
            Home Furnishings Stores
            Family Clothing Stores
            Gift/Souvenir
            Floor Covering Stores
            Clothing Accessories Stores
            Other Home Furnishings
            Other Clothing Stores
            Household Appliance Stores
            Shoe Stores
            Radio/Television/ Electronics
            Jewelry,/Luggage/Leather
            Computer /Software Stores
            Sporting Goods Stores
            Home Centers
            Hobby, Toy, and Game Stores
            Paint and Wallpaper Stores
            Book Stores
            Hardware Stores
            Department Stores (except Discount
            Department)
            Lawn/Garden/Supplies Stores
            Discount Department Stores
            Men's Clothing Stores
            Warehouse Clubs and Supercenters
            Women's Clothing Stores
            All Other General Merchandise Stores


                                                                                                                           17
                                         Proprietary and Confidential. Copyright © 2011 BIA/Kelsey. All Rights Reserved.
Interactive Report Building

• Media Ad View: Detailed Category Reports include an
  Interactive Excel™ file in which a subcategory can be
  selected to generate a series of pie charts and tables that
  examine that category in a local market.

• Data charts include:
   – Ad spending share by media for the current year and for each
     year five years out.
   – Estimated Annual Advertising Revenues
   – Share of Total Annual Advertising Revenues by Media
   – Annual Growth in Advertising Revenues by Media

• Let’s look at some of the data.


                                                                                                                      18
                                    Proprietary and Confidential. Copyright © 2011 BIA/Kelsey. All Rights Reserved.
19
Proprietary and Confidential. Copyright © 2011 BIA/Kelsey. All Rights Reserved.
Detailed Category: Health – Physicians
2010


                                                                                                       20
                     Proprietary and Confidential. Copyright © 2011 BIA/Kelsey. All Rights Reserved.
Detailed Category: Health – Physicians
2015


                                                                                                       21
                     Proprietary and Confidential. Copyright © 2011 BIA/Kelsey. All Rights Reserved.
Detailed Category: Auto Dealers & Mnftrs
2010


                                                                                                       22
                     Proprietary and Confidential. Copyright © 2011 BIA/Kelsey. All Rights Reserved.
Detailed Category: Auto Dealers & Mnftrs
2015


                                                                                                       23
                     Proprietary and Confidential. Copyright © 2011 BIA/Kelsey. All Rights Reserved.
How Clients Use MAV Reports

• What our clients have told us:
   – Identify ALL the competition in the market – not just
     the ones in your specific media
   – Zero in on the revenue drivers in your particular market
       • Track where there’s major spending in a category right now
       • Track where local ad dollars are shifting
       • Plan and budget for these changes

   – Prepare effective media plans for different Ad prospects
       • Determine platform strategies based on future growth and metrics for
         different ad categories
       • Determine the potential budgets of prospects to prepare a “winnable” sales
         strategy

   – Create professional, effective sales collateral
   – Train sales teams as multi-platform Ad consultants

                                                                                                                               24
                                             Proprietary and Confidential. Copyright © 2011 BIA/Kelsey. All Rights Reserved.
Brief Recap of Methodology

• BIA/Kelsey has been tracking media for over 27 years
• We have a “bottom up” and “top down” approach
   – Significant feedback from major players in all of these local
     media industries
   – Local demographic and economic data to allocate across
     markets
• Utilize national and local information revenue and
  economic/demographic to estimate across general and
  detailed categories
• Clients have told us that our estimates are the most reliable in
  the business. We take great pride in maintaining this position.


                                                                                                                        25
                                      Proprietary and Confidential. Copyright © 2011 BIA/Kelsey. All Rights Reserved.
Special Purchase Offer

• Current List price:
   – $2,495/market

• Webinar promo:
   –   $1,995/market.
   –   Want multiple markets? Bundle offer available.
   –   Must be purchased by Nov. 30, 2011
   –   Visit: www.biakelsey.com/MAV for report details.
   –   To purchase, email: sales@biakelsey.com or call: (703) 818-2425


                                                                                                                           26
                                         Proprietary and Confidential. Copyright © 2011 BIA/Kelsey. All Rights Reserved.
Frequently Asked Questions


                                                                                                27
              Proprietary and Confidential. Copyright © 2011 BIA/Kelsey. All Rights Reserved.
How are the various media estimates generated
especially in the smallest markets?

Answer:
  • Both bottom up and top down approaches - depending upon the
    specific media

  • Local economic and demographic data are taken into account
    when allocating the national estimates for specific markets

  • Projections on the growth of population, retail sales, and
    aggregate disposable income

  • Other local factors (e.g., relative health of local economy, other
    events affecting local economy, etc.)


                                                                                                                        28
                                      Proprietary and Confidential. Copyright © 2011 BIA/Kelsey. All Rights Reserved.
What does the Total Local Television Market
Revenue Estimate include?

Answer:
  • All over-the-air advertising revenues generated from both national and
    local advertisers including political advertising revenues

  • All online revenues generated by local television stations

  • Does not include:

      • Any network advertising

      • Retransmission consent revenues

      • Trade and barter

      • Production revenues


                                                                                                                          29
                                        Proprietary and Confidential. Copyright © 2011 BIA/Kelsey. All Rights Reserved.
Can we get more details on the online advertising
components (e.g., how much is search, display)?

Answer:
  • Media Ad View is a product that we are constantly updating and
    refining.
  • Currently, we are in the process of developing those estimates
    based upon local information obtainable on search activity within
    each and every market.
  • Considerable amount of data is being collected to generate
    those market specific estimates.
  • If you purchase a report now, this update will be provided to you
    as soon as it is available.


                                                                                                                      30
                                    Proprietary and Confidential. Copyright © 2011 BIA/Kelsey. All Rights Reserved.
Special Purchase Offer

• Current List price:
   – $2,495/market

• Webinar promo:
   –   $1,995/market.
   –   Want multiple markets? Bundle offer available.
   –   Must be purchased by Nov. 30, 2011
   –   Visit: www.biakelsey.com/MAV for report details.
   –   To purchase, email: sales@biakelsey.com or call: (703) 818-2425


                                                                                                                           31
                                         Proprietary and Confidential. Copyright © 2011 BIA/Kelsey. All Rights Reserved.
Questions and comments:
Mark Fratrik | mfratrik@biakelsey.com | 703.818.2425
Steve Passwaiter | spasswaiter@biakelsey.com | 703.818.2425
Omar Wardak | owardak@biaklesy.com | 703.818.2425


                                           Copyright © 2011 BIA/Kelsey. All Rights Reserved.

 This published material is for internal client use only. It may not be duplicated or distributed in any manner not permitted by contract. Any
  unauthorized distribution could result in termination of the client relationship, fines and other civil or criminal penalties under federal law.
BIA/Kelsey disclaims all warranties regarding the accuracy of the information herein and similarly disclaims any liability for direct, indirect or
                          consequential damages that may result from the use or interpretation of this information.

Wheres the-money-in-local-media

  • 1.
    Webinar Where’s the Moneyin Local Media? Before You Plan and Budget, Track the Shifting Ad Dollars November 16, 2011 Dial-In Information: Toll: +1 (914) 339-0033 Access Code: 688-595-848
  • 2.
    Introduction & Agenda •Welcome, and thank you for joining us • Our discussion points: – Economic Overview Mark Fratrik VP, Research – National Forecast (Traditional vs. Digital) – Share Shifts: 2010 - 2015 – Competition in Local Markets – Local Market Estimates Steve Passwaiter VP, Business – Budgeting with Media Ad View - Local Ad Development Reports – Detailed examination of two markets – Live Questions, FAQs Omar Wardak Senior Researcher 1 Proprietary and Confidential. Copyright © 2011 BIA/Kelsey. All Rights Reserved.
  • 3.
    Local Media Five-YearForecast $155.0 $150.0 $149.4 US$ Billions $146.0 $145.0 $141.5 $139.5 $140.0 $137.2 $135.9 $135.0 $130.0 $125.0 2010 2011 2012 2013 2014 2015 Source: BIA/Kelsey’s U.S. Local Media Forecast Nov. 2011. Note: Numbers are rounded. 2 Proprietary and Confidential. Copyright © 2011 BIA/Kelsey. All Rights Reserved.
  • 4.
    Quarterly Real GDPGrowth Actuals Forecasts 3.5 3.2 3.2 3.1 3.0 2.9 2.6 2.7 2.5 2.0 Growth Rate 2.0 1.6 1.5 1.0 0.5 0.0 Q1 Q2 Q3 Q4 Q1 Q2 Q3 Q4 2009 2011 2010 Source: Wall St. Journal, Economic Forecasting Survey: Nov. 2010 3 Proprietary and Confidential. Copyright © 2011 BIA/Kelsey. All Rights Reserved.
  • 5.
    Quarterly Real GDPGrowth Actuals Forecasts 3.5 3.2 3.2 3.1 3.0 2.9 2.6 2.7 2.5 2.0 Growth Rate 2.0 1.6 1.5 2.3 2.5 2.5 1.0 0.5 1.3 0.4 0.0 Q1 Q2 Q3 Q4 Q1 Q2 Q3 Q4 2009 2011 2010 Source: Wall St. Journal, Economic Forecasting Survey: Nov. 2010, Nov. 2011 4 Proprietary and Confidential. Copyright © 2011 BIA/Kelsey. All Rights Reserved.
  • 6.
    Unemployment Rate 2010 10.09.7 9.7 9.8 9.6 9.5 9.5 9.6 9.6 9.7 9.8 8.0 6.0 4.0 2.0 0.0 2010 2011 Source: Bureau of Labor Statistics 5 Proprietary and Confidential. Copyright © 2011 BIA/Kelsey. All Rights Reserved.
  • 7.
    Unemployment Rate 2011 10.09.7 9.7 9.8 9.6 9.5 9.5 9.6 9.6 9.7 9.8 9.4 9.0 8.9 8.8 9.0 9.1 9.2 9.1 9.1 9.1 9.0 8.0 6.0 4.0 2.0 0.0 2010 2011 Source: Bureau of Labor Statistics 6 Proprietary and Confidential. Copyright © 2011 BIA/Kelsey. All Rights Reserved.
  • 8.
    Steady Shift TowardDigital Media Traditional Online/Digital 2010-2015 $160.0 $149.4 $146.0 CAGRs: $139.5 $141.5 $137.2 $135.9 $140.0 $20.0 $33.8 $37.9 Total Media $23.3 $26.4 $29.9 $120.0 CAGR 1.7% US$ Billions $100.0 Traditional Media $80.0 CAGR -1.0% $60.0 $117.2 $112.5 $113.1 $111.6 $112.2 $111.5 Online/Digital $40.0 Media CAGR 13.6% $20.0 $0.0 2010 2011 2012 2013 2014 2015 Source: BIA/Kelsey’s U.S. Local Media Forecast Nov. 2011. Note: Numbers are rounded. 7 Proprietary and Confidential. Copyright © 2011 BIA/Kelsey. All Rights Reserved.
  • 9.
    Local Ad MarketCurrently Dominated by Traditional Media 2010 U.S. Local Media Revenues — $137.2 Billion *ERPM Online / Interactive 0.8% 7.7% Mobile 0.2% Magazine 2.4% Cable Newspapers 4.4% 19.0% OOH 4.9% Yellow Pages Direct Mail 7.7% 28.0% Radio TV 10.5% 14.5% *ERPM = Email, Reputation and Presence Management Note: Digital revenues associated with traditional media (e.g., websites associated with local TV stations, local radio stations, newspapers and magazines) are included in the revenues for the traditional media. Revenues for Internet Yellow Pages that are associated with print Yellow Pages are included in the overall Yellow Pages media category. 8 Proprietary and Confidential. Copyright © 2011 BIA/Kelsey. All Rights Reserved.
  • 10.
    Local Ad MarketLess Dominated by Traditional Media in 2015 2015 U.S. Local Media Revenues — $149.4 Billion *ERPM Mobile 3.4% 2.3% Online / Interactive 10.7% Newspapers 12.9% Magazine 2.0% Cable Direct Mail 5.0% 27.0% OOH 6.0% Yellow Pages TV *ERPM = Email, Reputation and 5.0% Radio 14.0% Presence Management 11.8% Note: Digital revenues associated with traditional media (e.g., websites associated with local TV stations, local radio stations, newspapers and magazines) are included in the revenues for the traditional media. Revenues for Internet Yellow Pages that are associated with print Yellow Pages are included in the overall Yellow Pages media category. 9 Proprietary and Confidential. Copyright © 2011 BIA/Kelsey. All Rights Reserved.
  • 11.
    Competitive Local MediaMarkets • Information these days is critical. Why? – More in-market competition – Digital ad share shifts – Consumer preferences – Emerging new growth categories 10 Proprietary and Confidential. Copyright © 2011 BIA/Kelsey. All Rights Reserved.
  • 12.
    Analyzing the LocalAd Market • Clients have told us – they need detailed local market information so they can see exactly what is happening in their market • In response, we have developed Media Ad View: – Provides a detailed picture of advertising trends for every local market – Covers advertising spending by media for the most recent year and for five years out (2010-2015) – Drills down into 93 detailed categories (e.g., tire dealers, women’s clothing stores, physicians) for different types of businesses – Delivers the details necessary to understand and evolve with the rapid share shift environment that continues to transform the media industry 11 Proprietary and Confidential. Copyright © 2011 BIA/Kelsey. All Rights Reserved.
  • 13.
    Ad Spend byMedia Category Media General Advertising Categories Categories • Mobile • Automobile • ERPM (E-mail, Reputation and • Education Presence Management) • Financial/Insurance • Online Advertising • Radio • General Services • Newspaper • Government/Religion • Television • Health Care • Cable TV • Leisure/Recreation • Internet Yellow Pages • Media • Print Yellow Pages • Real Estate • Magazines • Restaurants • Out-Of-Home • Retail • Direct Mail • Technology 12 Proprietary and Confidential. Copyright © 2011 BIA/Kelsey. All Rights Reserved.
  • 14.
    93 Detailed Categories AutomobileDealers & Automotive Mnftrs. Landscaping Services Home Furnishings Stores Other Motor Vehicle Dealers Offices of Physicians Floor Covering Stores Automotive Parts and Accessories Stores Offices of Dentists Other Home Furnishings Stores Tire Dealers Offices of Chiropractors Household Appliance Stores Gasoline Stations & Automotive Repair Offices of Optometrists Radio, Television, and Other Electronics Business Schools and Computer Hospitals Computer and Software Stores Technical and Trade Schools Nursing and Residential Care Home Centers Other Schools and Instruction Veterinary Services Paint and Wallpaper Stores Educational Support Services Pharmacies and Drug Stores Hardware Stores Commercial banking Hotels-Motels Lawn and Garden Equipment Stores Savings institutions Airline Transportation Men's Clothing Stores Credit unions, federally chartered RV (Recreational Vehicle) Parks Women's Clothing Stores Securities brokerage Performing Arts Companies Children's and Infants' Clothing Stores Portfolio management Spectator Sports Family Clothing Stores Investment advice Museums, Historical Sites Amusement Clothing Accessories Stores Direct life insurance carriers Parks and Arcades Other Clothing Stores Direct health and medical insurance Gambling Industries Shoe Stores Auto Insurance Other Amusement and Recreation Jewelry, Luggage, and Leather Stores Direct property and casualty insurance Motion Picture and Video Sporting Goods Stores Insurance agencies and brokerages Newspaper Publishers Hobby, Toy, and Game Stores Legal Services Periodical Publishers Book Stores Accounting, Tax Preparation, Bookkeeping Radio Stations Department Stores Architectural, Engineering Services Television Broadcasting Discount Department Stores Specialized Design Services Cable and Other Subscription Warehouse Clubs and Supercenters Computer Systems Design and Related Programming All Other General Merchandise Stores Management, Scientific, and Technical Full-Service Restaurants Office Supplies and Stationery Stores Scientific Research and Development QSR/Fast Foods Gift, Novelty, and Souvenir Stores Advertising, Public Relations Services Special Food Services Wired Telecommunications Carriers Other Professional, Scientific Technical Bars Wireless Telecommunications Carriers Temporary Help Services Supermarkets and Other Grocery Other Telecommunications Janitorial Services Convenience Stores Beer and Wine, and Liquor Stores Furniture Stores 13 Proprietary and Confidential. Copyright © 2011 BIA/Kelsey. All Rights Reserved.
  • 15.
    Charlotte, NC TotalMedia Overview 14 Proprietary and Confidential. Copyright © 2011 BIA/Kelsey. All Rights Reserved.
  • 16.
    Charlotte, NC AutomotiveCategory 15 Proprietary and Confidential. Copyright © 2011 BIA/Kelsey. All Rights Reserved.
  • 17.
    Charlotte, NC RetailCategory 16 Proprietary and Confidential. Copyright © 2011 BIA/Kelsey. All Rights Reserved.
  • 18.
    Charlotte, NC RetailCategory Furniture Stores Children's and Infants' Clothing Office Supplies Home Furnishings Stores Family Clothing Stores Gift/Souvenir Floor Covering Stores Clothing Accessories Stores Other Home Furnishings Other Clothing Stores Household Appliance Stores Shoe Stores Radio/Television/ Electronics Jewelry,/Luggage/Leather Computer /Software Stores Sporting Goods Stores Home Centers Hobby, Toy, and Game Stores Paint and Wallpaper Stores Book Stores Hardware Stores Department Stores (except Discount Department) Lawn/Garden/Supplies Stores Discount Department Stores Men's Clothing Stores Warehouse Clubs and Supercenters Women's Clothing Stores All Other General Merchandise Stores 17 Proprietary and Confidential. Copyright © 2011 BIA/Kelsey. All Rights Reserved.
  • 19.
    Interactive Report Building •Media Ad View: Detailed Category Reports include an Interactive Excel™ file in which a subcategory can be selected to generate a series of pie charts and tables that examine that category in a local market. • Data charts include: – Ad spending share by media for the current year and for each year five years out. – Estimated Annual Advertising Revenues – Share of Total Annual Advertising Revenues by Media – Annual Growth in Advertising Revenues by Media • Let’s look at some of the data. 18 Proprietary and Confidential. Copyright © 2011 BIA/Kelsey. All Rights Reserved.
  • 20.
    19 Proprietary and Confidential.Copyright © 2011 BIA/Kelsey. All Rights Reserved.
  • 21.
    Detailed Category: Health– Physicians 2010 20 Proprietary and Confidential. Copyright © 2011 BIA/Kelsey. All Rights Reserved.
  • 22.
    Detailed Category: Health– Physicians 2015 21 Proprietary and Confidential. Copyright © 2011 BIA/Kelsey. All Rights Reserved.
  • 23.
    Detailed Category: AutoDealers & Mnftrs 2010 22 Proprietary and Confidential. Copyright © 2011 BIA/Kelsey. All Rights Reserved.
  • 24.
    Detailed Category: AutoDealers & Mnftrs 2015 23 Proprietary and Confidential. Copyright © 2011 BIA/Kelsey. All Rights Reserved.
  • 25.
    How Clients UseMAV Reports • What our clients have told us: – Identify ALL the competition in the market – not just the ones in your specific media – Zero in on the revenue drivers in your particular market • Track where there’s major spending in a category right now • Track where local ad dollars are shifting • Plan and budget for these changes – Prepare effective media plans for different Ad prospects • Determine platform strategies based on future growth and metrics for different ad categories • Determine the potential budgets of prospects to prepare a “winnable” sales strategy – Create professional, effective sales collateral – Train sales teams as multi-platform Ad consultants 24 Proprietary and Confidential. Copyright © 2011 BIA/Kelsey. All Rights Reserved.
  • 26.
    Brief Recap ofMethodology • BIA/Kelsey has been tracking media for over 27 years • We have a “bottom up” and “top down” approach – Significant feedback from major players in all of these local media industries – Local demographic and economic data to allocate across markets • Utilize national and local information revenue and economic/demographic to estimate across general and detailed categories • Clients have told us that our estimates are the most reliable in the business. We take great pride in maintaining this position. 25 Proprietary and Confidential. Copyright © 2011 BIA/Kelsey. All Rights Reserved.
  • 27.
    Special Purchase Offer •Current List price: – $2,495/market • Webinar promo: – $1,995/market. – Want multiple markets? Bundle offer available. – Must be purchased by Nov. 30, 2011 – Visit: www.biakelsey.com/MAV for report details. – To purchase, email: sales@biakelsey.com or call: (703) 818-2425 26 Proprietary and Confidential. Copyright © 2011 BIA/Kelsey. All Rights Reserved.
  • 28.
    Frequently Asked Questions 27 Proprietary and Confidential. Copyright © 2011 BIA/Kelsey. All Rights Reserved.
  • 29.
    How are thevarious media estimates generated especially in the smallest markets? Answer: • Both bottom up and top down approaches - depending upon the specific media • Local economic and demographic data are taken into account when allocating the national estimates for specific markets • Projections on the growth of population, retail sales, and aggregate disposable income • Other local factors (e.g., relative health of local economy, other events affecting local economy, etc.) 28 Proprietary and Confidential. Copyright © 2011 BIA/Kelsey. All Rights Reserved.
  • 30.
    What does theTotal Local Television Market Revenue Estimate include? Answer: • All over-the-air advertising revenues generated from both national and local advertisers including political advertising revenues • All online revenues generated by local television stations • Does not include: • Any network advertising • Retransmission consent revenues • Trade and barter • Production revenues 29 Proprietary and Confidential. Copyright © 2011 BIA/Kelsey. All Rights Reserved.
  • 31.
    Can we getmore details on the online advertising components (e.g., how much is search, display)? Answer: • Media Ad View is a product that we are constantly updating and refining. • Currently, we are in the process of developing those estimates based upon local information obtainable on search activity within each and every market. • Considerable amount of data is being collected to generate those market specific estimates. • If you purchase a report now, this update will be provided to you as soon as it is available. 30 Proprietary and Confidential. Copyright © 2011 BIA/Kelsey. All Rights Reserved.
  • 32.
    Special Purchase Offer •Current List price: – $2,495/market • Webinar promo: – $1,995/market. – Want multiple markets? Bundle offer available. – Must be purchased by Nov. 30, 2011 – Visit: www.biakelsey.com/MAV for report details. – To purchase, email: sales@biakelsey.com or call: (703) 818-2425 31 Proprietary and Confidential. Copyright © 2011 BIA/Kelsey. All Rights Reserved.
  • 33.
    Questions and comments: MarkFratrik | mfratrik@biakelsey.com | 703.818.2425 Steve Passwaiter | spasswaiter@biakelsey.com | 703.818.2425 Omar Wardak | owardak@biaklesy.com | 703.818.2425 Copyright © 2011 BIA/Kelsey. All Rights Reserved. This published material is for internal client use only. It may not be duplicated or distributed in any manner not permitted by contract. Any unauthorized distribution could result in termination of the client relationship, fines and other civil or criminal penalties under federal law. BIA/Kelsey disclaims all warranties regarding the accuracy of the information herein and similarly disclaims any liability for direct, indirect or consequential damages that may result from the use or interpretation of this information.