SlideShare a Scribd company logo
1 of 14
Download to read offline
Q3 2006 Earnings
 Conference Call
A Note From Our Lawyers
     The following presentation includes forward-looking statements within the meaning of Section
     27A of the Securities Act of 1933 and Section 21E of the Securities Exchange Act of 1934.
     These forward-looking statements include statements regarding, among other things, our
     planned acquisition of YouTube, the planned combined offerings from Google and YouTube,
     the expected closing date of our planned acquisition of YouTube, and planned partnerships.
     These forward-looking statements are subject to certain risks and uncertainties that could
     cause our actual results to differ materially from those reflected in the forward-looking
     statements. Many of the factors that could cause or contribute to such differences include: (1)
     changes in economic, business, competitive, technological and/or regulatory factors, (2) failure
     to receive regulatory approval for the acquisition and the failure of the other conditions set
     forth in the YouTube acquisition agreement to be satisfied, (3) failure to retain the levels of
     traffic on the YouTube site, (4) failure to compete successfully in a highly competitive and
     rapidly changing marketplace, (5) failure to retain key employees of YouTube, (6) other factors
     affecting the operation of the respective businesses of Google and YouTube, and (7) the
     failure of YouTube and Google to work together effectively. More detailed information about
     these factors may be found in our filings with the SEC, including our most recent Quarterly
     Report on Form 10-Q.
     In light of these risks and uncertainties, the forward-looking statements included in this
     presentation may not occur, and actual results could differ materially and adversely from those
     anticipated or implied in the forward-looking statements. We undertake no obligation to revise
     or publicly release the results of any revision to these forward-looking statements.


2
Third Quarter 2006 Highlights

    • Revenue growth of 70% Y/Y and 10% Q/Q in seasonally slow Q3
      – Monetization was the primary driver of revenue growth; traffic gains also
         contributed meaningfully
      – Strong growth across our diverse advertiser base
      – Continued international expansion
    • Record levels of operating income and net income
    • Continued innovation – more simple yet powerful products for users
    • Multi-year partnerships with Fox Interactive Media (MySpace), eBay,
     and Intuit
    • Agreement to acquire YouTube for $1.65B in stock (October)

3
Quarterly Revenue
                      $3,000
                                Q3’06 Y/Y Growth = 70%
                                                                                         $2,690
                                Q3’06 Q/Q Growth = 10%

                                                                                $2,456
                      $2,500
                                                                   $2,254
      $ in millions


                                                                                         $1,037
                                                         $1,919
                      $2,000
                                                                                 $997
                                                                   $928
                                           $1,578
                                                         $799
                      $1,500   $1,384

                                           $675
                                $630
                      $1,000
                                                                                         $1,626
                                                                                $1,432
                                                                   $1,297
                                                         $1,098
                       $500
                                           $885
                                $737


                         $0
                                Q2'05       Q3'05         Q4'05     Q1'06        Q2'06    Q3'06

                                        Google.com       Network   Licensing and Other


4
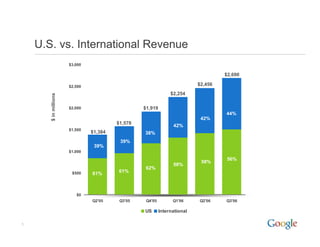
U.S. vs. International Revenue
                       $3,000

                                                                                    $2,690
                                                                           $2,456
                       $2,500
                                                                $2,254
       $ in millions


                                                  $1,919
                       $2,000
                                                                                    44%
                                                                            42%
                                         $1,578
                                                                 42%
                       $1,500
                                $1,384            38%
                                          39%
                                 39%
                       $1,000
                                                                                     56%
                                                                            58%
                                                                 58%
                                                   62%
                                         61%
                        $500    61%


                          $0
                                Q2'05     Q3'05    Q4'05         Q1'06     Q2'06    Q3'06

                                                  US       International

5
Traffic Acquisition Costs

                      $900                                                                   40%
                                                                                     $825
                                                                            $785
                             35.7%
                      $800
                                                             $723
                                     33.6%                                                   35%
                                                   32.8%
                                                              32.1%          32.0%
                      $700
                                                                                     30.7%
                                               $629
                      $600                                                                   30%
      $ in millions


                                     $530
                             $494
                      $500
                                                                                             25%
                      $400

                      $300                                                                   20%

                      $200
                                                                                             15%
                      $100

                       $0                                                                    10%
                             Q2'05   Q3'05         Q4'05     Q1'06          Q2'06    Q3'06

                                             TAC           TAC as % of Revenue


6
Costs and Expenses
      GAAP                                                                                       Q3'06
      $Millions                                                                            Q/Q           Y/Y
                                             Q3'05          Q2'06          Q3'06
      Costs of Revenues                          $655.1        $989.0       $1,048.7           6.0%       60.1%
        Percent of revenues                        41.5%         40.3%          39.0%
      Research & Development*                    $177.8         $282.6         $312.6         10.6%       75.8%
        Percent of revenues                        11.3%         11.5%          11.6%
      Sales & Marketing                          $111.5         $196.4         $207.0          5.4%       85.7%
        Percent of revenues                         7.1%          8.0%           7.7%
      General & Administrative                   $104.9         $172.6         $190.0         10.1%       81.1%
        Percent of revenues                         6.6%          7.0%           7.1%
      Total Costs & Expenses                   $1,049.3       $1,640.6       $1,758.3          7.2%       67.6%
        Percent of revenues                        66.5%         66.8%          65.4%


      Non-GAAP                                                                                   Q3'06
      $Millions                                                                            Q/Q           Y/Y
                                             Q3'05          Q2'06          Q3'06
      Costs of Revenues                          $653.8         $986.7       $1,046.6          6.1%       60.1%
        Percent of revenues                        41.4%         40.2%          38.9%
      Research & Development                     $130.9         $212.0         $250.9         18.3%       91.7%
        Percent of revenues                         8.3%          8.6%           9.3%
      Sales & Marketing                          $105.0         $182.1         $192.3          5.6%       83.1%
        Percent of revenues                         6.7%          7.4%           7.1%
      General & Administrative                     $92.5        $150.6         $168.7         12.0%       82.4%
        Percent of revenues                         5.9%          6.1%           6.3%
      Total Costs & Expenses                     $982.2       $1,531.4       $1,658.5          8.3%       68.9%
        Percent of revenues                        62.3%         62.3%          61.6%

       * Q305 includes $20.8M of in-process R&D
       Note: Please refer to supporting Table 1 for reconciliations of non-GAAP costs and expenses
       to GAAP costs and expenses
7
Profitability
           GAAP
           $Millions                                       Q3'05            Q2'06            Q3'06
           Income from Operations                         $529.2           $815.4           $931.3
           Operating Margin                                33.5%            33.2%            34.6%
           Net Income                                     $381.2           $721.1           $733.4
           Net Margin                                      24.1%            29.4%            27.3%
           EPS (diluted)                                    $1.32            $2.33            $2.36

           Non-GAAP
           $Millions                                       Q3'05            Q2'06            Q3'06
           Income from Operations                         $596.3           $924.5        $1,031.2
           Operating Margin                                37.8%            37.6%            38.3%
           Net Income                                     $437.2           $772.1           $812.3
           Net Margin                                      27.7%            31.4%            30.2%
           EPS (diluted)                                    $1.51            $2.49            $2.62
            Note: Please refer to supporting Table 2 for reconciliations of non-GAAP results of
            operations measures to the nearest comparable GAAP measures
8
Free Cash Flow


                                                                       Q3'06
     $Millions                                                   Q/Q           Y/Y
                                  Q3'05     Q2'06     Q3'06
     Net cash provided by
     operating activities          $646.7    $840.6   $1,004.3    19.5%        55.3%

     Less purchases of property
     and equipment                 $292.5    $699.0    $492.2    (29.6)%       68.3%


     Free cash flow (Non-GAAP)     $354.2    $141.6    $512.1    261.7%        44.6%


9
YouTube Agreement

     • YouTube is one of the largest and fastest growing online video
      entertainment communities on the Internet
     • Google and YouTube share the vision of enabling anyone to
      upload, watch and share original videos worldwide, and the
      dedication to innovate with video to offer compelling services
      for our users and for content owners
     • YouTube to remain independent following close
          Company to remain in San Bruno, CA
          Transaction expected to close in Q4


10
Summary

     • Strong results are a direct result of Google’s diversity across
       geographic regions, industry verticals, and advertiser/partner
       segments (small, medium, large).
     • Google continues to focus on innovation and on the user experience.
     • We continue to invest in our technology, infrastructure and people to
       maintain our market leadership and improve our competitive
       positioning.
     • Partnerships remain a key strategic initiative – Fox Interactive, eBay,
       Intuit – more to come.


11
Table 1 - Reconciliations of non-GAAP costs and expenses
     to GAAP costs and expenses

                                                                       As a % of                  As a % of                   As a % of     Q3'06     Q3'06
                                                                      Revenues (1)               Revenues (1)                Revenues (1)    Q/Q       Y/Y
     $Millions                                             Q3'05                      Q2'06                      Q3'06
                                                                                                                                               6.0%     60.1%
     Cost of Revenues (GAAP)                           $     655.1          41.5% $     989.0          40.3% $ 1,048.7             39.0%
     Less: Stock-based compensation                           (1.3)           -          (2.3)           -        (2.1)              -
                                                                                                                                               6.1%     60.1%
     Cost of Revenues (non-GAAP)                       $     653.8          41.4% $     986.7          40.2% $ 1,046.6             38.9%

     Research and development (GAAP)                                                                                                          10.6%     75.8%
                                                       $     177.8          11.3% $     282.6          11.5% $      312.6          11.6%
     Less: Stock-based compensation                          (26.1)           -         (70.6)           -          (61.7)           -          -         -
     Less: In-process research and development (2)           (20.8)           -           -              -            -              -          -         -
     Research and development (non-GAAP)                                                                                                      18.3%     91.7%
                                                       $     130.9           8.3% $     212.0           8.6% $      250.9           9.3%

     Sales and marketing (GAAP)                       $      111.5           7.1% $     196.4           8.0% $      207.0           7.7%       5.4%     85.7%
     Less: Stock-based compensation                           (6.5)           -         (14.3)           -          (14.7)           -          -         -
     Sales and marketing (non-GAAP)                   $      105.0           6.7% $     182.1           7.4% $      192.3           7.1%       5.6%     83.1%

     General and administrative (GAAP)                $      104.9           6.6% $     172.6           7.0% $      190.0           7.1%      10.1%     81.1%
     Less: Stock-based compensation                          (12.4)           -         (22.0)           -          (21.3)           -          -         -
     General and administrative (non-GAAP)            $       92.5           5.9% $     150.6           6.1% $      168.7           6.3%      12.0%     82.4%

     Total costs and expenses (GAAP)                  $ 1,049.3             66.5% $ 1,640.6            66.8% $ 1,758.3             65.4%       7.2%     67.6%
     Less: Stock-based compensation                       (46.3)              -      (109.2)             -       (99.8)              -          -         -
     Less: In-process research and development (2)        (20.8)              -         -                -         -                 -          -         -
     Total costs and expenses (non-GAAP)               $     982.2          62.3% $ 1,531.4            62.3% $ 1,658.5             61.6%       8.3%     68.9%

     (1) Percentages based on GAAP Revenues of $1,578 million in Q3 '05, $2,456 million in Q2 '06 and $2,690 million in Q3 '06
     (2) In-process research and development relates to an acquisition


12
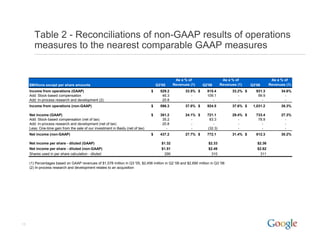
Table 2 - Reconciliations of non-GAAP results of operations
        measures to the nearest comparable GAAP measures


                                                                                                 As a % of                   As a % of                  As a % of
                                                                                                Revenues (1)                Revenues (1)               Revenues (1)
     $Millions except per share amounts                                              Q3'05                      Q2'06                       Q3'06
     Income from operations (GAAP)                                               $     529.2          33.5% $      815.4          33.2% $     931.3          34.6%
     Add: Stock-based compensation                                                      46.3             -         109.1             -         99.9            -
     Add: In-process research and development (2)                                       20.8             -            -              -           -             -
     Income from operations (non-GAAP)                                           $     596.3          37.8% $      924.5          37.6% $    1,031.2         38.3%

     Net income (GAAP)                                                           $     381.2          24.1% $      721.1          29.4% $     733.4          27.3%
     Add: Stock-based compensation (net of tax)                                         35.2             -          83.3             -         78.9            -
     Add: In-process research and development (net of tax)                              20.8             -            -              -           -             -
     Less: One-time gain from the sale of our investment in Baidu (net of tax)            -              -         (32.3)            -           -             -
     Net income (non-GAAP)                                                       $     437.2          27.7% $      772.1          31.4% $     812.3          30.2%

     Net income per share - diluted (GAAP)                                              $1.32                       $2.33                      $2.36
     Net income per share - diluted (non-GAAP)                                          $1.51                       $2.49                      $2.62
     Shares used in per share calculation - diluted                                       290                         310                        311

     (1) Percentages based on GAAP revenues of $1,578 million in Q3 '05, $2,456 million in Q2 '06 and $2,690 million in Q3 '06
     (2) In-process research and development relates to an acquisition


13
Q3 2006 Earnings
 Conference Call

More Related Content

What's hot

2008 Q4 Google Earnings Slides
2008 Q4 Google Earnings Slides2008 Q4 Google Earnings Slides
2008 Q4 Google Earnings Slidesguest3f8836
 
cmi_07/03/06
cmi_07/03/06cmi_07/03/06
cmi_07/03/06finance21
 
Target Annual Report 2004
Target Annual Report 2004Target Annual Report 2004
Target Annual Report 2004finance4
 
11224 Richland Ave Financial Summary
11224 Richland Ave   Financial Summary11224 Richland Ave   Financial Summary
11224 Richland Ave Financial Summarysrosenberg
 

What's hot (6)

GPI2002AR
GPI2002ARGPI2002AR
GPI2002AR
 
2008 Q4 Google Earnings Slides
2008 Q4 Google Earnings Slides2008 Q4 Google Earnings Slides
2008 Q4 Google Earnings Slides
 
cmi_07/03/06
cmi_07/03/06cmi_07/03/06
cmi_07/03/06
 
2007 Q4 Google Earnings Slides
2007 Q4 Google Earnings Slides2007 Q4 Google Earnings Slides
2007 Q4 Google Earnings Slides
 
Target Annual Report 2004
Target Annual Report 2004Target Annual Report 2004
Target Annual Report 2004
 
11224 Richland Ave Financial Summary
11224 Richland Ave   Financial Summary11224 Richland Ave   Financial Summary
11224 Richland Ave Financial Summary
 

Viewers also liked

citigroup April 18, 2008 - First Quarter Press Release
citigroup April 18, 2008 - First Quarter Press Releasecitigroup April 18, 2008 - First Quarter Press Release
citigroup April 18, 2008 - First Quarter Press ReleaseQuarterlyEarningsReports
 
citigroup July 14, 2003 - Second Quarter Financial Supplement
citigroup July 14, 2003 - Second Quarter Financial Supplementcitigroup July 14, 2003 - Second Quarter Financial Supplement
citigroup July 14, 2003 - Second Quarter Financial SupplementQuarterlyEarningsReports
 
citigroup April 16, 2007 - First Quarter Financial Supplement
citigroup April 16, 2007 - First Quarter Financial Supplementcitigroup April 16, 2007 - First Quarter Financial Supplement
citigroup April 16, 2007 - First Quarter Financial SupplementQuarterlyEarningsReports
 
citi group January 21, 2003 - Fourth Quarter Press Release
citi group January 21, 2003 - Fourth Quarter Press Releaseciti group January 21, 2003 - Fourth Quarter Press Release
citi group January 21, 2003 - Fourth Quarter Press ReleaseQuarterlyEarningsReports
 

Viewers also liked (17)

citigroup April 18, 2008 - First Quarter Press Release
citigroup April 18, 2008 - First Quarter Press Releasecitigroup April 18, 2008 - First Quarter Press Release
citigroup April 18, 2008 - First Quarter Press Release
 
Ebay News 2003 4 22 Earnings
Ebay News 2003 4 22 EarningsEbay News 2003 4 22 Earnings
Ebay News 2003 4 22 Earnings
 
citigroup July 14, 2003 - Second Quarter Financial Supplement
citigroup July 14, 2003 - Second Quarter Financial Supplementcitigroup July 14, 2003 - Second Quarter Financial Supplement
citigroup July 14, 2003 - Second Quarter Financial Supplement
 
Ebay News 1998 10 27 Earnings
Ebay News 1998 10 27 EarningsEbay News 1998 10 27 Earnings
Ebay News 1998 10 27 Earnings
 
Ebay News 2004 7 21 Earnings
Ebay News 2004 7 21 EarningsEbay News 2004 7 21 Earnings
Ebay News 2004 7 21 Earnings
 
Ebay News 2001 7 19 Earnings
Ebay News 2001 7 19 EarningsEbay News 2001 7 19 Earnings
Ebay News 2001 7 19 Earnings
 
2006 Annual Report
2006 Annual Report2006 Annual Report
2006 Annual Report
 
Ebay News 2003 7 24 Earnings
Ebay News 2003 7 24 EarningsEbay News 2003 7 24 Earnings
Ebay News 2003 7 24 Earnings
 
citigroup Presentation
citigroup Presentationcitigroup Presentation
citigroup Presentation
 
2005 Annual Report
2005 Annual Report2005 Annual Report
2005 Annual Report
 
citigroup Qer084s
citigroup Qer084scitigroup Qer084s
citigroup Qer084s
 
1999 Financial Section
1999 Financial Section1999 Financial Section
1999 Financial Section
 
citigroup January 15, 2008
citigroup January 15, 2008citigroup January 15, 2008
citigroup January 15, 2008
 
citigroup April 16, 2007 - First Quarter Financial Supplement
citigroup April 16, 2007 - First Quarter Financial Supplementcitigroup April 16, 2007 - First Quarter Financial Supplement
citigroup April 16, 2007 - First Quarter Financial Supplement
 
Ebay News 2002 4 18 Earnings
Ebay News 2002 4 18 EarningsEbay News 2002 4 18 Earnings
Ebay News 2002 4 18 Earnings
 
Ebay News 2002 7 18 Earnings
Ebay News 2002 7 18 EarningsEbay News 2002 7 18 Earnings
Ebay News 2002 7 18 Earnings
 
citi group January 21, 2003 - Fourth Quarter Press Release
citi group January 21, 2003 - Fourth Quarter Press Releaseciti group January 21, 2003 - Fourth Quarter Press Release
citi group January 21, 2003 - Fourth Quarter Press Release
 

Similar to 2006Q3 google earnings

2006 Q4 Google Earnings Slides
2006 Q4 Google Earnings Slides2006 Q4 Google Earnings Slides
2006 Q4 Google Earnings Slidesearningsreport
 
2006Q4_google_earnings_slides
2006Q4_google_earnings_slides2006Q4_google_earnings_slides
2006Q4_google_earnings_slidesfinance15
 
2007Q1_google_earnings_slides
2007Q1_google_earnings_slides2007Q1_google_earnings_slides
2007Q1_google_earnings_slidesfinance15
 
2007 Q1 Google Earnings Slides
2007 Q1 Google Earnings Slides2007 Q1 Google Earnings Slides
2007 Q1 Google Earnings Slidesearningsreport
 
2007Q2_google_earnings_slides
2007Q2_google_earnings_slides2007Q2_google_earnings_slides
2007Q2_google_earnings_slidesfinance15
 
2007 Q2 Google Earnings Slides
2007 Q2 Google Earnings Slides2007 Q2 Google Earnings Slides
2007 Q2 Google Earnings Slidesearningsreport
 
39348363 google-earnings-slides-q3-2010
39348363 google-earnings-slides-q3-201039348363 google-earnings-slides-q3-2010
39348363 google-earnings-slides-q3-2010Pranav Bhatnagar
 
2010 q3 google_earnings_slides
2010 q3 google_earnings_slides2010 q3 google_earnings_slides
2010 q3 google_earnings_slidesrabier
 
2012 q3 google_earnings_slides
2012 q3 google_earnings_slides2012 q3 google_earnings_slides
2012 q3 google_earnings_slidesGreg Sterling
 
Google Q4 2012 Quarterly Earnings Summary
Google Q4 2012 Quarterly Earnings SummaryGoogle Q4 2012 Quarterly Earnings Summary
Google Q4 2012 Quarterly Earnings SummaryKamaldeep Singh SEO
 
yahoo =2Q08_Earnings_Presentation
yahoo =2Q08_Earnings_Presentationyahoo =2Q08_Earnings_Presentation
yahoo =2Q08_Earnings_Presentationfinance32
 
2012 q2 google_earnings_slides
2012 q2 google_earnings_slides2012 q2 google_earnings_slides
2012 q2 google_earnings_slidesDrew Olanoff
 
2012 q1 google_earnings_slides
2012 q1 google_earnings_slides2012 q1 google_earnings_slides
2012 q1 google_earnings_slidestheextraaedge
 
goldman sachs Creditor Presentation
goldman sachs Creditor Presentationgoldman sachs Creditor Presentation
goldman sachs Creditor Presentationfinance2
 
Creditor Presentation
Creditor Presentation Creditor Presentation
Creditor Presentation finance2
 
2008Q1_google_earnings_slides
2008Q1_google_earnings_slides2008Q1_google_earnings_slides
2008Q1_google_earnings_slidesfinance15
 

Similar to 2006Q3 google earnings (20)

2006 Q3 Google Earnings Slides
2006 Q3 Google Earnings Slides2006 Q3 Google Earnings Slides
2006 Q3 Google Earnings Slides
 
2006 Q4 Google Earnings Slides
2006 Q4 Google Earnings Slides2006 Q4 Google Earnings Slides
2006 Q4 Google Earnings Slides
 
2006 Q4 Google Earnings Slides
2006 Q4 Google Earnings Slides2006 Q4 Google Earnings Slides
2006 Q4 Google Earnings Slides
 
2006Q4_google_earnings_slides
2006Q4_google_earnings_slides2006Q4_google_earnings_slides
2006Q4_google_earnings_slides
 
2007Q1_google_earnings_slides
2007Q1_google_earnings_slides2007Q1_google_earnings_slides
2007Q1_google_earnings_slides
 
2007 Q1 Google Earnings Slides
2007 Q1 Google Earnings Slides2007 Q1 Google Earnings Slides
2007 Q1 Google Earnings Slides
 
2007 Q1 Google Earnings Slides
2007 Q1 Google Earnings Slides2007 Q1 Google Earnings Slides
2007 Q1 Google Earnings Slides
 
2007Q2_google_earnings_slides
2007Q2_google_earnings_slides2007Q2_google_earnings_slides
2007Q2_google_earnings_slides
 
2007 Q2 Google Earnings Slides
2007 Q2 Google Earnings Slides2007 Q2 Google Earnings Slides
2007 Q2 Google Earnings Slides
 
Google Earnings Slides 2009 Q2
Google Earnings Slides 2009 Q2Google Earnings Slides 2009 Q2
Google Earnings Slides 2009 Q2
 
39348363 google-earnings-slides-q3-2010
39348363 google-earnings-slides-q3-201039348363 google-earnings-slides-q3-2010
39348363 google-earnings-slides-q3-2010
 
2010 q3 google_earnings_slides
2010 q3 google_earnings_slides2010 q3 google_earnings_slides
2010 q3 google_earnings_slides
 
2012 q3 google_earnings_slides
2012 q3 google_earnings_slides2012 q3 google_earnings_slides
2012 q3 google_earnings_slides
 
Google Q4 2012 Quarterly Earnings Summary
Google Q4 2012 Quarterly Earnings SummaryGoogle Q4 2012 Quarterly Earnings Summary
Google Q4 2012 Quarterly Earnings Summary
 
yahoo =2Q08_Earnings_Presentation
yahoo =2Q08_Earnings_Presentationyahoo =2Q08_Earnings_Presentation
yahoo =2Q08_Earnings_Presentation
 
2012 q2 google_earnings_slides
2012 q2 google_earnings_slides2012 q2 google_earnings_slides
2012 q2 google_earnings_slides
 
2012 q1 google_earnings_slides
2012 q1 google_earnings_slides2012 q1 google_earnings_slides
2012 q1 google_earnings_slides
 
goldman sachs Creditor Presentation
goldman sachs Creditor Presentationgoldman sachs Creditor Presentation
goldman sachs Creditor Presentation
 
Creditor Presentation
Creditor Presentation Creditor Presentation
Creditor Presentation
 
2008Q1_google_earnings_slides
2008Q1_google_earnings_slides2008Q1_google_earnings_slides
2008Q1_google_earnings_slides
 

More from QuarterlyEarningsReports

citigroup April 17, 2000 - First Quarter Financial Supplement
citigroup April 17, 2000 - First Quarter Financial Supplementcitigroup April 17, 2000 - First Quarter Financial Supplement
citigroup April 17, 2000 - First Quarter Financial SupplementQuarterlyEarningsReports
 
citigroup April 17, 2000 - First Quarter Press Release
citigroup April 17, 2000 - First Quarter Press Releasecitigroup April 17, 2000 - First Quarter Press Release
citigroup April 17, 2000 - First Quarter Press ReleaseQuarterlyEarningsReports
 
citigroup July 19, 2000 - Second Quarter Financial Supplement
citigroup July 19, 2000 - Second Quarter Financial Supplementcitigroup July 19, 2000 - Second Quarter Financial Supplement
citigroup July 19, 2000 - Second Quarter Financial SupplementQuarterlyEarningsReports
 
citigroup July 19, 2000 - Second Quarter Press Release
citigroup  July 19, 2000 - Second Quarter Press Releasecitigroup  July 19, 2000 - Second Quarter Press Release
citigroup July 19, 2000 - Second Quarter Press ReleaseQuarterlyEarningsReports
 
citigroup October 17, 2000 - Third Quarter Press Release
citigroup October 17, 2000 - Third Quarter Press Releasecitigroup October 17, 2000 - Third Quarter Press Release
citigroup October 17, 2000 - Third Quarter Press ReleaseQuarterlyEarningsReports
 
citigroup January 16, 2001 - Fourth Quarter Financial Supplement
citigroup January 16, 2001 - Fourth Quarter Financial Supplementcitigroup January 16, 2001 - Fourth Quarter Financial Supplement
citigroup January 16, 2001 - Fourth Quarter Financial SupplementQuarterlyEarningsReports
 
citigroup January 16, 2001 - Fourth Quarter Press Release
citigroup January 16, 2001 - Fourth Quarter Press Releasecitigroup January 16, 2001 - Fourth Quarter Press Release
citigroup January 16, 2001 - Fourth Quarter Press ReleaseQuarterlyEarningsReports
 
citigroup April 16, 2001 - First Quarter Financial Supplement
citigroup April 16, 2001 - First Quarter  Financial Supplementcitigroup April 16, 2001 - First Quarter  Financial Supplement
citigroup April 16, 2001 - First Quarter Financial SupplementQuarterlyEarningsReports
 
citigroup April 16, 2001 - First Quarter Press Release
citigroup April 16, 2001 - First Quarter Press Releasecitigroup April 16, 2001 - First Quarter Press Release
citigroup April 16, 2001 - First Quarter Press ReleaseQuarterlyEarningsReports
 
citi July 16, 2001 - Second Quarter Financial Supplement
citi July 16, 2001 - Second Quarter Financial Supplementciti July 16, 2001 - Second Quarter Financial Supplement
citi July 16, 2001 - Second Quarter Financial SupplementQuarterlyEarningsReports
 
citigroup July 16, 2001 - Second Quarter Press Release
citigroup July 16, 2001 - Second Quarter Press Releasecitigroup July 16, 2001 - Second Quarter Press Release
citigroup July 16, 2001 - Second Quarter Press ReleaseQuarterlyEarningsReports
 
citigroup October 17, 2001 - Third Quarter Financial Supplement
citigroup October 17, 2001 - Third Quarter  Financial Supplementcitigroup October 17, 2001 - Third Quarter  Financial Supplement
citigroup October 17, 2001 - Third Quarter Financial SupplementQuarterlyEarningsReports
 
citigroup October 17, 2001 - Third Quarter Press Release
citigroup October 17, 2001 - Third Quarter Press Releasecitigroup October 17, 2001 - Third Quarter Press Release
citigroup October 17, 2001 - Third Quarter Press ReleaseQuarterlyEarningsReports
 
citigroup January 17, 2002 - Fourth Quarter Financial Supplement
citigroup January 17, 2002 - Fourth Quarter  Financial Supplementcitigroup January 17, 2002 - Fourth Quarter  Financial Supplement
citigroup January 17, 2002 - Fourth Quarter Financial SupplementQuarterlyEarningsReports
 

More from QuarterlyEarningsReports (20)

citigroup April 17, 2000 - First Quarter Financial Supplement
citigroup April 17, 2000 - First Quarter Financial Supplementcitigroup April 17, 2000 - First Quarter Financial Supplement
citigroup April 17, 2000 - First Quarter Financial Supplement
 
citigroup April 17, 2000 - First Quarter Press Release
citigroup April 17, 2000 - First Quarter Press Releasecitigroup April 17, 2000 - First Quarter Press Release
citigroup April 17, 2000 - First Quarter Press Release
 
citigroup Financial Supplement
citigroup Financial Supplementcitigroup Financial Supplement
citigroup Financial Supplement
 
citigroup July 19, 2000 - Second Quarter Financial Supplement
citigroup July 19, 2000 - Second Quarter Financial Supplementcitigroup July 19, 2000 - Second Quarter Financial Supplement
citigroup July 19, 2000 - Second Quarter Financial Supplement
 
citigroup July 19, 2000 - Second Quarter Press Release
citigroup  July 19, 2000 - Second Quarter Press Releasecitigroup  July 19, 2000 - Second Quarter Press Release
citigroup July 19, 2000 - Second Quarter Press Release
 
citigroup Financial Supplement
citigroup Financial Supplementcitigroup Financial Supplement
citigroup Financial Supplement
 
citigroup Financial Supplement
citigroup Financial Supplementcitigroup Financial Supplement
citigroup Financial Supplement
 
citigroup October 17, 2000 - Third Quarter Press Release
citigroup October 17, 2000 - Third Quarter Press Releasecitigroup October 17, 2000 - Third Quarter Press Release
citigroup October 17, 2000 - Third Quarter Press Release
 
citigroup January 16, 2001 - Fourth Quarter Financial Supplement
citigroup January 16, 2001 - Fourth Quarter Financial Supplementcitigroup January 16, 2001 - Fourth Quarter Financial Supplement
citigroup January 16, 2001 - Fourth Quarter Financial Supplement
 
citigroup January 16, 2001 - Fourth Quarter Press Release
citigroup January 16, 2001 - Fourth Quarter Press Releasecitigroup January 16, 2001 - Fourth Quarter Press Release
citigroup January 16, 2001 - Fourth Quarter Press Release
 
citigroup Financial Supplement
citigroup Financial Supplementcitigroup Financial Supplement
citigroup Financial Supplement
 
citigroup April 16, 2001 - First Quarter Financial Supplement
citigroup April 16, 2001 - First Quarter  Financial Supplementcitigroup April 16, 2001 - First Quarter  Financial Supplement
citigroup April 16, 2001 - First Quarter Financial Supplement
 
citigroup April 16, 2001 - First Quarter Press Release
citigroup April 16, 2001 - First Quarter Press Releasecitigroup April 16, 2001 - First Quarter Press Release
citigroup April 16, 2001 - First Quarter Press Release
 
citigroup Financial Supplement
citigroup Financial Supplementcitigroup Financial Supplement
citigroup Financial Supplement
 
citi July 16, 2001 - Second Quarter Financial Supplement
citi July 16, 2001 - Second Quarter Financial Supplementciti July 16, 2001 - Second Quarter Financial Supplement
citi July 16, 2001 - Second Quarter Financial Supplement
 
citigroup July 16, 2001 - Second Quarter Press Release
citigroup July 16, 2001 - Second Quarter Press Releasecitigroup July 16, 2001 - Second Quarter Press Release
citigroup July 16, 2001 - Second Quarter Press Release
 
citigroupFinancial Supplement
citigroupFinancial SupplementcitigroupFinancial Supplement
citigroupFinancial Supplement
 
citigroup October 17, 2001 - Third Quarter Financial Supplement
citigroup October 17, 2001 - Third Quarter  Financial Supplementcitigroup October 17, 2001 - Third Quarter  Financial Supplement
citigroup October 17, 2001 - Third Quarter Financial Supplement
 
citigroup October 17, 2001 - Third Quarter Press Release
citigroup October 17, 2001 - Third Quarter Press Releasecitigroup October 17, 2001 - Third Quarter Press Release
citigroup October 17, 2001 - Third Quarter Press Release
 
citigroup January 17, 2002 - Fourth Quarter Financial Supplement
citigroup January 17, 2002 - Fourth Quarter  Financial Supplementcitigroup January 17, 2002 - Fourth Quarter  Financial Supplement
citigroup January 17, 2002 - Fourth Quarter Financial Supplement
 

Recently uploaded

AI as an Interface for Commercial Buildings
AI as an Interface for Commercial BuildingsAI as an Interface for Commercial Buildings
AI as an Interface for Commercial BuildingsMemoori
 
Understanding the Laravel MVC Architecture
Understanding the Laravel MVC ArchitectureUnderstanding the Laravel MVC Architecture
Understanding the Laravel MVC ArchitecturePixlogix Infotech
 
Benefits Of Flutter Compared To Other Frameworks
Benefits Of Flutter Compared To Other FrameworksBenefits Of Flutter Compared To Other Frameworks
Benefits Of Flutter Compared To Other FrameworksSoftradix Technologies
 
Science&tech:THE INFORMATION AGE STS.pdf
Science&tech:THE INFORMATION AGE STS.pdfScience&tech:THE INFORMATION AGE STS.pdf
Science&tech:THE INFORMATION AGE STS.pdfjimielynbastida
 
Key Features Of Token Development (1).pptx
Key  Features Of Token  Development (1).pptxKey  Features Of Token  Development (1).pptx
Key Features Of Token Development (1).pptxLBM Solutions
 
Streamlining Python Development: A Guide to a Modern Project Setup
Streamlining Python Development: A Guide to a Modern Project SetupStreamlining Python Development: A Guide to a Modern Project Setup
Streamlining Python Development: A Guide to a Modern Project SetupFlorian Wilhelm
 
Dev Dives: Streamline document processing with UiPath Studio Web
Dev Dives: Streamline document processing with UiPath Studio WebDev Dives: Streamline document processing with UiPath Studio Web
Dev Dives: Streamline document processing with UiPath Studio WebUiPathCommunity
 
Automating Business Process via MuleSoft Composer | Bangalore MuleSoft Meetup...
Automating Business Process via MuleSoft Composer | Bangalore MuleSoft Meetup...Automating Business Process via MuleSoft Composer | Bangalore MuleSoft Meetup...
Automating Business Process via MuleSoft Composer | Bangalore MuleSoft Meetup...shyamraj55
 
Connect Wave/ connectwave Pitch Deck Presentation
Connect Wave/ connectwave Pitch Deck PresentationConnect Wave/ connectwave Pitch Deck Presentation
Connect Wave/ connectwave Pitch Deck PresentationSlibray Presentation
 
Advanced Test Driven-Development @ php[tek] 2024
Advanced Test Driven-Development @ php[tek] 2024Advanced Test Driven-Development @ php[tek] 2024
Advanced Test Driven-Development @ php[tek] 2024Scott Keck-Warren
 
"LLMs for Python Engineers: Advanced Data Analysis and Semantic Kernel",Oleks...
"LLMs for Python Engineers: Advanced Data Analysis and Semantic Kernel",Oleks..."LLMs for Python Engineers: Advanced Data Analysis and Semantic Kernel",Oleks...
"LLMs for Python Engineers: Advanced Data Analysis and Semantic Kernel",Oleks...Fwdays
 
Artificial intelligence in the post-deep learning era
Artificial intelligence in the post-deep learning eraArtificial intelligence in the post-deep learning era
Artificial intelligence in the post-deep learning eraDeakin University
 
Tech-Forward - Achieving Business Readiness For Copilot in Microsoft 365
Tech-Forward - Achieving Business Readiness For Copilot in Microsoft 365Tech-Forward - Achieving Business Readiness For Copilot in Microsoft 365
Tech-Forward - Achieving Business Readiness For Copilot in Microsoft 3652toLead Limited
 
My INSURER PTE LTD - Insurtech Innovation Award 2024
My INSURER PTE LTD - Insurtech Innovation Award 2024My INSURER PTE LTD - Insurtech Innovation Award 2024
My INSURER PTE LTD - Insurtech Innovation Award 2024The Digital Insurer
 
"Federated learning: out of reach no matter how close",Oleksandr Lapshyn
"Federated learning: out of reach no matter how close",Oleksandr Lapshyn"Federated learning: out of reach no matter how close",Oleksandr Lapshyn
"Federated learning: out of reach no matter how close",Oleksandr LapshynFwdays
 
Vertex AI Gemini Prompt Engineering Tips
Vertex AI Gemini Prompt Engineering TipsVertex AI Gemini Prompt Engineering Tips
Vertex AI Gemini Prompt Engineering TipsMiki Katsuragi
 
APIForce Zurich 5 April Automation LPDG
APIForce Zurich 5 April  Automation LPDGAPIForce Zurich 5 April  Automation LPDG
APIForce Zurich 5 April Automation LPDGMarianaLemus7
 
Pigging Solutions Piggable Sweeping Elbows
Pigging Solutions Piggable Sweeping ElbowsPigging Solutions Piggable Sweeping Elbows
Pigging Solutions Piggable Sweeping ElbowsPigging Solutions
 

Recently uploaded (20)

AI as an Interface for Commercial Buildings
AI as an Interface for Commercial BuildingsAI as an Interface for Commercial Buildings
AI as an Interface for Commercial Buildings
 
Understanding the Laravel MVC Architecture
Understanding the Laravel MVC ArchitectureUnderstanding the Laravel MVC Architecture
Understanding the Laravel MVC Architecture
 
Benefits Of Flutter Compared To Other Frameworks
Benefits Of Flutter Compared To Other FrameworksBenefits Of Flutter Compared To Other Frameworks
Benefits Of Flutter Compared To Other Frameworks
 
Science&tech:THE INFORMATION AGE STS.pdf
Science&tech:THE INFORMATION AGE STS.pdfScience&tech:THE INFORMATION AGE STS.pdf
Science&tech:THE INFORMATION AGE STS.pdf
 
Key Features Of Token Development (1).pptx
Key  Features Of Token  Development (1).pptxKey  Features Of Token  Development (1).pptx
Key Features Of Token Development (1).pptx
 
Streamlining Python Development: A Guide to a Modern Project Setup
Streamlining Python Development: A Guide to a Modern Project SetupStreamlining Python Development: A Guide to a Modern Project Setup
Streamlining Python Development: A Guide to a Modern Project Setup
 
Dev Dives: Streamline document processing with UiPath Studio Web
Dev Dives: Streamline document processing with UiPath Studio WebDev Dives: Streamline document processing with UiPath Studio Web
Dev Dives: Streamline document processing with UiPath Studio Web
 
Automating Business Process via MuleSoft Composer | Bangalore MuleSoft Meetup...
Automating Business Process via MuleSoft Composer | Bangalore MuleSoft Meetup...Automating Business Process via MuleSoft Composer | Bangalore MuleSoft Meetup...
Automating Business Process via MuleSoft Composer | Bangalore MuleSoft Meetup...
 
Connect Wave/ connectwave Pitch Deck Presentation
Connect Wave/ connectwave Pitch Deck PresentationConnect Wave/ connectwave Pitch Deck Presentation
Connect Wave/ connectwave Pitch Deck Presentation
 
Advanced Test Driven-Development @ php[tek] 2024
Advanced Test Driven-Development @ php[tek] 2024Advanced Test Driven-Development @ php[tek] 2024
Advanced Test Driven-Development @ php[tek] 2024
 
E-Vehicle_Hacking_by_Parul Sharma_null_owasp.pptx
E-Vehicle_Hacking_by_Parul Sharma_null_owasp.pptxE-Vehicle_Hacking_by_Parul Sharma_null_owasp.pptx
E-Vehicle_Hacking_by_Parul Sharma_null_owasp.pptx
 
Hot Sexy call girls in Panjabi Bagh 🔝 9953056974 🔝 Delhi escort Service
Hot Sexy call girls in Panjabi Bagh 🔝 9953056974 🔝 Delhi escort ServiceHot Sexy call girls in Panjabi Bagh 🔝 9953056974 🔝 Delhi escort Service
Hot Sexy call girls in Panjabi Bagh 🔝 9953056974 🔝 Delhi escort Service
 
"LLMs for Python Engineers: Advanced Data Analysis and Semantic Kernel",Oleks...
"LLMs for Python Engineers: Advanced Data Analysis and Semantic Kernel",Oleks..."LLMs for Python Engineers: Advanced Data Analysis and Semantic Kernel",Oleks...
"LLMs for Python Engineers: Advanced Data Analysis and Semantic Kernel",Oleks...
 
Artificial intelligence in the post-deep learning era
Artificial intelligence in the post-deep learning eraArtificial intelligence in the post-deep learning era
Artificial intelligence in the post-deep learning era
 
Tech-Forward - Achieving Business Readiness For Copilot in Microsoft 365
Tech-Forward - Achieving Business Readiness For Copilot in Microsoft 365Tech-Forward - Achieving Business Readiness For Copilot in Microsoft 365
Tech-Forward - Achieving Business Readiness For Copilot in Microsoft 365
 
My INSURER PTE LTD - Insurtech Innovation Award 2024
My INSURER PTE LTD - Insurtech Innovation Award 2024My INSURER PTE LTD - Insurtech Innovation Award 2024
My INSURER PTE LTD - Insurtech Innovation Award 2024
 
"Federated learning: out of reach no matter how close",Oleksandr Lapshyn
"Federated learning: out of reach no matter how close",Oleksandr Lapshyn"Federated learning: out of reach no matter how close",Oleksandr Lapshyn
"Federated learning: out of reach no matter how close",Oleksandr Lapshyn
 
Vertex AI Gemini Prompt Engineering Tips
Vertex AI Gemini Prompt Engineering TipsVertex AI Gemini Prompt Engineering Tips
Vertex AI Gemini Prompt Engineering Tips
 
APIForce Zurich 5 April Automation LPDG
APIForce Zurich 5 April  Automation LPDGAPIForce Zurich 5 April  Automation LPDG
APIForce Zurich 5 April Automation LPDG
 
Pigging Solutions Piggable Sweeping Elbows
Pigging Solutions Piggable Sweeping ElbowsPigging Solutions Piggable Sweeping Elbows
Pigging Solutions Piggable Sweeping Elbows
 

2006Q3 google earnings

  • 1. Q3 2006 Earnings Conference Call
  • 2. A Note From Our Lawyers The following presentation includes forward-looking statements within the meaning of Section 27A of the Securities Act of 1933 and Section 21E of the Securities Exchange Act of 1934. These forward-looking statements include statements regarding, among other things, our planned acquisition of YouTube, the planned combined offerings from Google and YouTube, the expected closing date of our planned acquisition of YouTube, and planned partnerships. These forward-looking statements are subject to certain risks and uncertainties that could cause our actual results to differ materially from those reflected in the forward-looking statements. Many of the factors that could cause or contribute to such differences include: (1) changes in economic, business, competitive, technological and/or regulatory factors, (2) failure to receive regulatory approval for the acquisition and the failure of the other conditions set forth in the YouTube acquisition agreement to be satisfied, (3) failure to retain the levels of traffic on the YouTube site, (4) failure to compete successfully in a highly competitive and rapidly changing marketplace, (5) failure to retain key employees of YouTube, (6) other factors affecting the operation of the respective businesses of Google and YouTube, and (7) the failure of YouTube and Google to work together effectively. More detailed information about these factors may be found in our filings with the SEC, including our most recent Quarterly Report on Form 10-Q. In light of these risks and uncertainties, the forward-looking statements included in this presentation may not occur, and actual results could differ materially and adversely from those anticipated or implied in the forward-looking statements. We undertake no obligation to revise or publicly release the results of any revision to these forward-looking statements. 2
  • 3. Third Quarter 2006 Highlights • Revenue growth of 70% Y/Y and 10% Q/Q in seasonally slow Q3 – Monetization was the primary driver of revenue growth; traffic gains also contributed meaningfully – Strong growth across our diverse advertiser base – Continued international expansion • Record levels of operating income and net income • Continued innovation – more simple yet powerful products for users • Multi-year partnerships with Fox Interactive Media (MySpace), eBay, and Intuit • Agreement to acquire YouTube for $1.65B in stock (October) 3
  • 4. Quarterly Revenue $3,000 Q3’06 Y/Y Growth = 70% $2,690 Q3’06 Q/Q Growth = 10% $2,456 $2,500 $2,254 $ in millions $1,037 $1,919 $2,000 $997 $928 $1,578 $799 $1,500 $1,384 $675 $630 $1,000 $1,626 $1,432 $1,297 $1,098 $500 $885 $737 $0 Q2'05 Q3'05 Q4'05 Q1'06 Q2'06 Q3'06 Google.com Network Licensing and Other 4
  • 5. U.S. vs. International Revenue $3,000 $2,690 $2,456 $2,500 $2,254 $ in millions $1,919 $2,000 44% 42% $1,578 42% $1,500 $1,384 38% 39% 39% $1,000 56% 58% 58% 62% 61% $500 61% $0 Q2'05 Q3'05 Q4'05 Q1'06 Q2'06 Q3'06 US International 5
  • 6. Traffic Acquisition Costs $900 40% $825 $785 35.7% $800 $723 33.6% 35% 32.8% 32.1% 32.0% $700 30.7% $629 $600 30% $ in millions $530 $494 $500 25% $400 $300 20% $200 15% $100 $0 10% Q2'05 Q3'05 Q4'05 Q1'06 Q2'06 Q3'06 TAC TAC as % of Revenue 6
  • 7. Costs and Expenses GAAP Q3'06 $Millions Q/Q Y/Y Q3'05 Q2'06 Q3'06 Costs of Revenues $655.1 $989.0 $1,048.7 6.0% 60.1% Percent of revenues 41.5% 40.3% 39.0% Research & Development* $177.8 $282.6 $312.6 10.6% 75.8% Percent of revenues 11.3% 11.5% 11.6% Sales & Marketing $111.5 $196.4 $207.0 5.4% 85.7% Percent of revenues 7.1% 8.0% 7.7% General & Administrative $104.9 $172.6 $190.0 10.1% 81.1% Percent of revenues 6.6% 7.0% 7.1% Total Costs & Expenses $1,049.3 $1,640.6 $1,758.3 7.2% 67.6% Percent of revenues 66.5% 66.8% 65.4% Non-GAAP Q3'06 $Millions Q/Q Y/Y Q3'05 Q2'06 Q3'06 Costs of Revenues $653.8 $986.7 $1,046.6 6.1% 60.1% Percent of revenues 41.4% 40.2% 38.9% Research & Development $130.9 $212.0 $250.9 18.3% 91.7% Percent of revenues 8.3% 8.6% 9.3% Sales & Marketing $105.0 $182.1 $192.3 5.6% 83.1% Percent of revenues 6.7% 7.4% 7.1% General & Administrative $92.5 $150.6 $168.7 12.0% 82.4% Percent of revenues 5.9% 6.1% 6.3% Total Costs & Expenses $982.2 $1,531.4 $1,658.5 8.3% 68.9% Percent of revenues 62.3% 62.3% 61.6% * Q305 includes $20.8M of in-process R&D Note: Please refer to supporting Table 1 for reconciliations of non-GAAP costs and expenses to GAAP costs and expenses 7
  • 8. Profitability GAAP $Millions Q3'05 Q2'06 Q3'06 Income from Operations $529.2 $815.4 $931.3 Operating Margin 33.5% 33.2% 34.6% Net Income $381.2 $721.1 $733.4 Net Margin 24.1% 29.4% 27.3% EPS (diluted) $1.32 $2.33 $2.36 Non-GAAP $Millions Q3'05 Q2'06 Q3'06 Income from Operations $596.3 $924.5 $1,031.2 Operating Margin 37.8% 37.6% 38.3% Net Income $437.2 $772.1 $812.3 Net Margin 27.7% 31.4% 30.2% EPS (diluted) $1.51 $2.49 $2.62 Note: Please refer to supporting Table 2 for reconciliations of non-GAAP results of operations measures to the nearest comparable GAAP measures 8
  • 9. Free Cash Flow Q3'06 $Millions Q/Q Y/Y Q3'05 Q2'06 Q3'06 Net cash provided by operating activities $646.7 $840.6 $1,004.3 19.5% 55.3% Less purchases of property and equipment $292.5 $699.0 $492.2 (29.6)% 68.3% Free cash flow (Non-GAAP) $354.2 $141.6 $512.1 261.7% 44.6% 9
  • 10. YouTube Agreement • YouTube is one of the largest and fastest growing online video entertainment communities on the Internet • Google and YouTube share the vision of enabling anyone to upload, watch and share original videos worldwide, and the dedication to innovate with video to offer compelling services for our users and for content owners • YouTube to remain independent following close Company to remain in San Bruno, CA Transaction expected to close in Q4 10
  • 11. Summary • Strong results are a direct result of Google’s diversity across geographic regions, industry verticals, and advertiser/partner segments (small, medium, large). • Google continues to focus on innovation and on the user experience. • We continue to invest in our technology, infrastructure and people to maintain our market leadership and improve our competitive positioning. • Partnerships remain a key strategic initiative – Fox Interactive, eBay, Intuit – more to come. 11
  • 12. Table 1 - Reconciliations of non-GAAP costs and expenses to GAAP costs and expenses As a % of As a % of As a % of Q3'06 Q3'06 Revenues (1) Revenues (1) Revenues (1) Q/Q Y/Y $Millions Q3'05 Q2'06 Q3'06 6.0% 60.1% Cost of Revenues (GAAP) $ 655.1 41.5% $ 989.0 40.3% $ 1,048.7 39.0% Less: Stock-based compensation (1.3) - (2.3) - (2.1) - 6.1% 60.1% Cost of Revenues (non-GAAP) $ 653.8 41.4% $ 986.7 40.2% $ 1,046.6 38.9% Research and development (GAAP) 10.6% 75.8% $ 177.8 11.3% $ 282.6 11.5% $ 312.6 11.6% Less: Stock-based compensation (26.1) - (70.6) - (61.7) - - - Less: In-process research and development (2) (20.8) - - - - - - - Research and development (non-GAAP) 18.3% 91.7% $ 130.9 8.3% $ 212.0 8.6% $ 250.9 9.3% Sales and marketing (GAAP) $ 111.5 7.1% $ 196.4 8.0% $ 207.0 7.7% 5.4% 85.7% Less: Stock-based compensation (6.5) - (14.3) - (14.7) - - - Sales and marketing (non-GAAP) $ 105.0 6.7% $ 182.1 7.4% $ 192.3 7.1% 5.6% 83.1% General and administrative (GAAP) $ 104.9 6.6% $ 172.6 7.0% $ 190.0 7.1% 10.1% 81.1% Less: Stock-based compensation (12.4) - (22.0) - (21.3) - - - General and administrative (non-GAAP) $ 92.5 5.9% $ 150.6 6.1% $ 168.7 6.3% 12.0% 82.4% Total costs and expenses (GAAP) $ 1,049.3 66.5% $ 1,640.6 66.8% $ 1,758.3 65.4% 7.2% 67.6% Less: Stock-based compensation (46.3) - (109.2) - (99.8) - - - Less: In-process research and development (2) (20.8) - - - - - - - Total costs and expenses (non-GAAP) $ 982.2 62.3% $ 1,531.4 62.3% $ 1,658.5 61.6% 8.3% 68.9% (1) Percentages based on GAAP Revenues of $1,578 million in Q3 '05, $2,456 million in Q2 '06 and $2,690 million in Q3 '06 (2) In-process research and development relates to an acquisition 12
  • 13. Table 2 - Reconciliations of non-GAAP results of operations measures to the nearest comparable GAAP measures As a % of As a % of As a % of Revenues (1) Revenues (1) Revenues (1) $Millions except per share amounts Q3'05 Q2'06 Q3'06 Income from operations (GAAP) $ 529.2 33.5% $ 815.4 33.2% $ 931.3 34.6% Add: Stock-based compensation 46.3 - 109.1 - 99.9 - Add: In-process research and development (2) 20.8 - - - - - Income from operations (non-GAAP) $ 596.3 37.8% $ 924.5 37.6% $ 1,031.2 38.3% Net income (GAAP) $ 381.2 24.1% $ 721.1 29.4% $ 733.4 27.3% Add: Stock-based compensation (net of tax) 35.2 - 83.3 - 78.9 - Add: In-process research and development (net of tax) 20.8 - - - - - Less: One-time gain from the sale of our investment in Baidu (net of tax) - - (32.3) - - - Net income (non-GAAP) $ 437.2 27.7% $ 772.1 31.4% $ 812.3 30.2% Net income per share - diluted (GAAP) $1.32 $2.33 $2.36 Net income per share - diluted (non-GAAP) $1.51 $2.49 $2.62 Shares used in per share calculation - diluted 290 310 311 (1) Percentages based on GAAP revenues of $1,578 million in Q3 '05, $2,456 million in Q2 '06 and $2,690 million in Q3 '06 (2) In-process research and development relates to an acquisition 13
  • 14. Q3 2006 Earnings Conference Call