Download to read offline
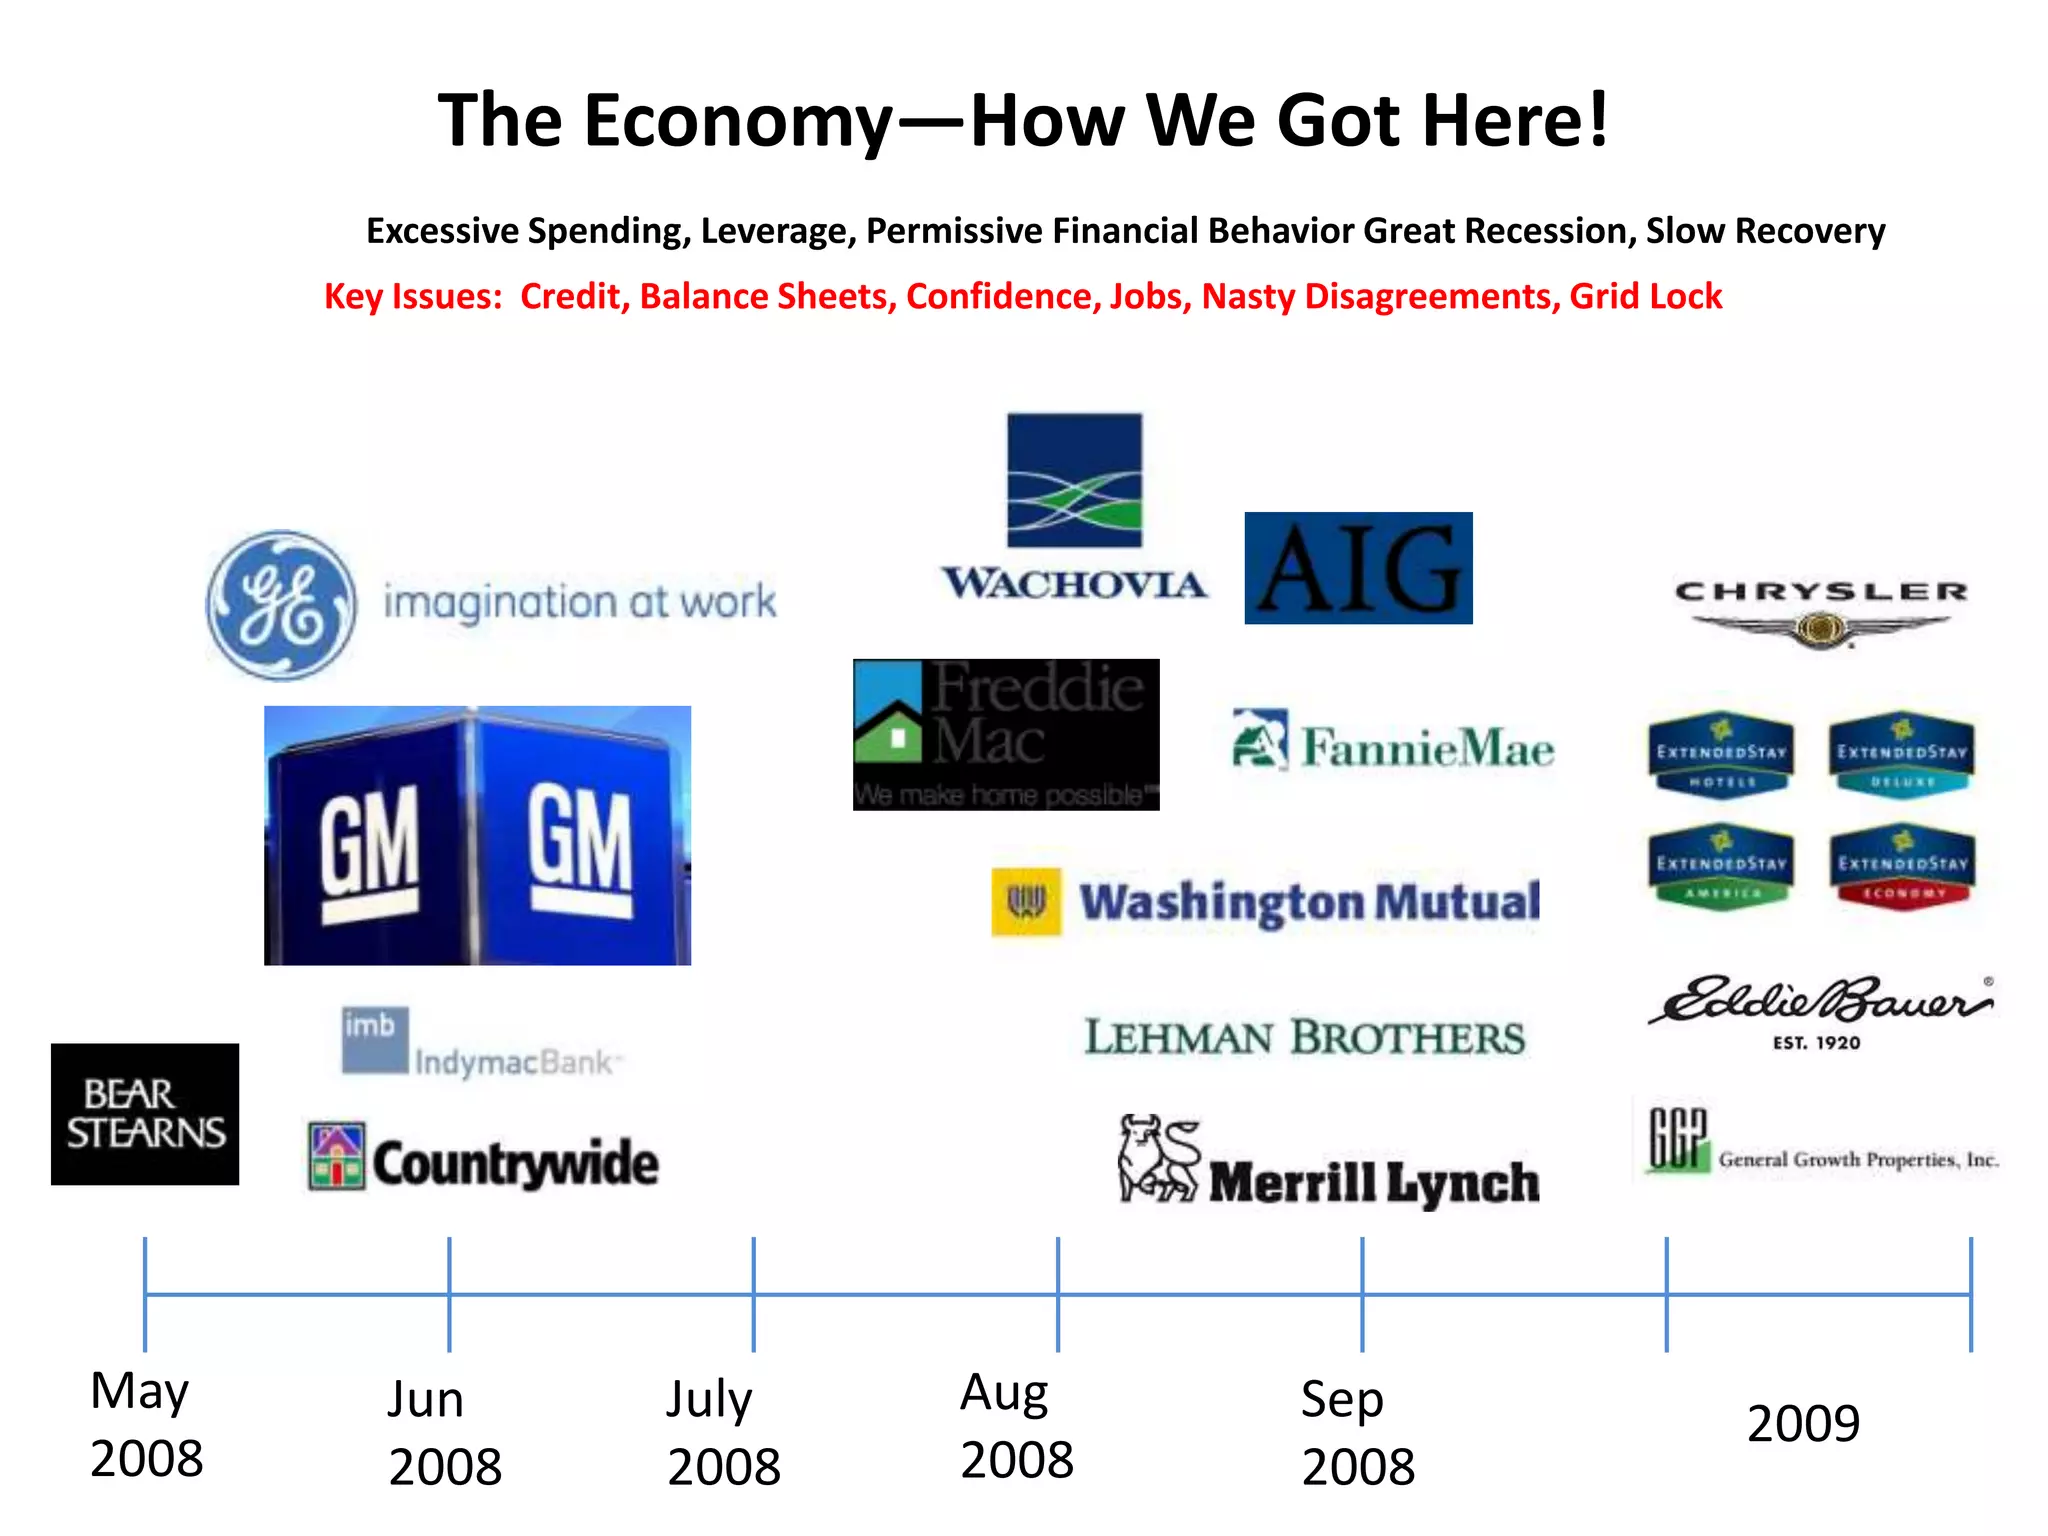
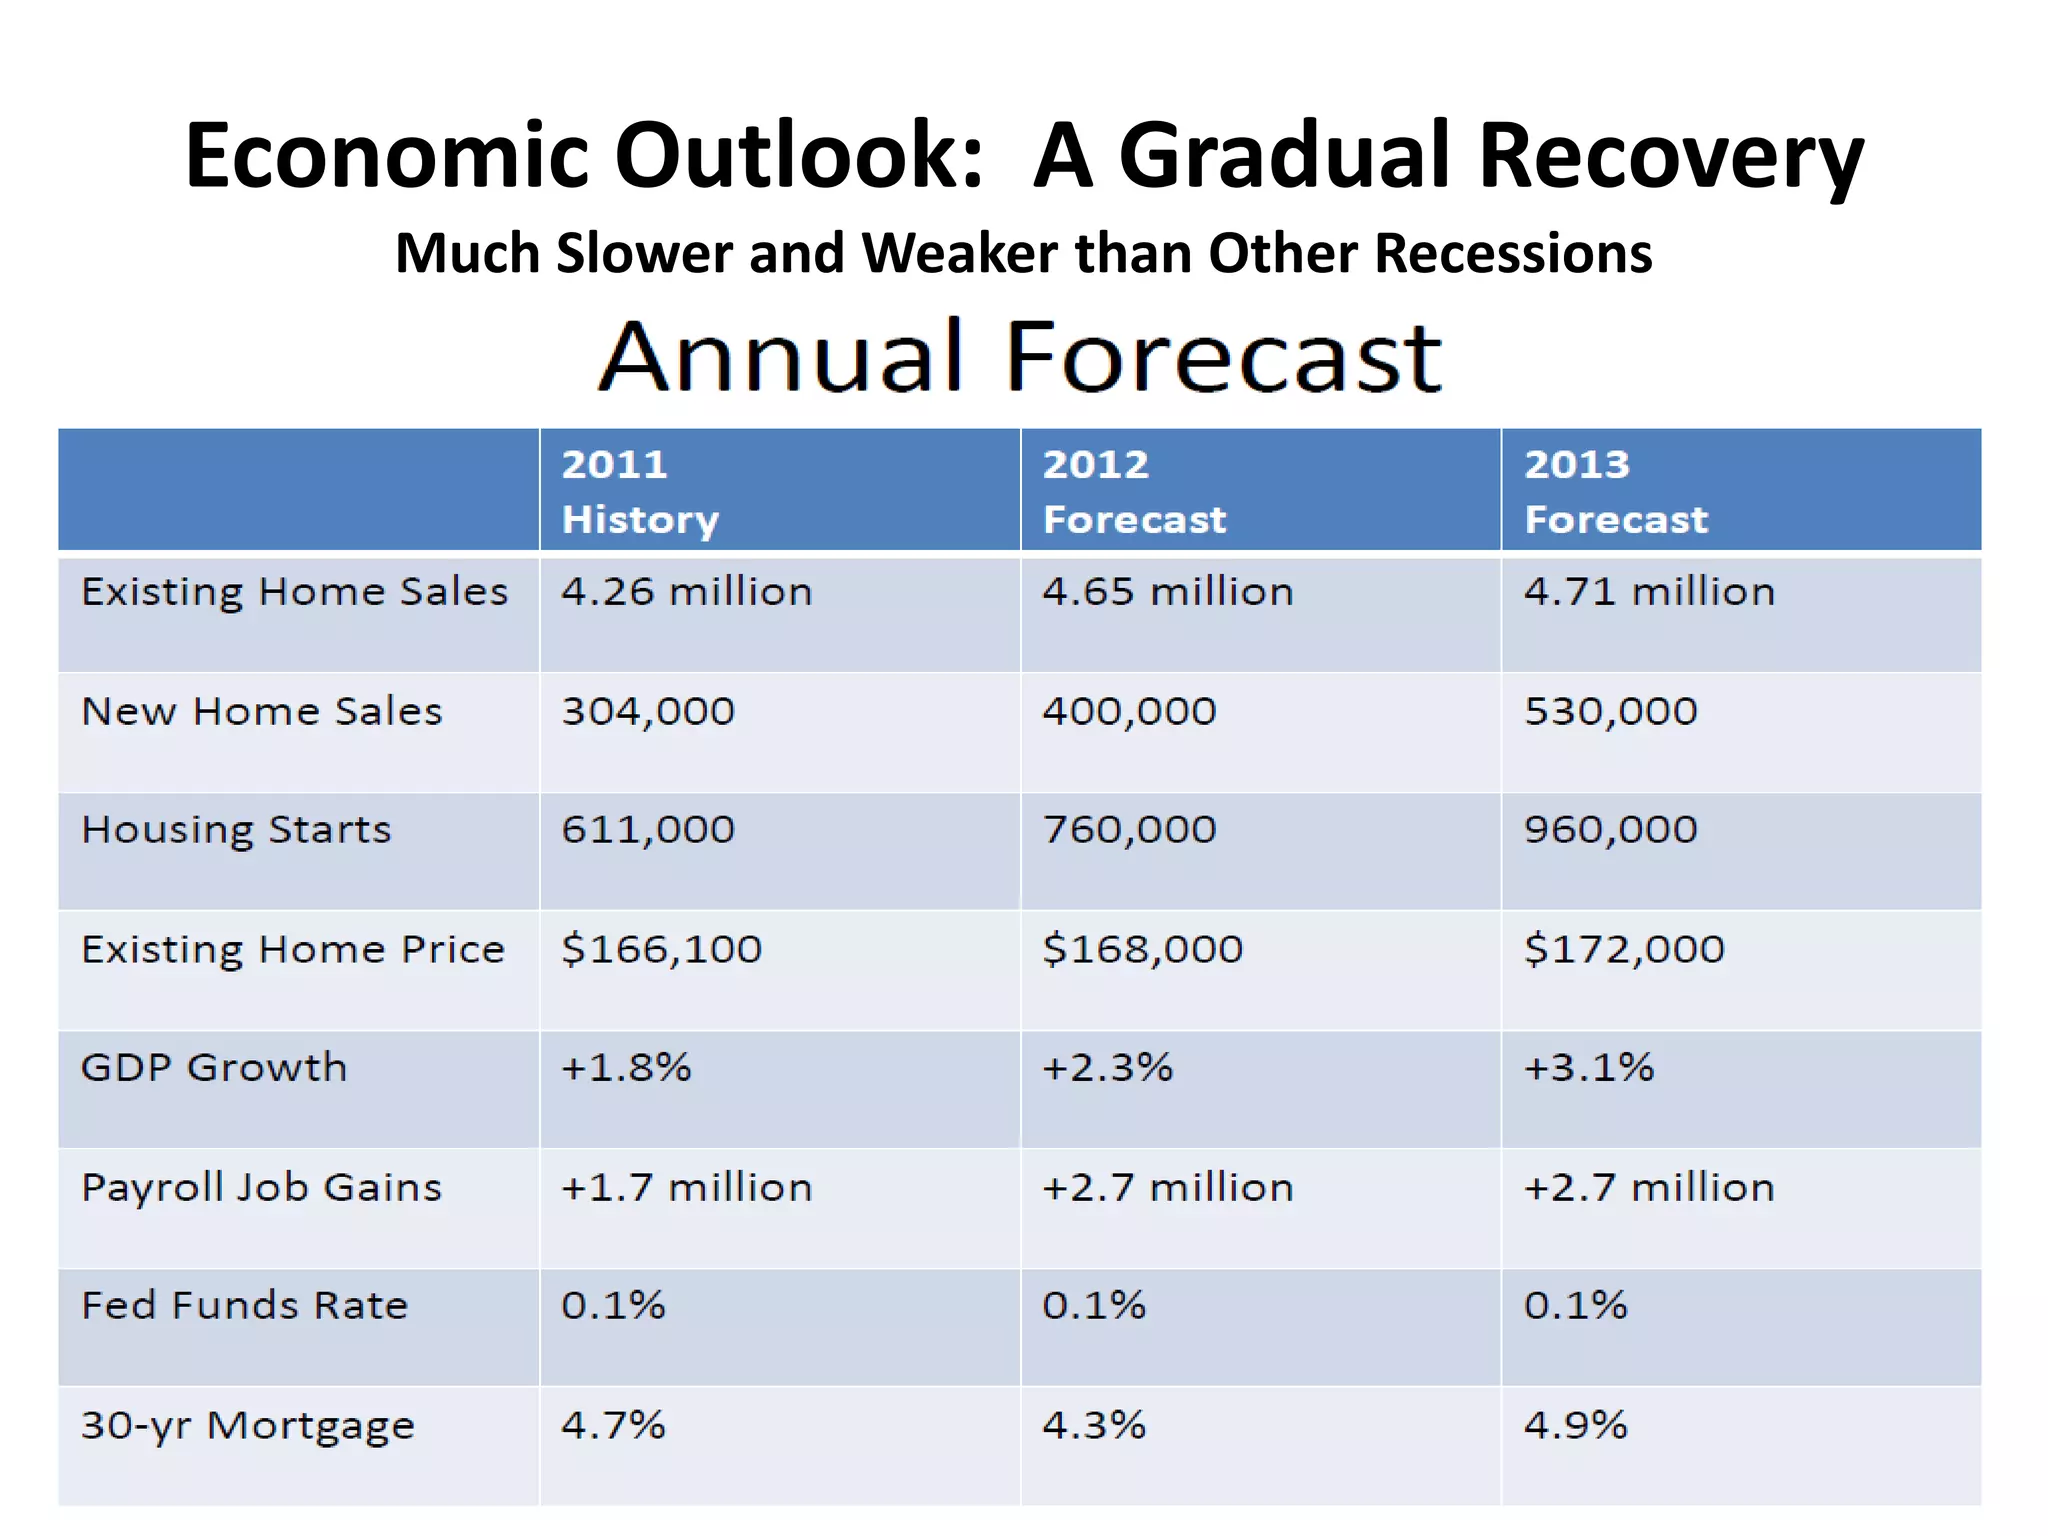
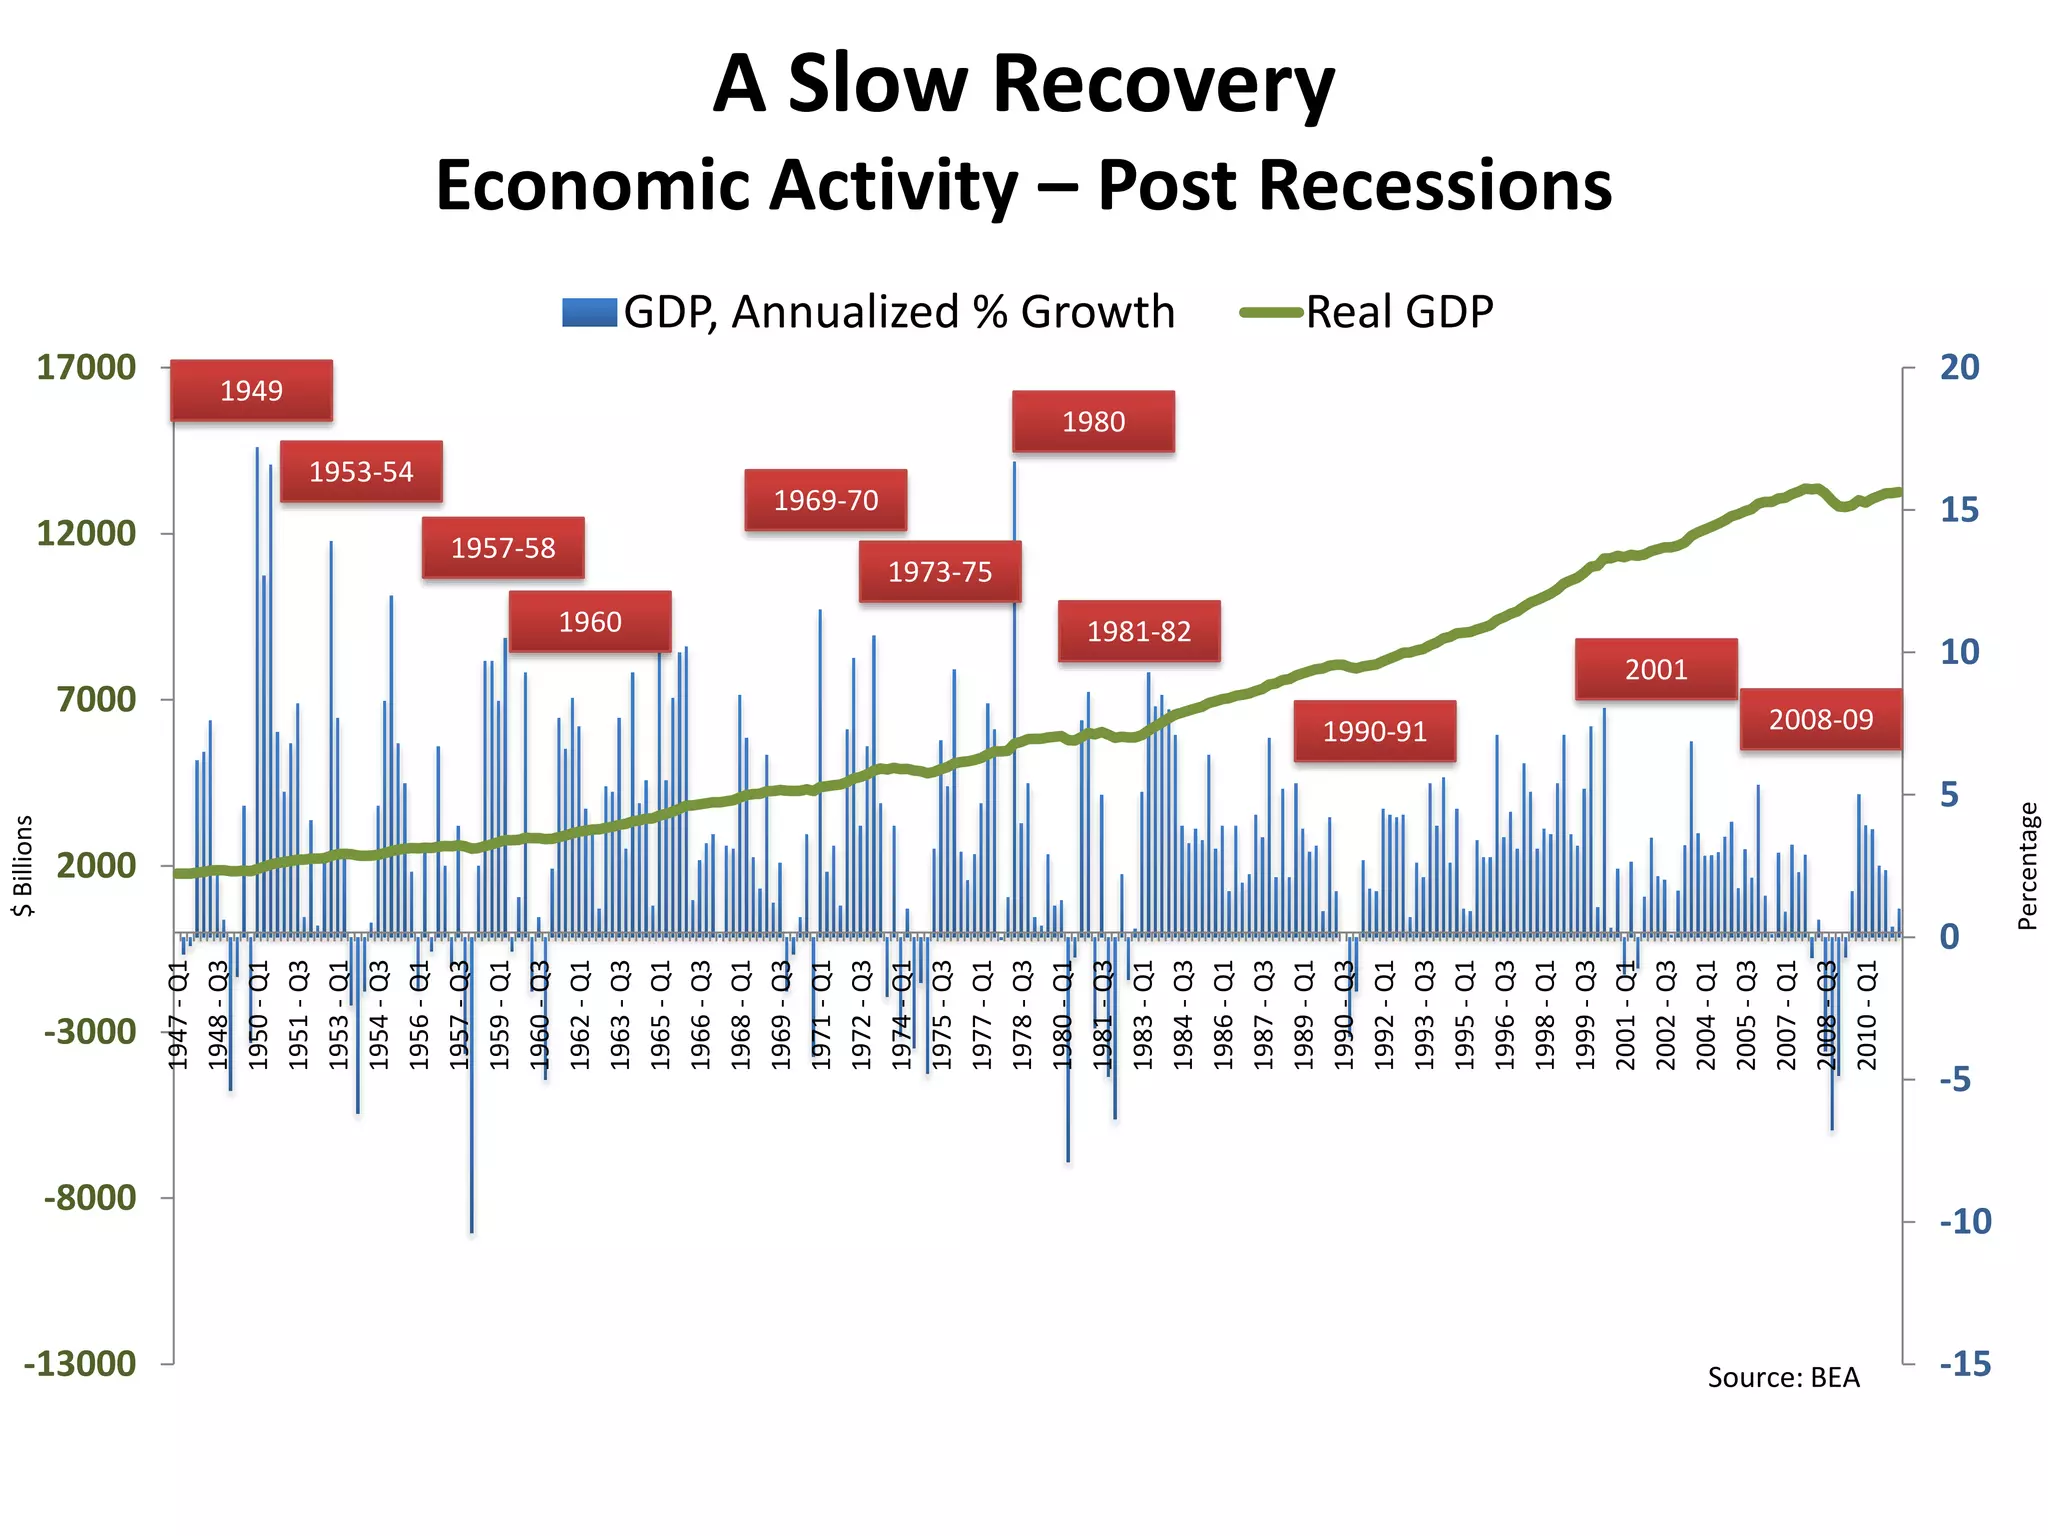
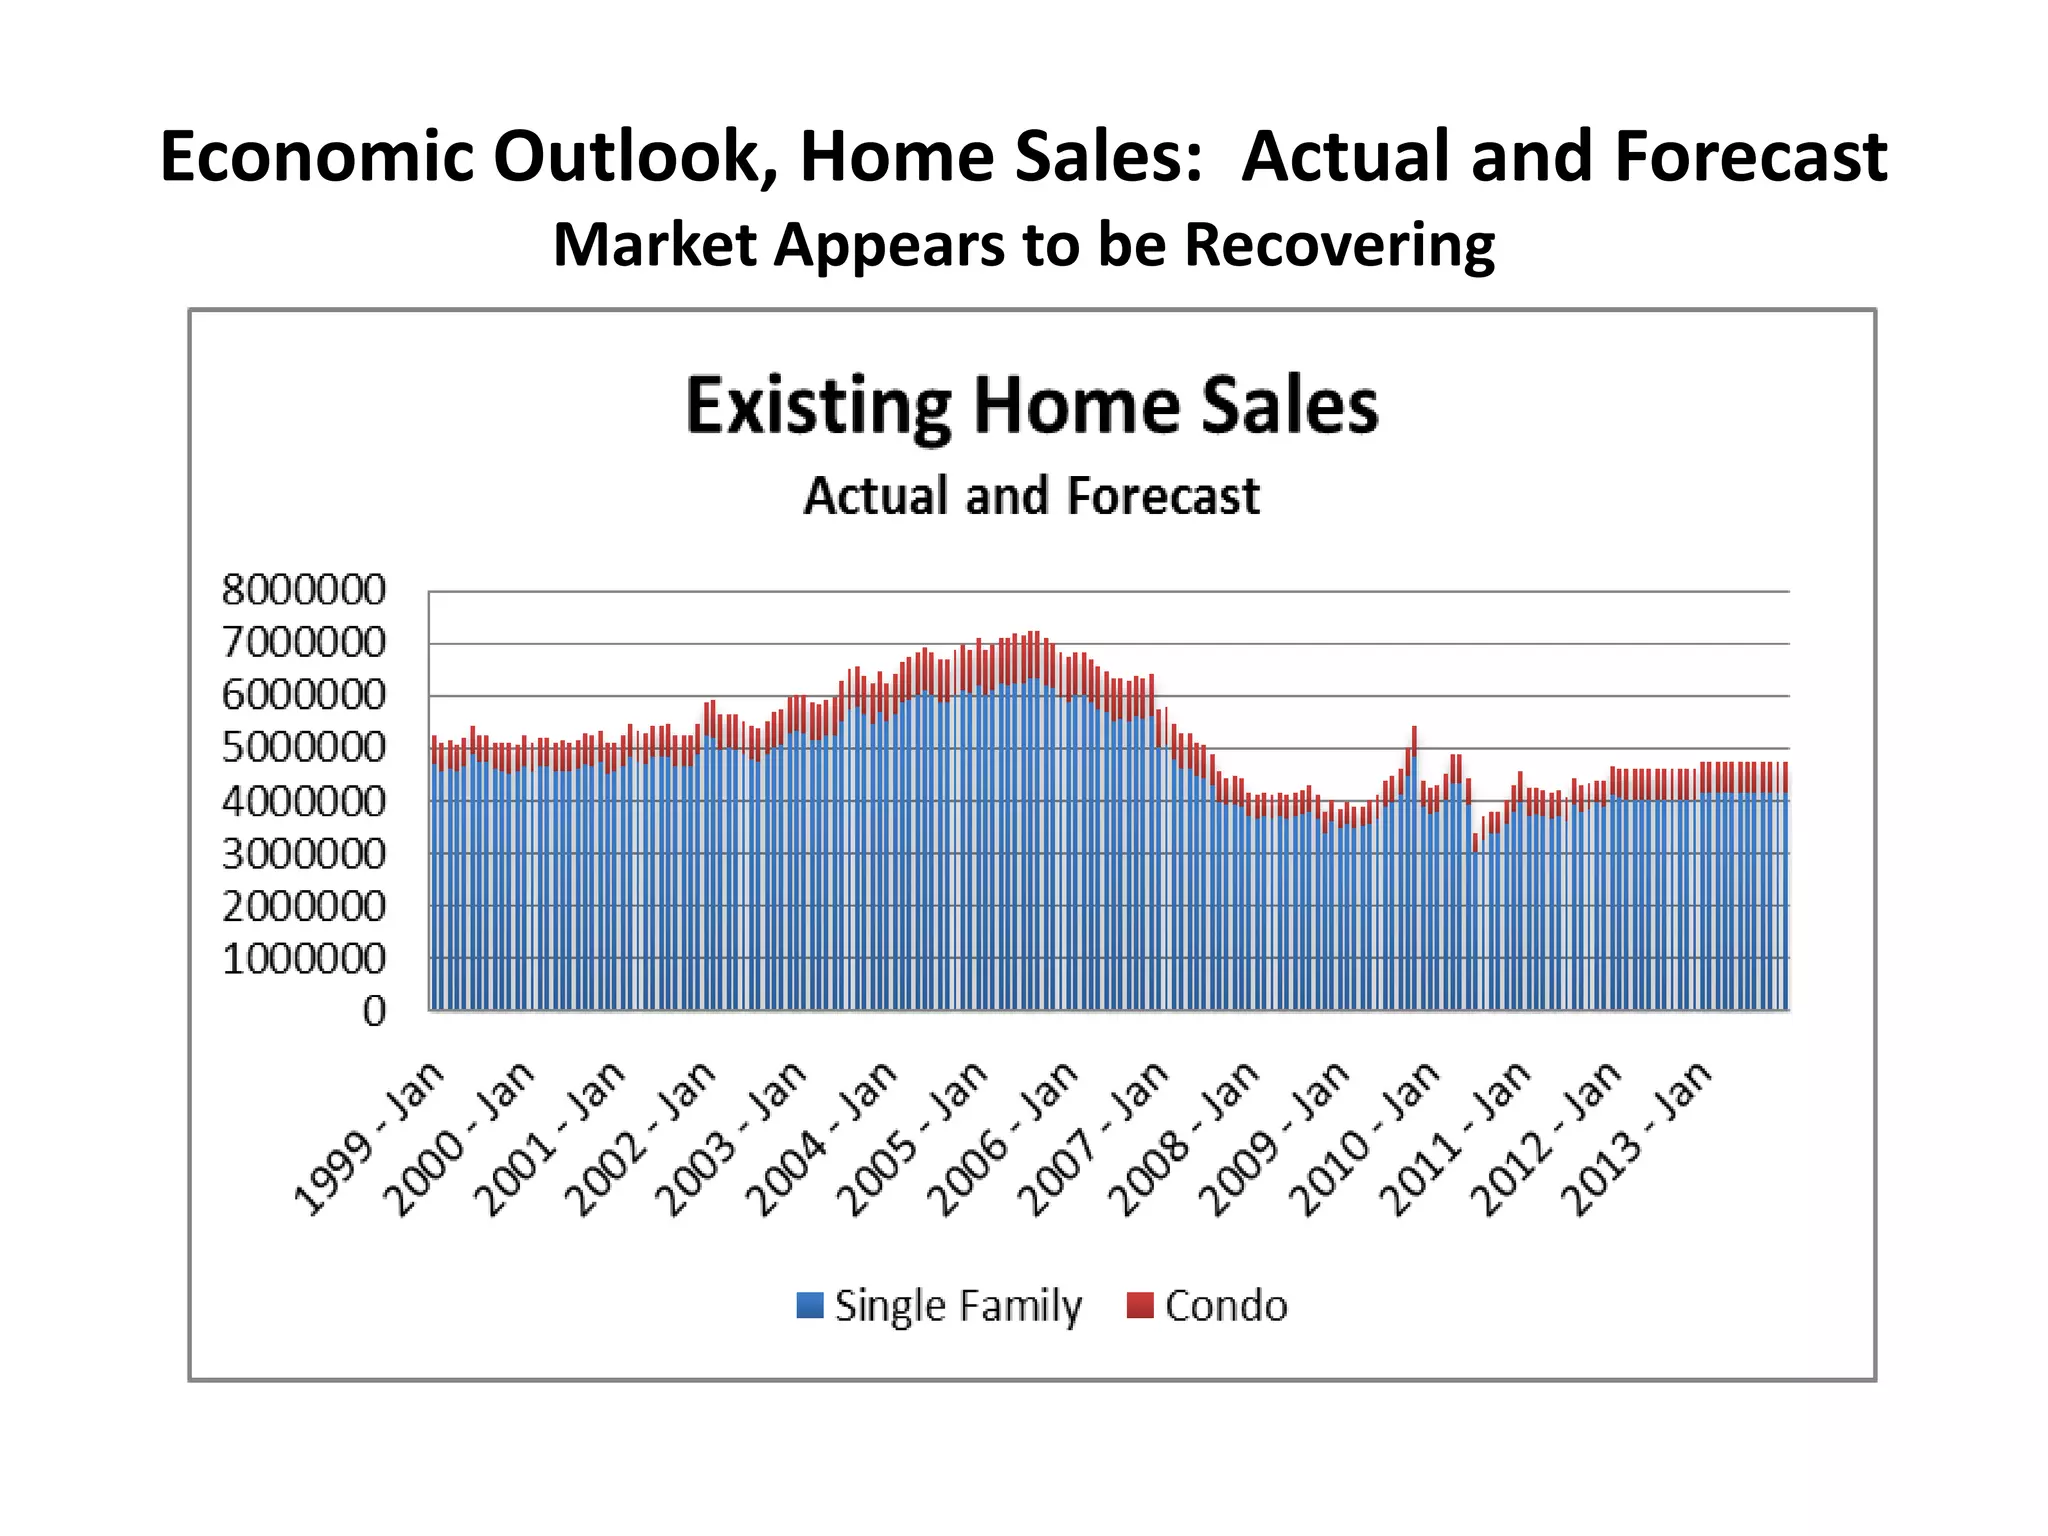

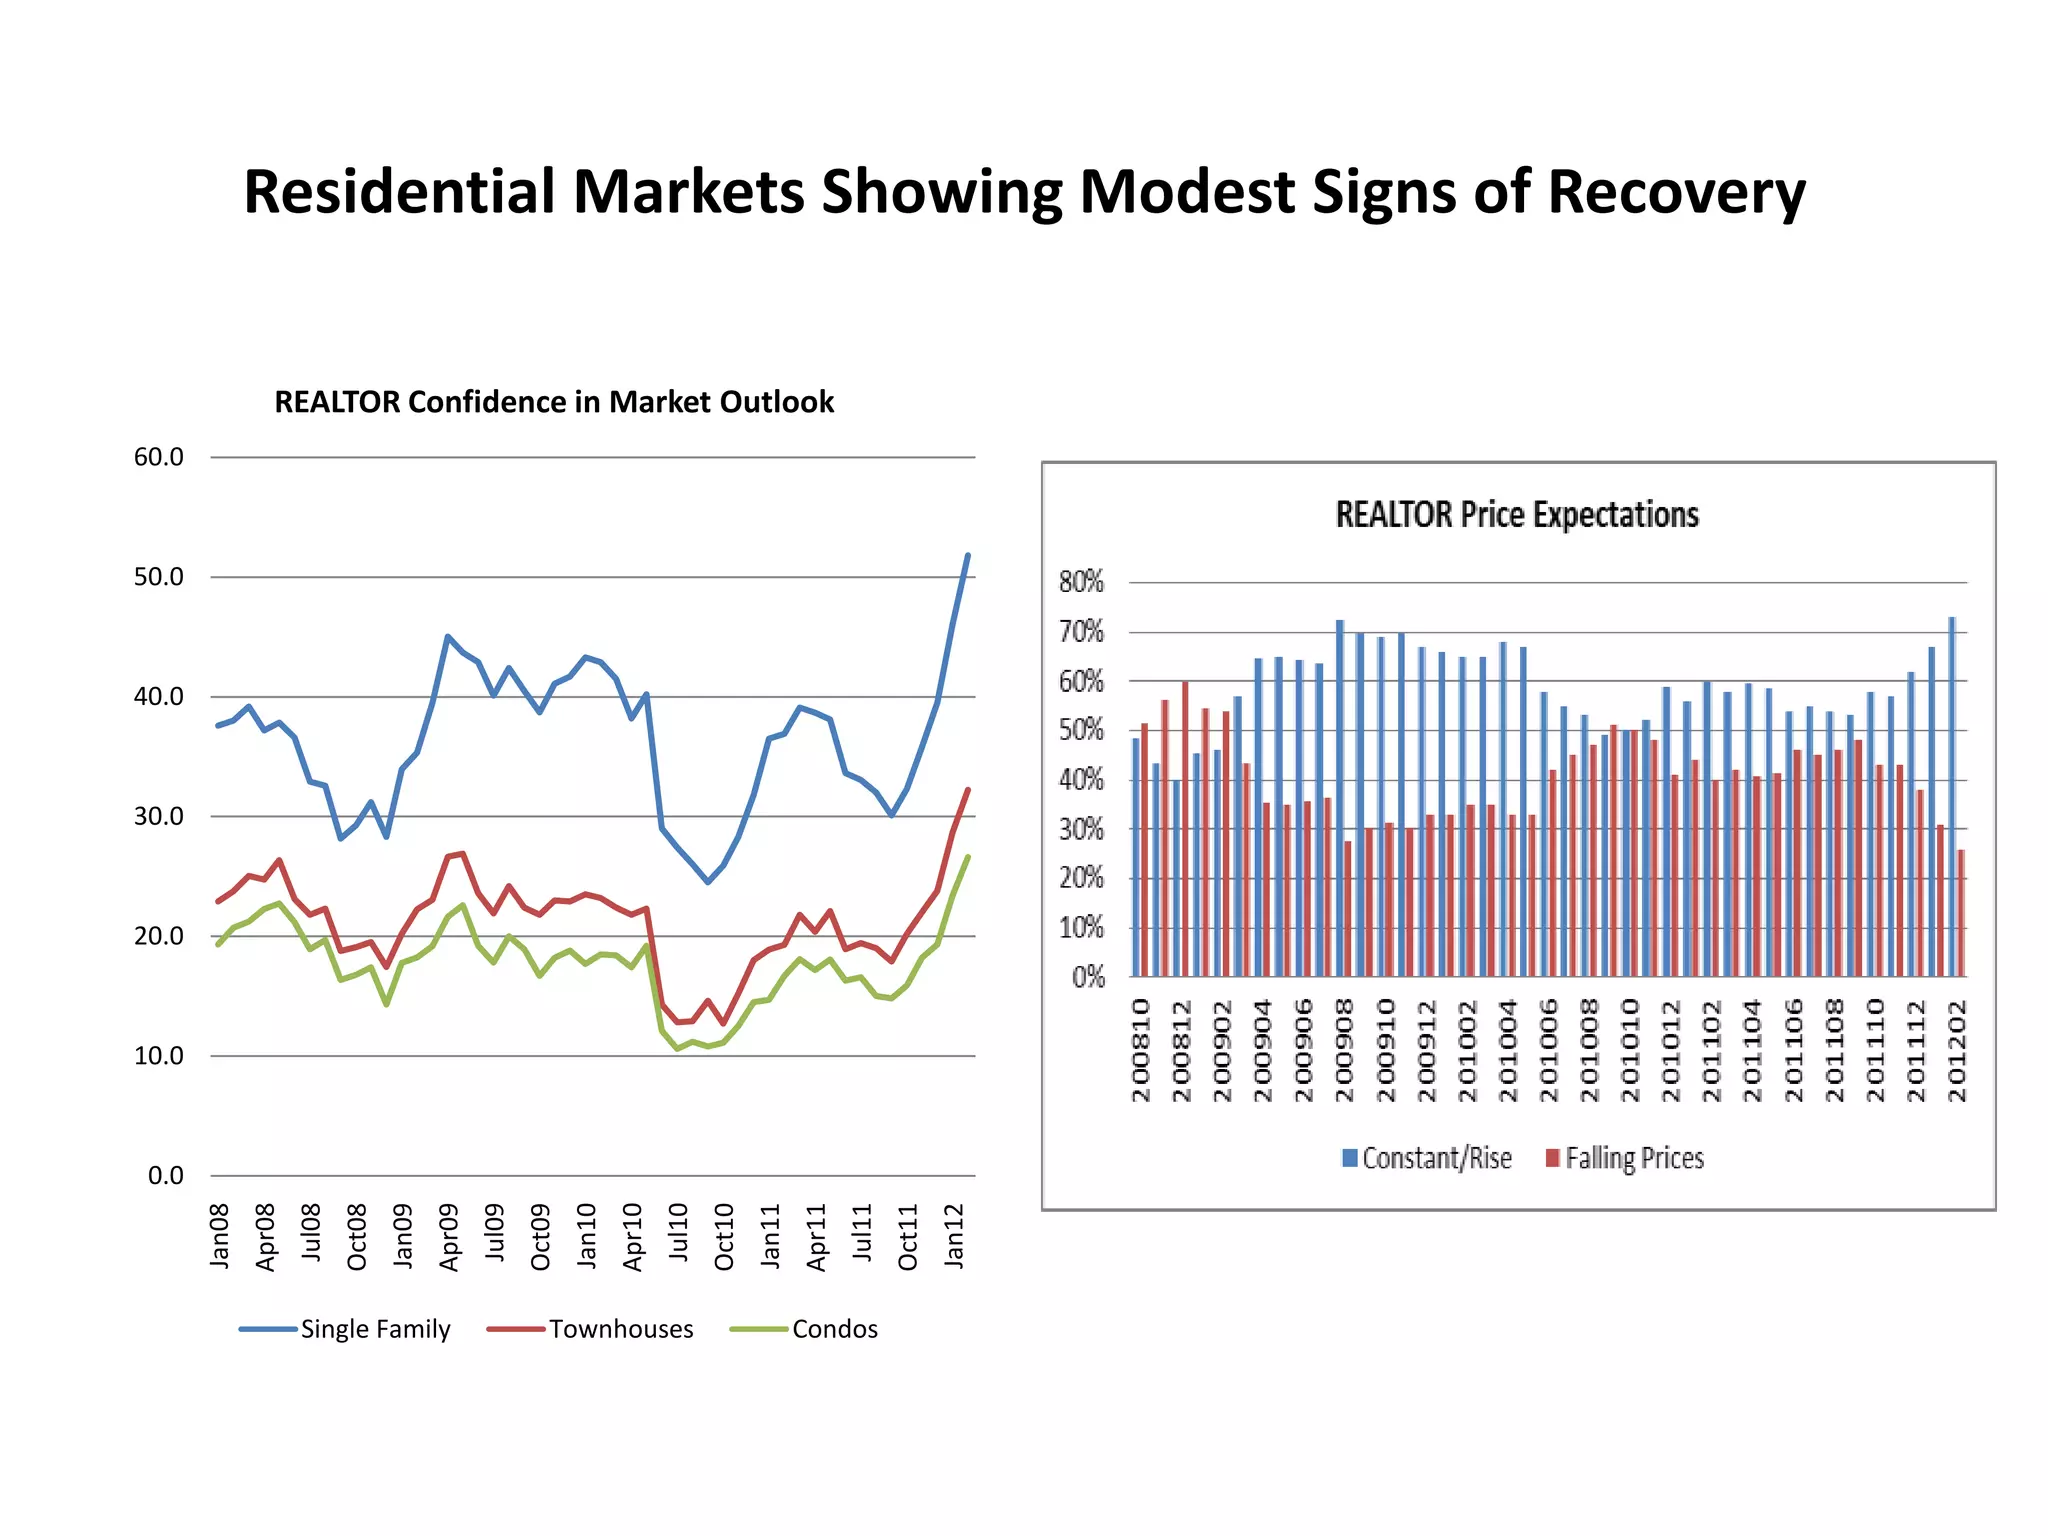
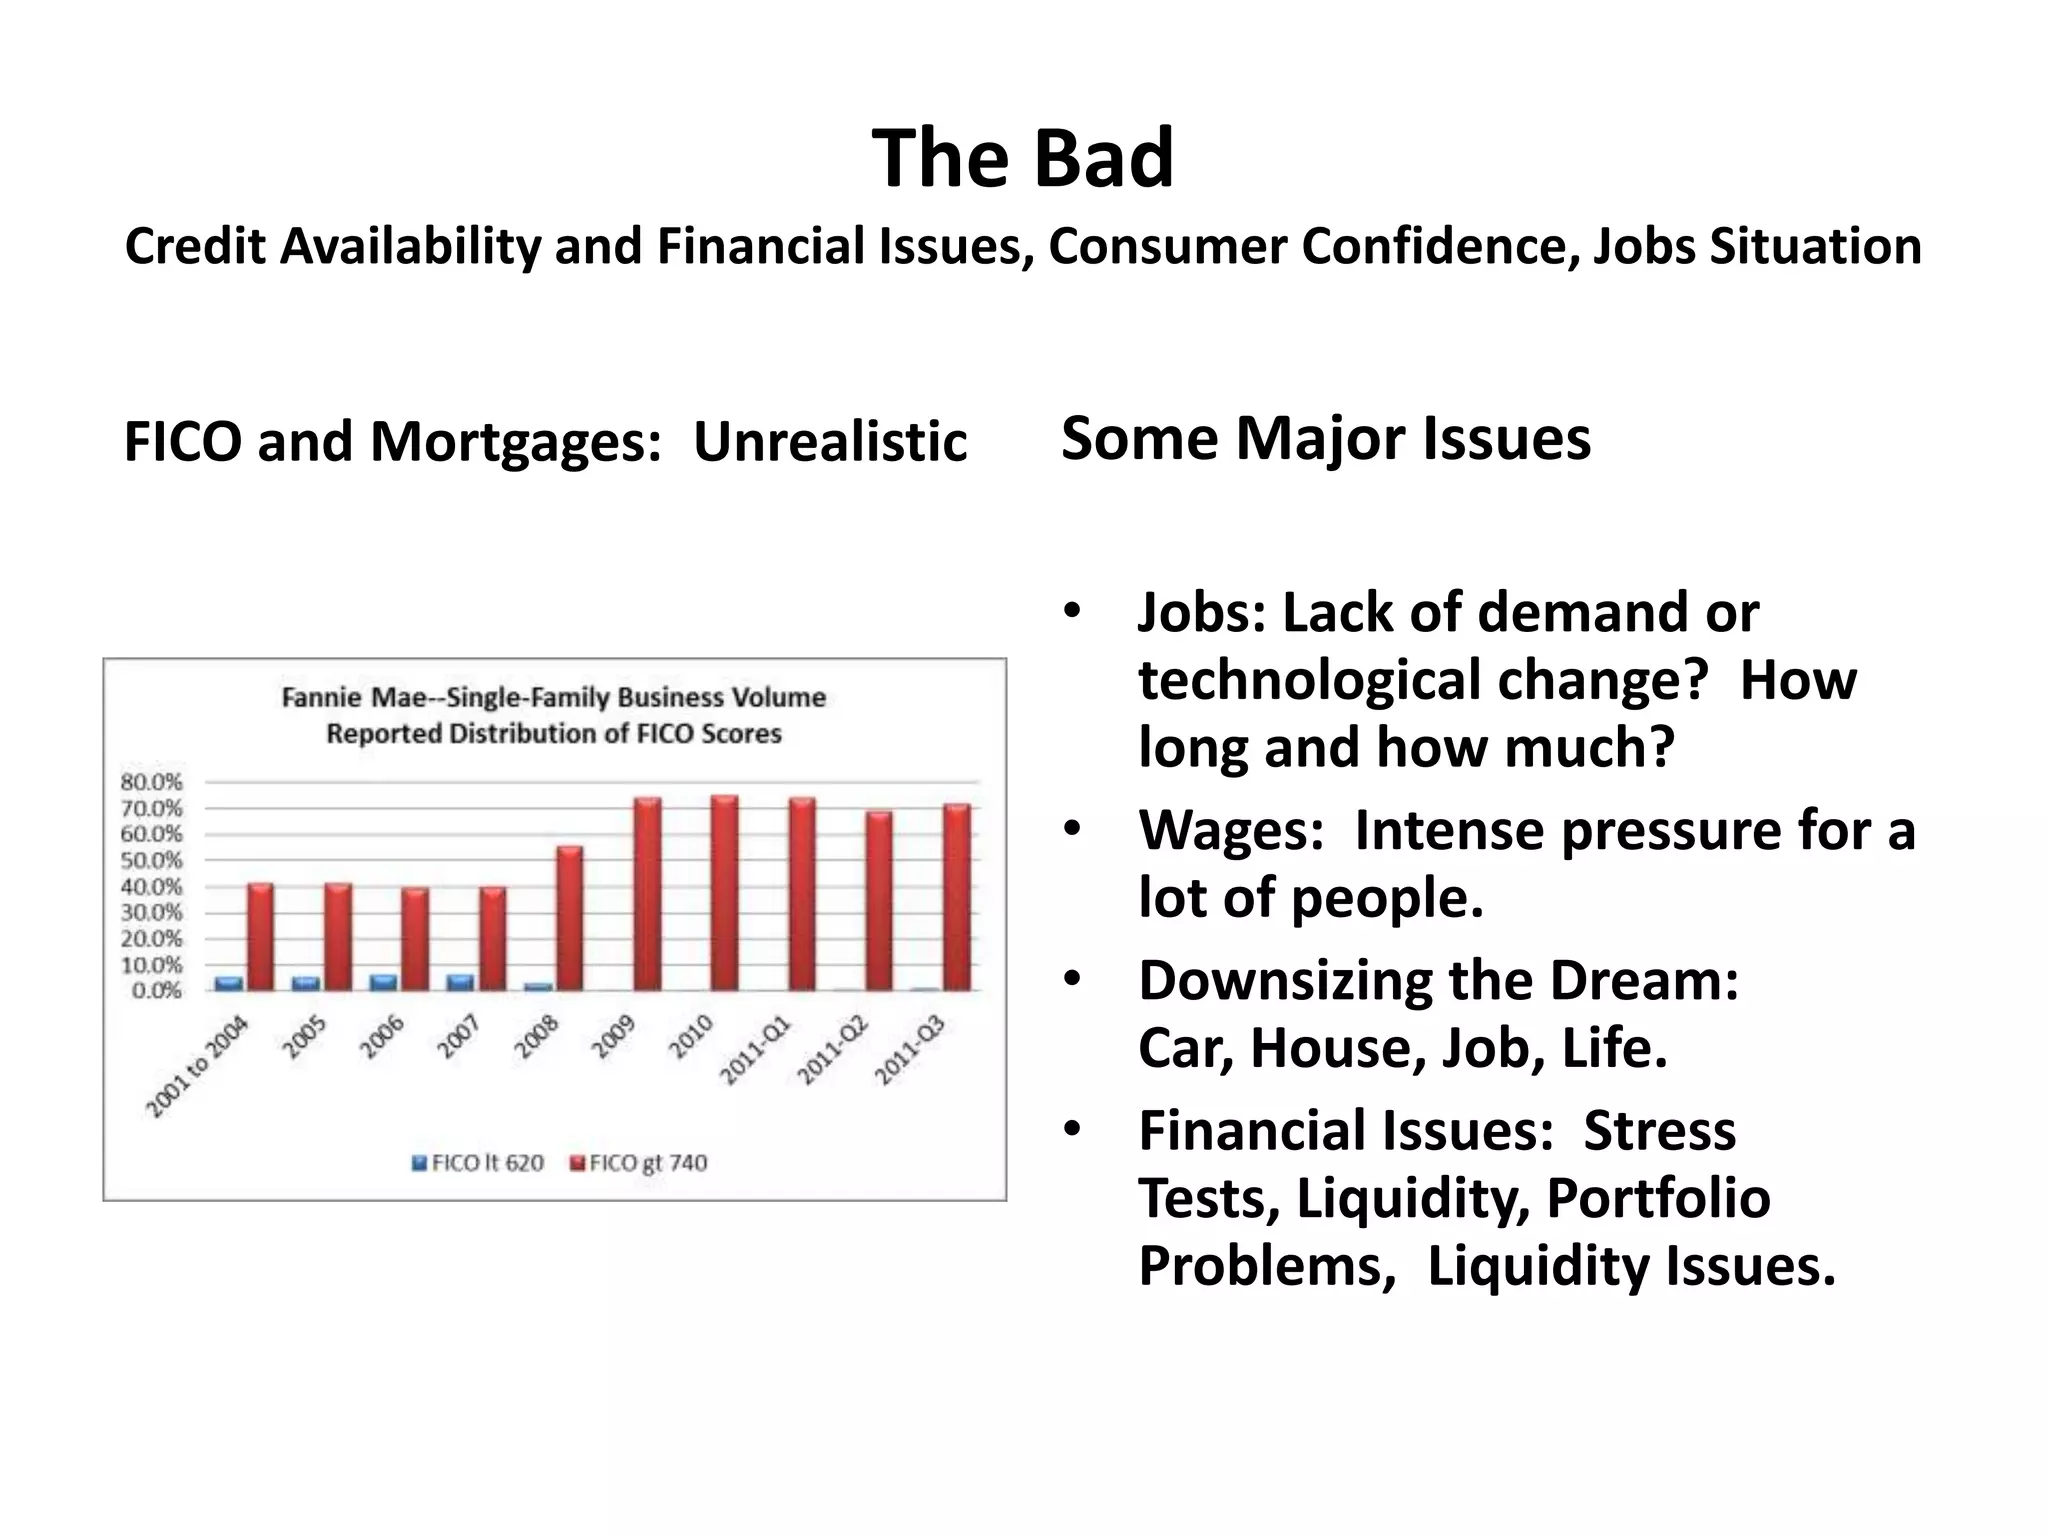
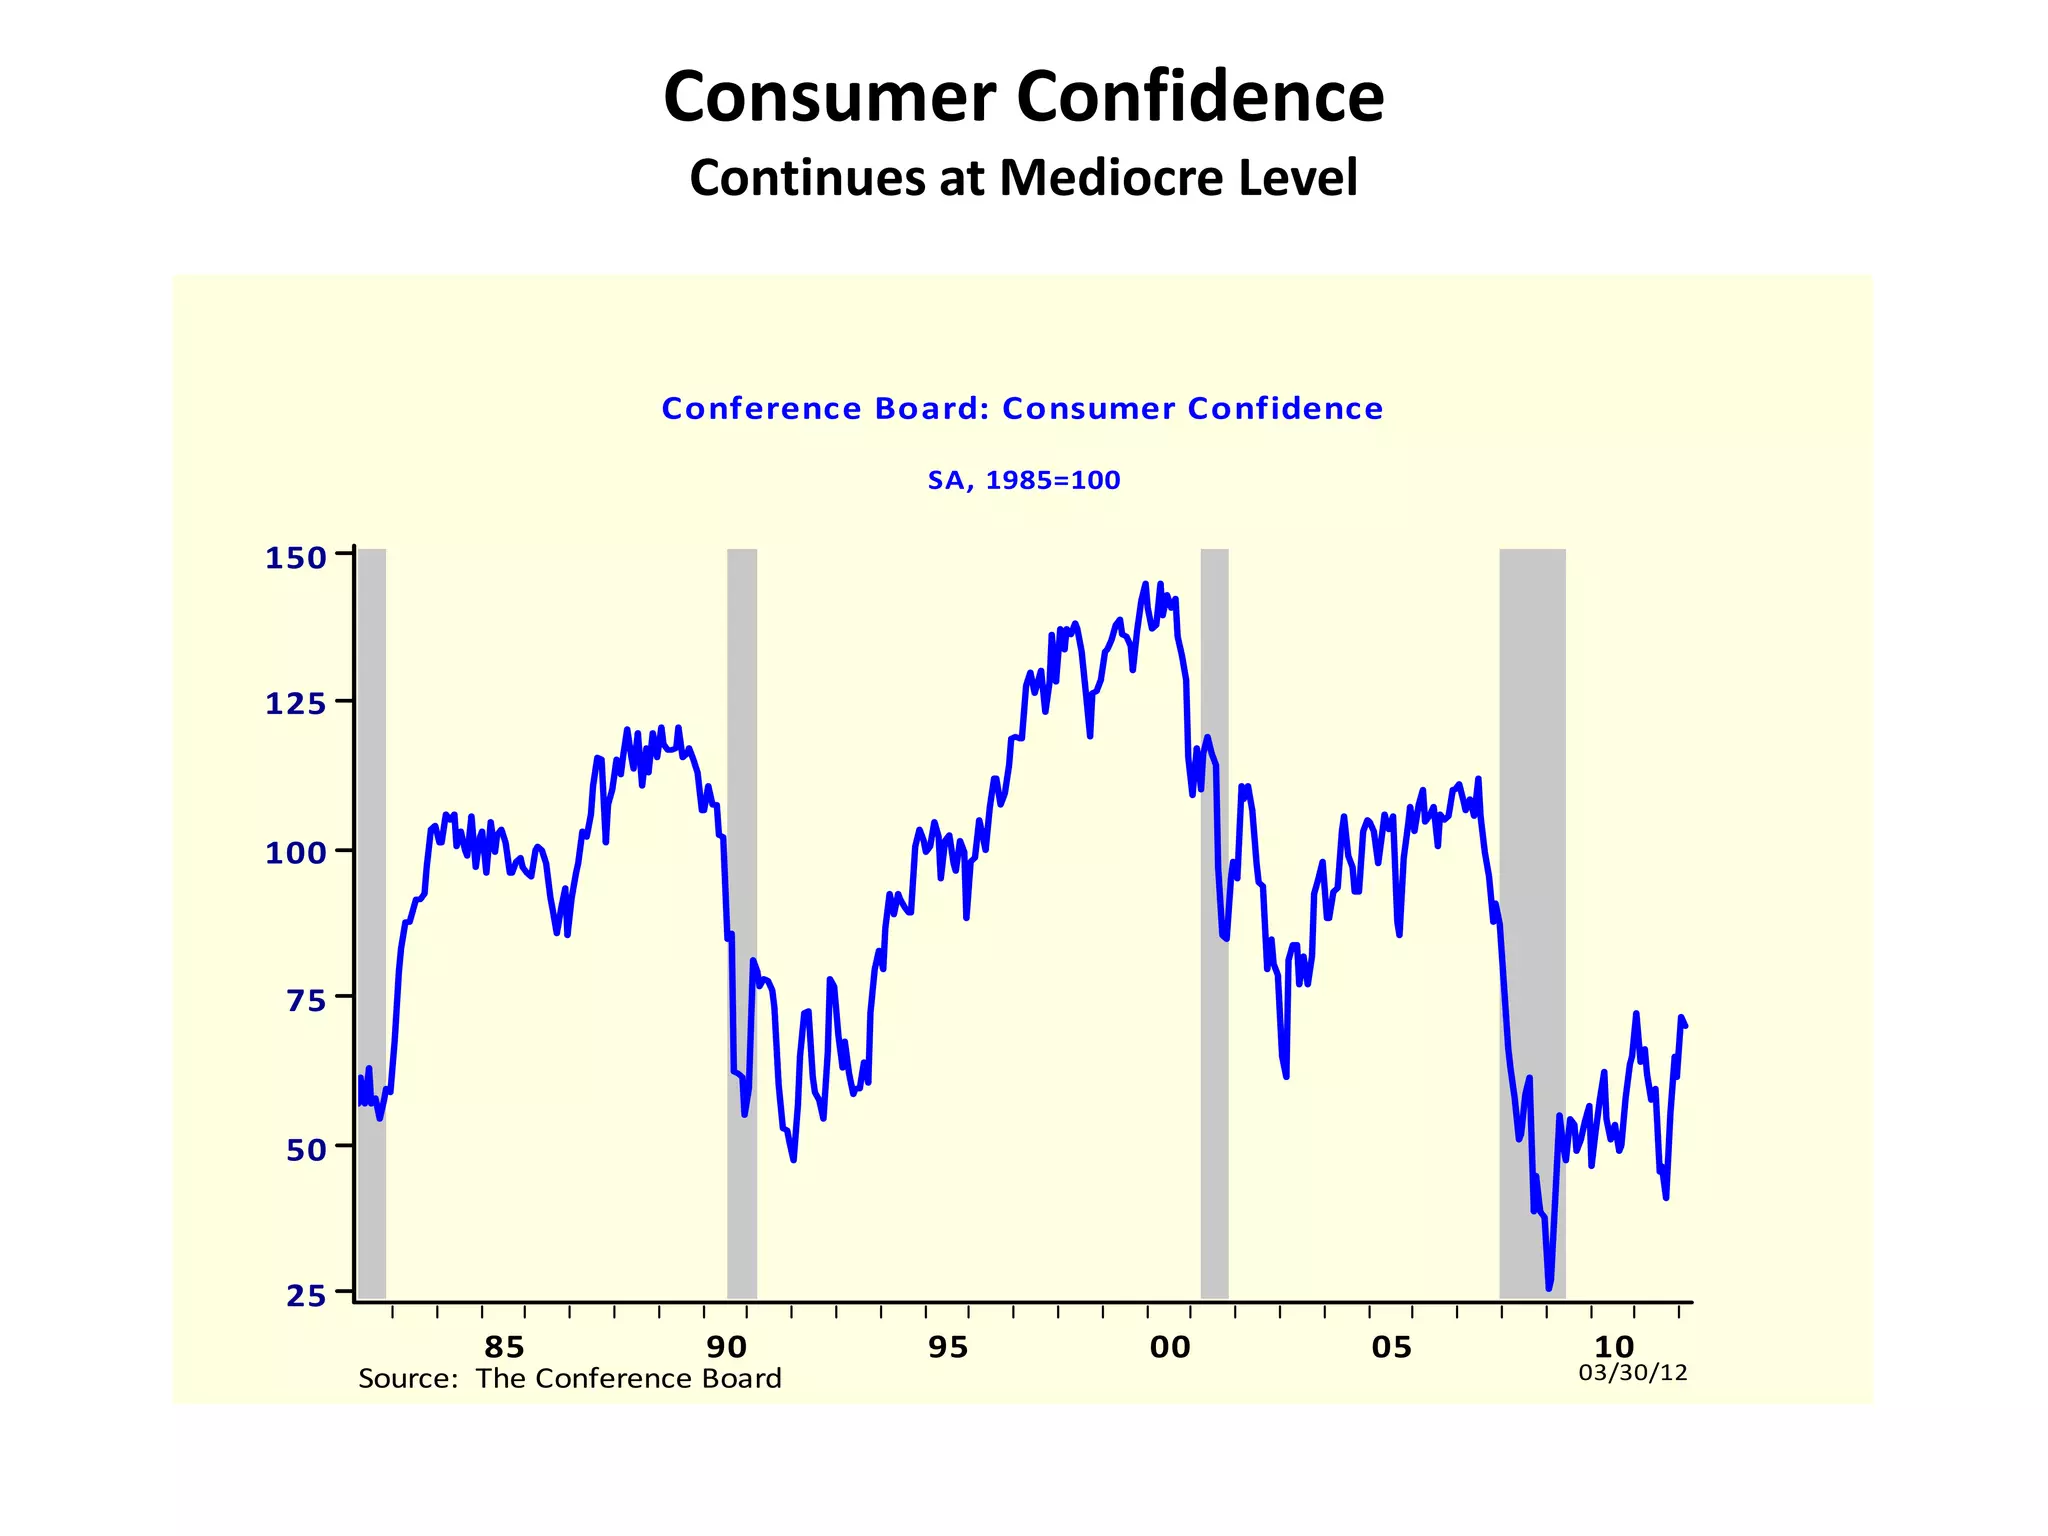
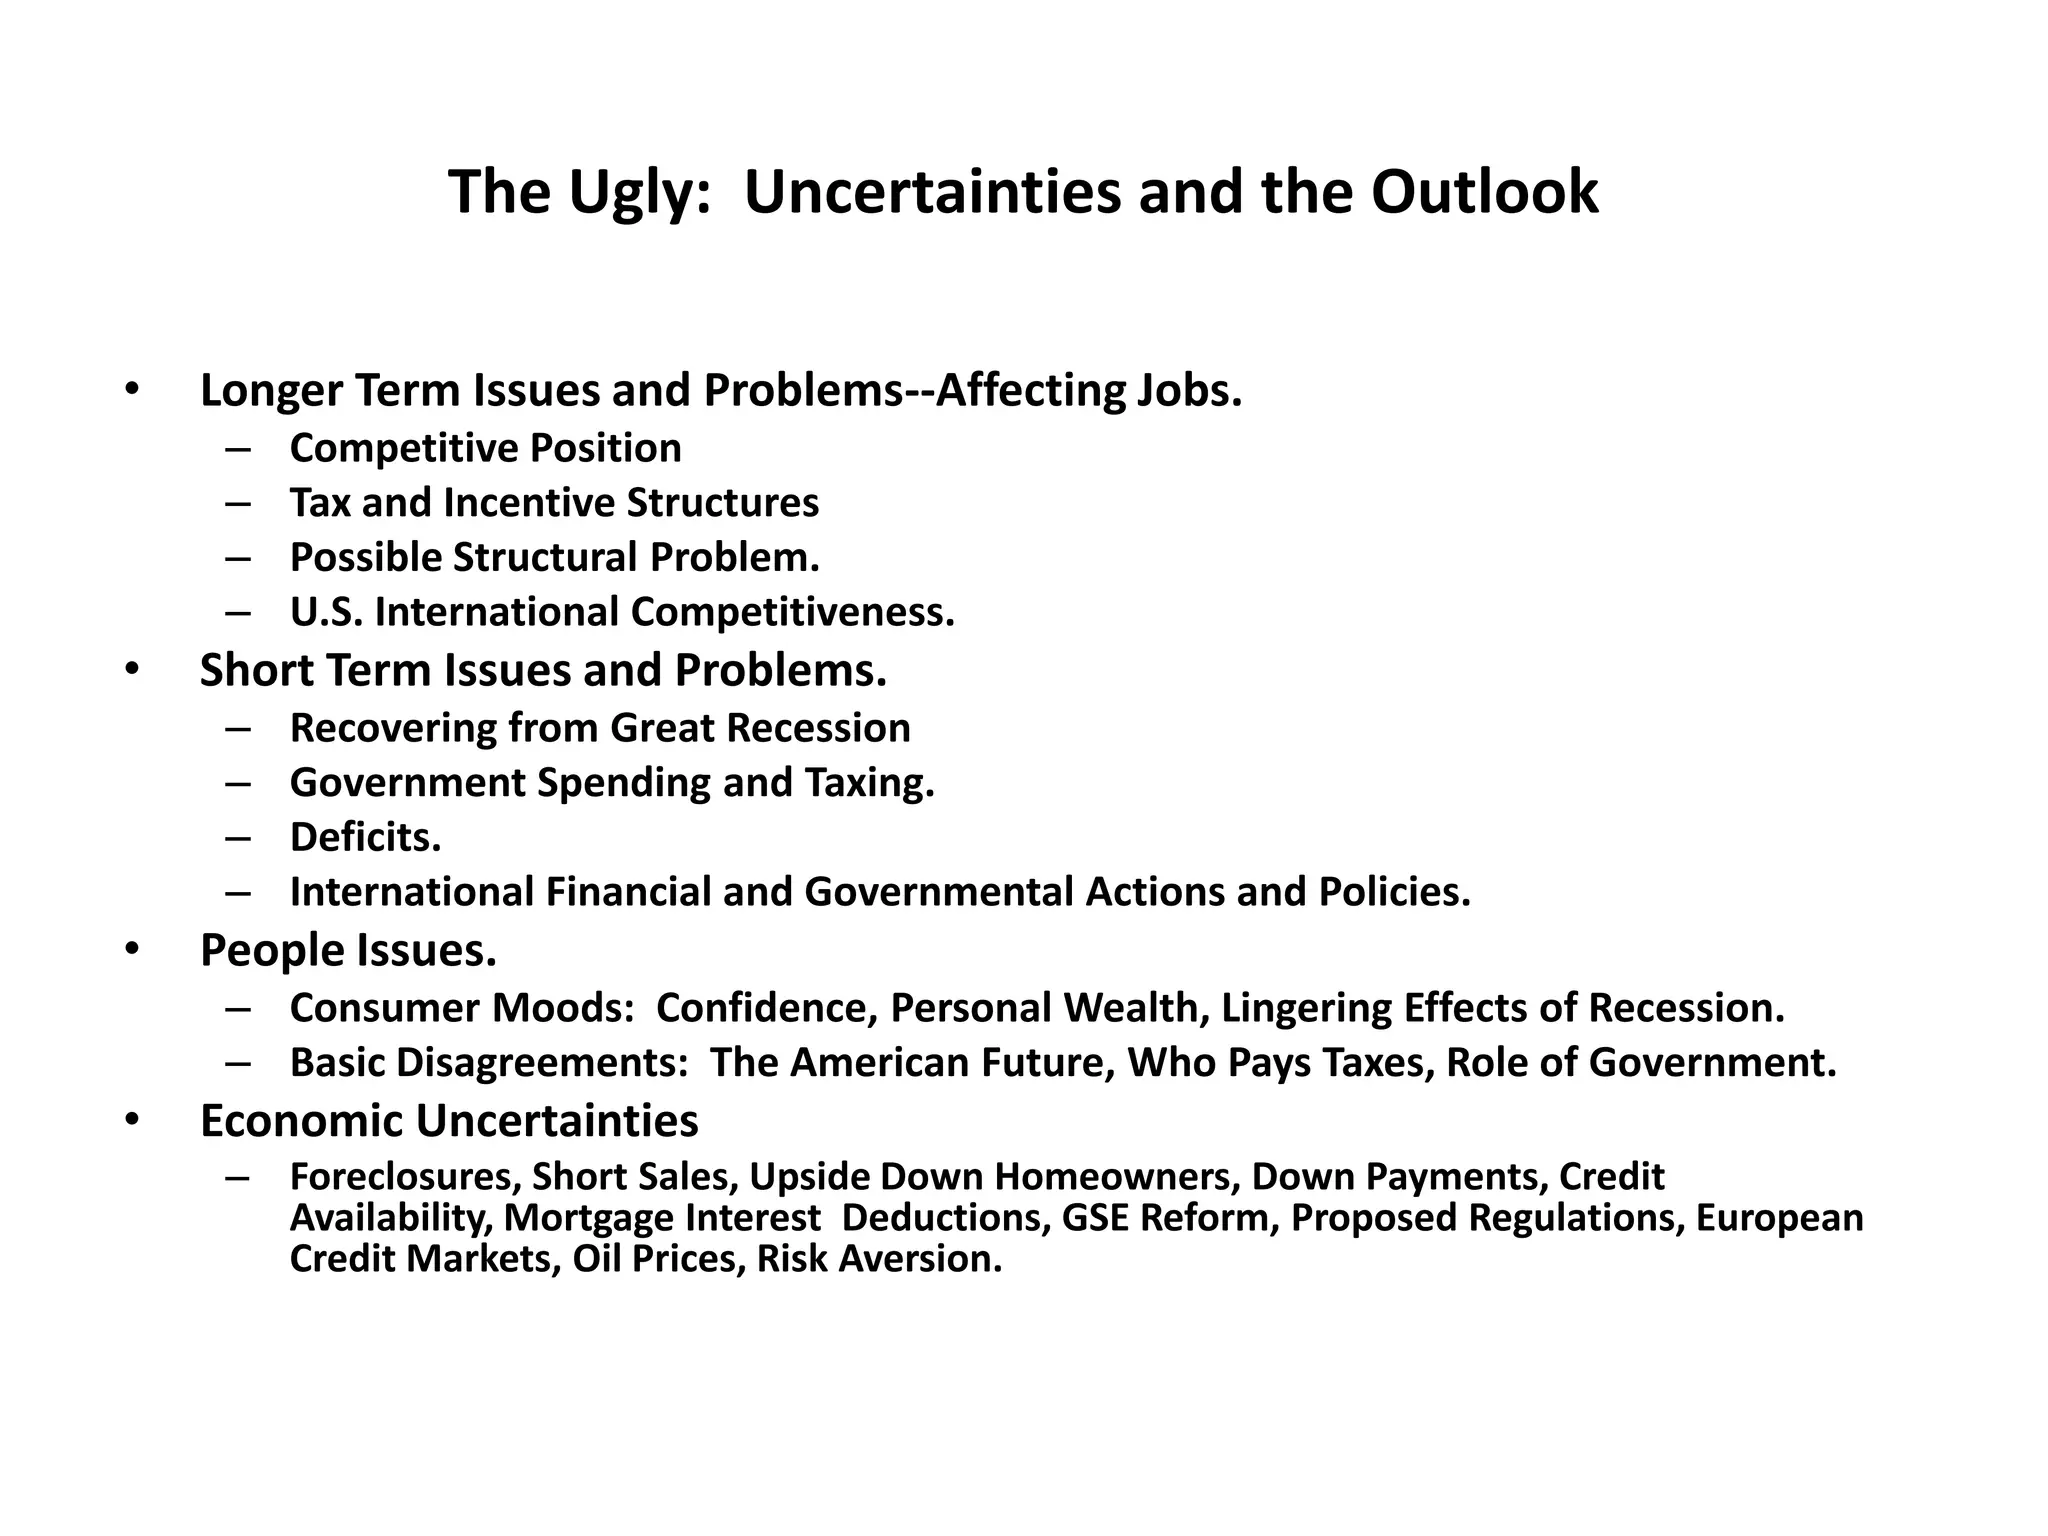
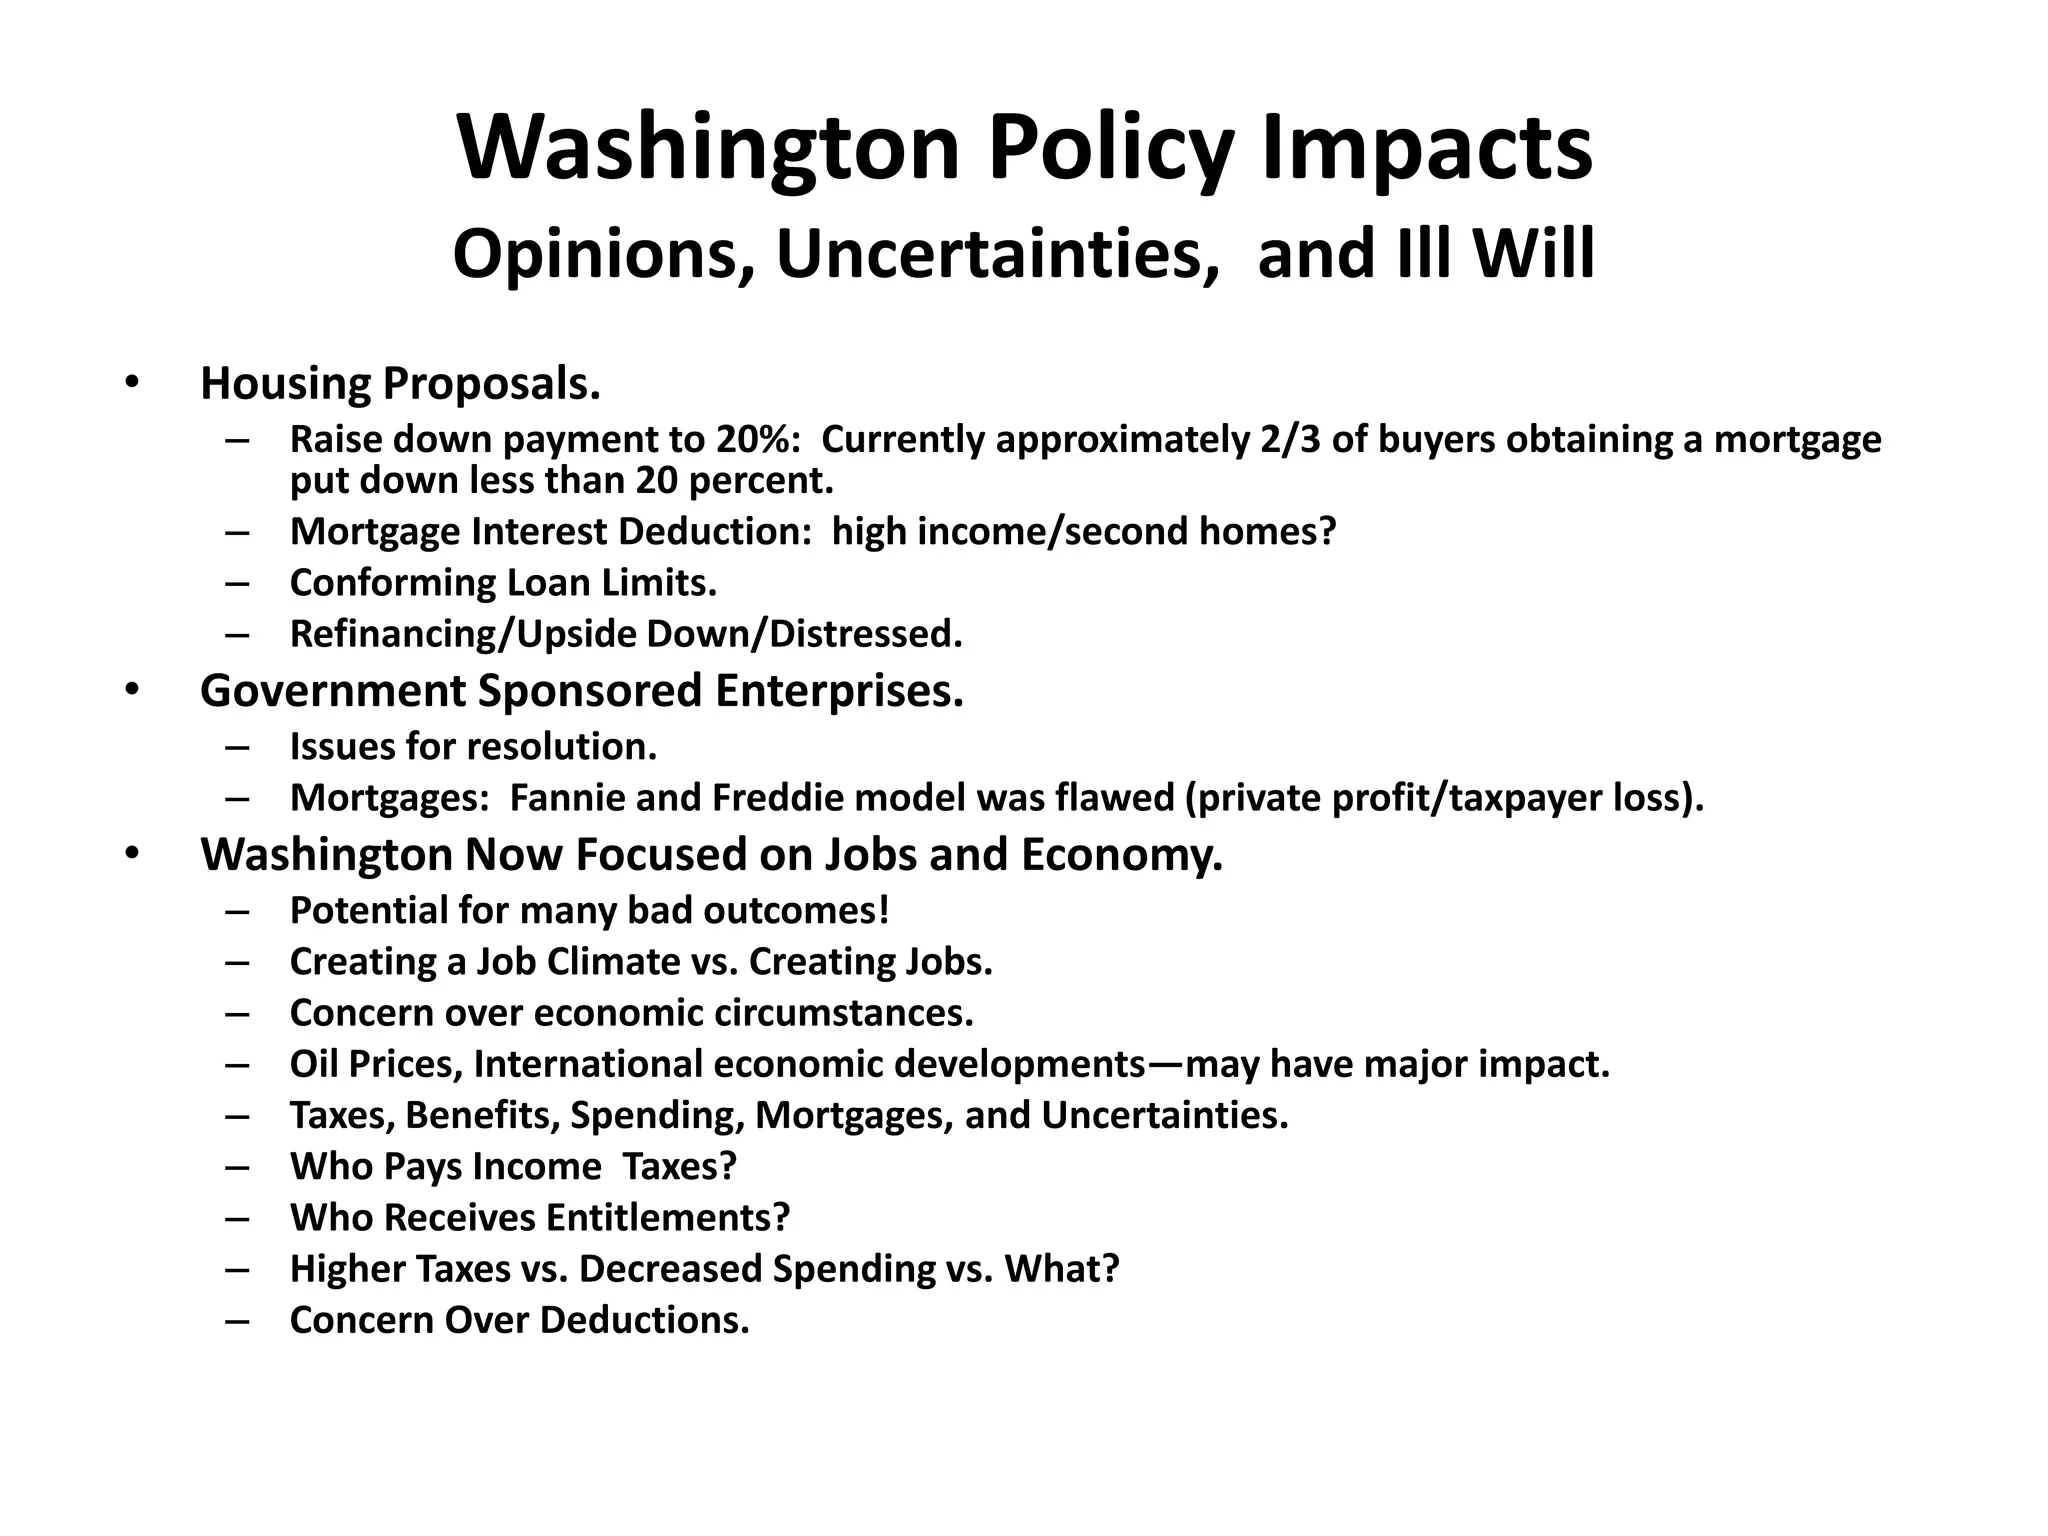

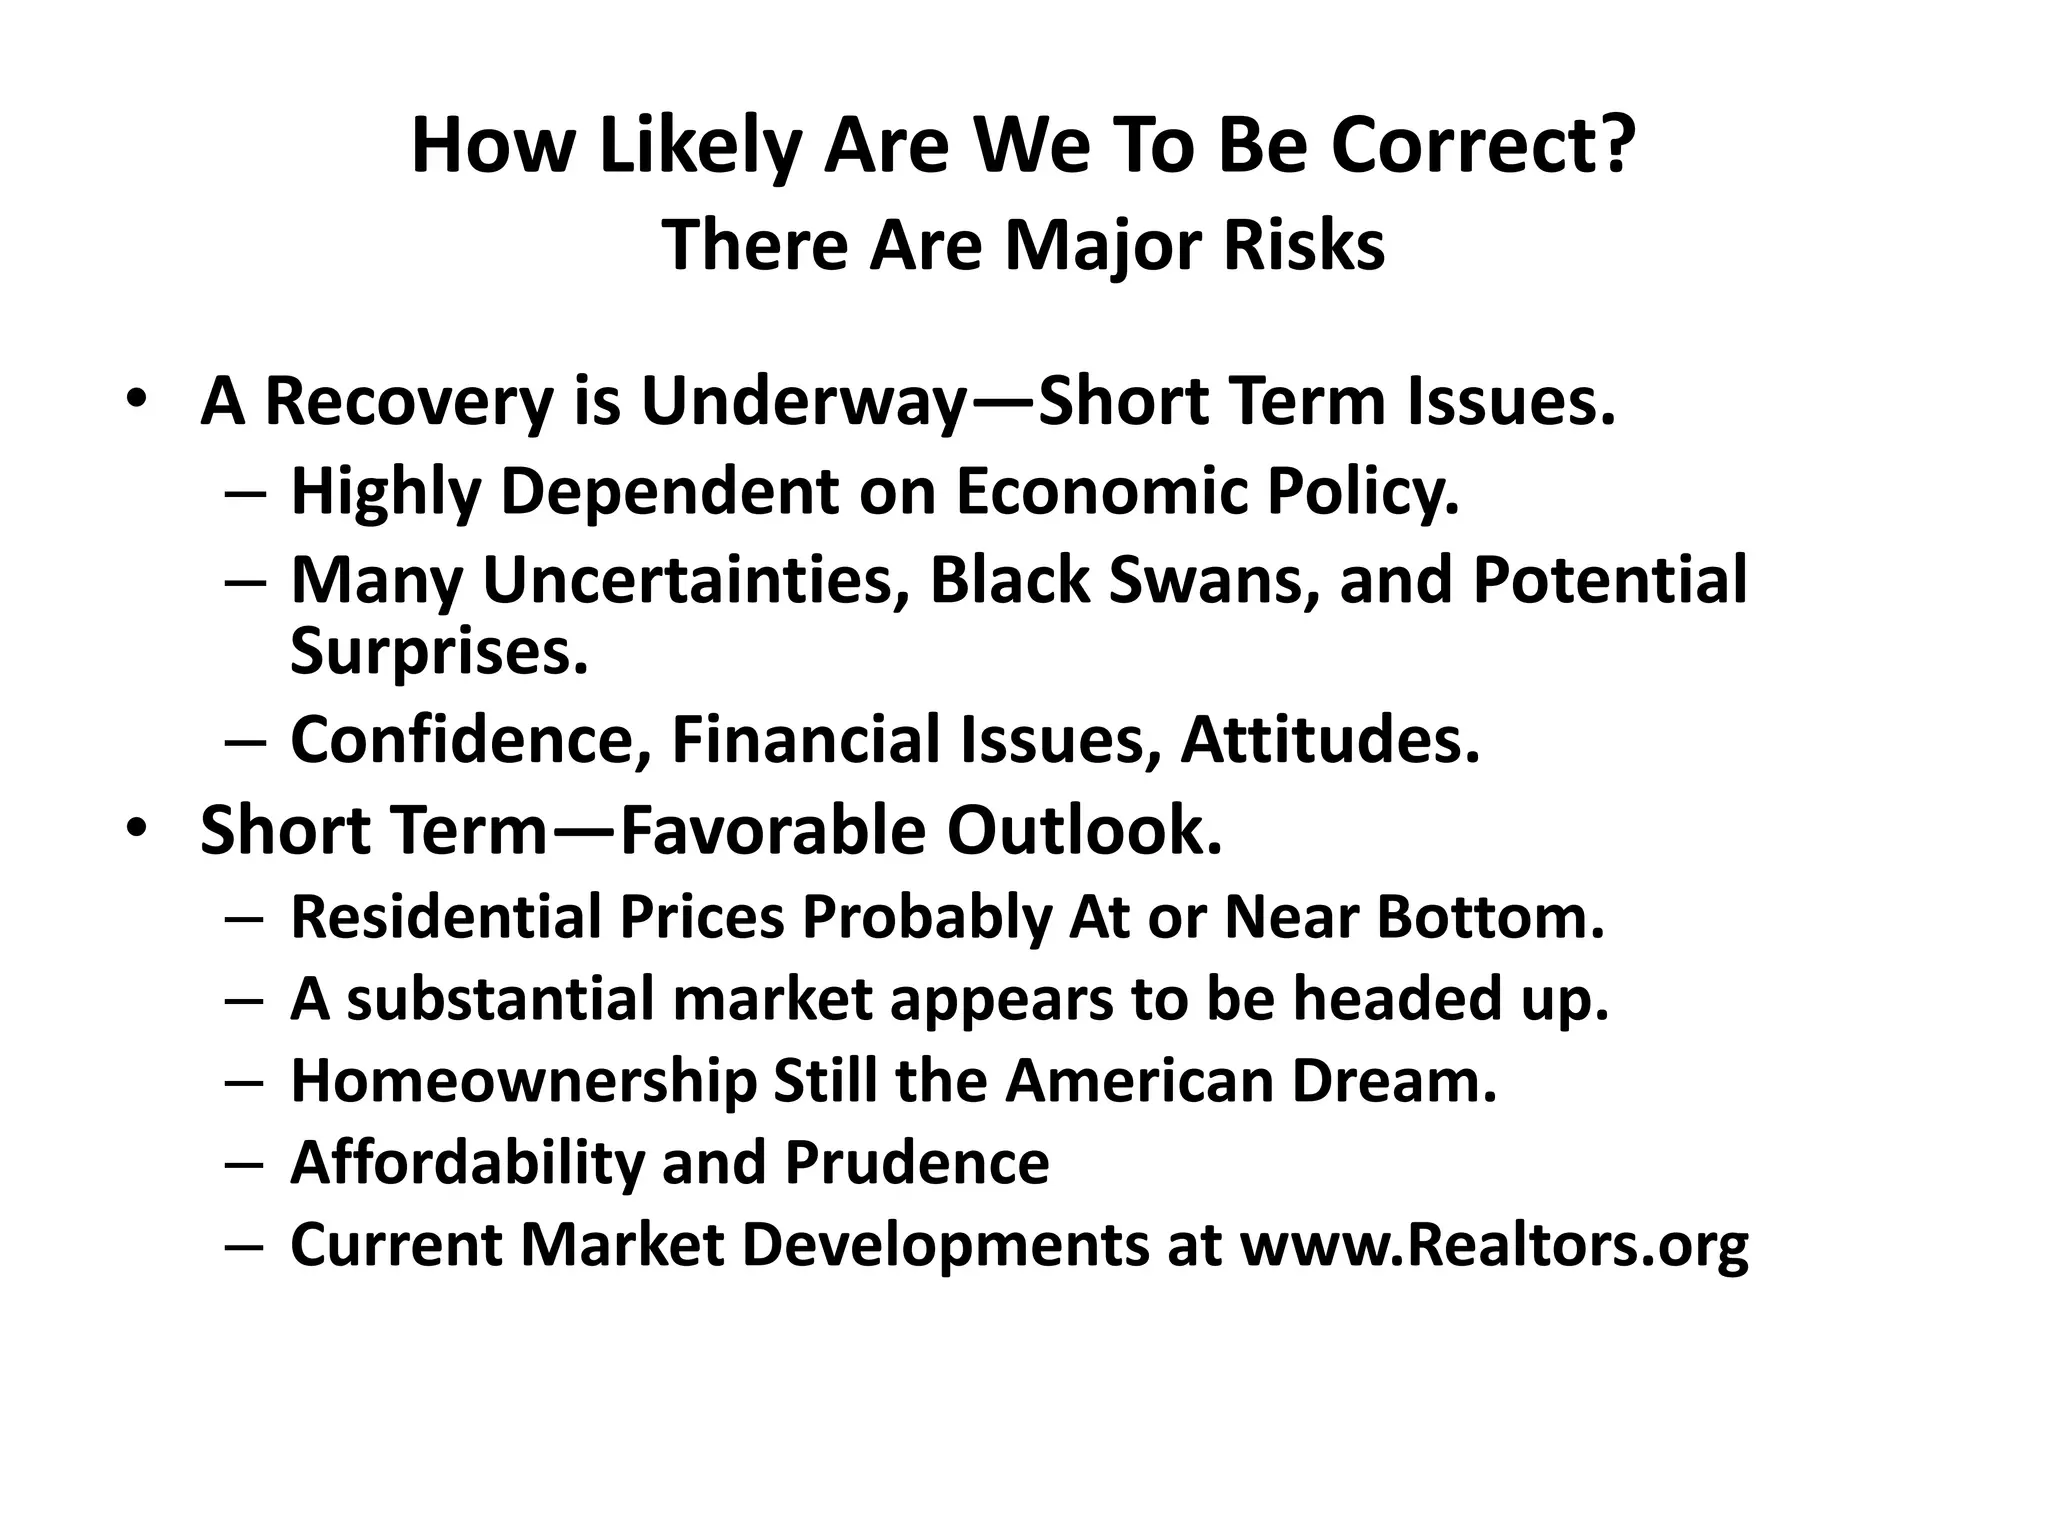


This document provides a summary and analysis of the US economy and housing market by Jed Smith of the National Association of Realtors. It discusses how the economy gradually recovered from the Great Recession in a slower and weaker manner than past recessions. While home prices seem to be stabilizing and affordability is high, challenges remain around availability of credit, high unemployment, and consumer confidence. The outlook forecasts continued recovery, but notes many risks and uncertainties depend on government policies around jobs, spending, taxes, and housing programs.